
Journal of Tropical Oceanography >
A study of near-inertial oscillations in the northern South China Sea based on in-situ observations during the passage of Typhoon Kalmaegi
Received date: 2018-01-25
Online published: 2018-12-24
Supported by
Natural Science Foundation of China (41430964, 41521005, 41776005);Key Research Program of Frontier Sciences, Chinese Academy of Sciences (QYZDJ-SSW-DQC034)
Copyright
In this study, the vertical characteristics of near-inertial oscillations (NIOs) induced by Typhoon Kalmaegi are analyzed by using data from two moorings about 20 km apart in the northeastern South China Sea in Sept. 2014. The results show that the energy of typhoon-induced NIOs, which propagates downward into the ocean interior, increases with depth in the upper layer and becomes maximum in the mid layer before dissipating with depth. However, we find that there is a large difference in vertical characteristics of typhoon-induced NIOs between the two moorings. The NIOs at mooring A had three different vertical phase velocities at different depths while the NIOs at mooring B showed invariable phase velocity. The value and depth of the maximum near-inertial kinetic energy (NIKE) are also different at the two moorings. The maximum NIKE was 15% greater at mooring B than at mooring A. After the passage of Kalmaegi, fD2 via nonlinear wave interaction between f and D2 occurred at the two moorings, except that the intensities of fD2 at the two moorings were different. At mooring A, fD2 changed with depth and its interaction between f and D2 was weak. The energy of fD2 at mooring B enhanced at the full depth, and the kinetic energy and velocities of fD2 and f had a good correlation for their time-space distributions and variations. The difference of vertical phase velocity of NIOs and fD2 at the two moorings may be caused by the effects of eddy and different stratifications.
HUANG Yandan , XU Jiexin , LIU Junliang , CHEN Zhiwu , CAI Shuqun . A study of near-inertial oscillations in the northern South China Sea based on in-situ observations during the passage of Typhoon Kalmaegi[J]. Journal of Tropical Oceanography, 2018 , 37(6) : 16 -25 . DOI: 10.11978/2018014
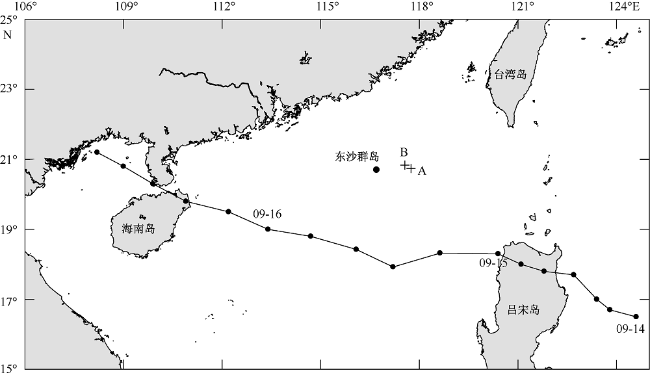
Fig. 1 Locations of moorings A and B (+) and the track of Typhoon Kalmaegi (line with dots). |
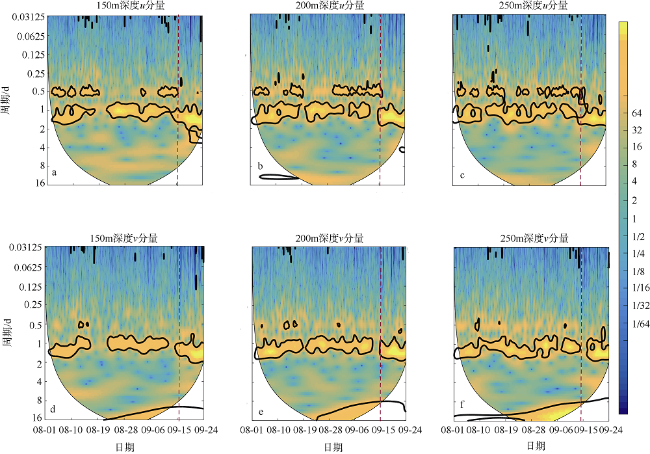
Fig. 2 Continuous wavelet power spectra of u (a-c) and v (d-f) components of total observed currents at depths of 150 m (a, d), 200 m (b, e), and 250 m (c, f) at mooring A. |
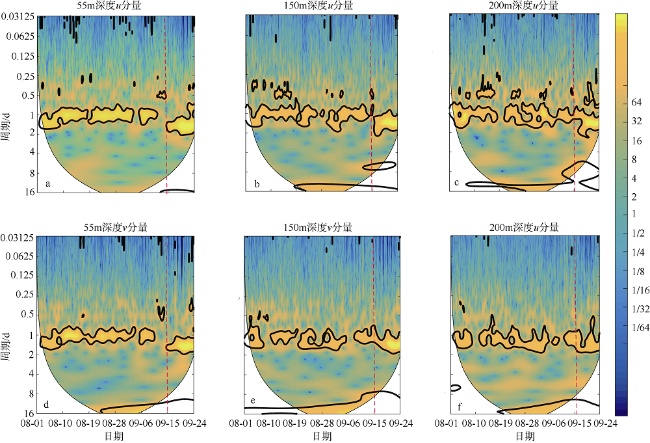
Fig. 3 Same as |
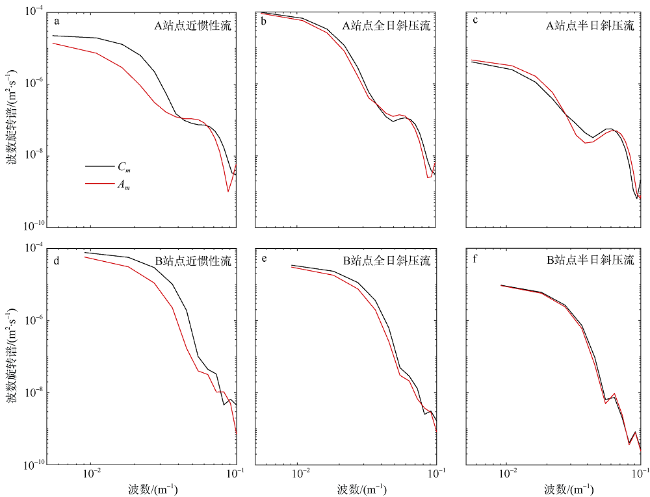
Fig. 4 Wave number rotary spectra of the three main frequencies of baroclinic currents at moorings A (a-c) and B (d-f). Cm is the clockwise rotary spectrum, and Am is the anticlockwise rotary spectrum. |
Fig. 5 u in the upper 600 m observed at moorings A (a) and B (b). |
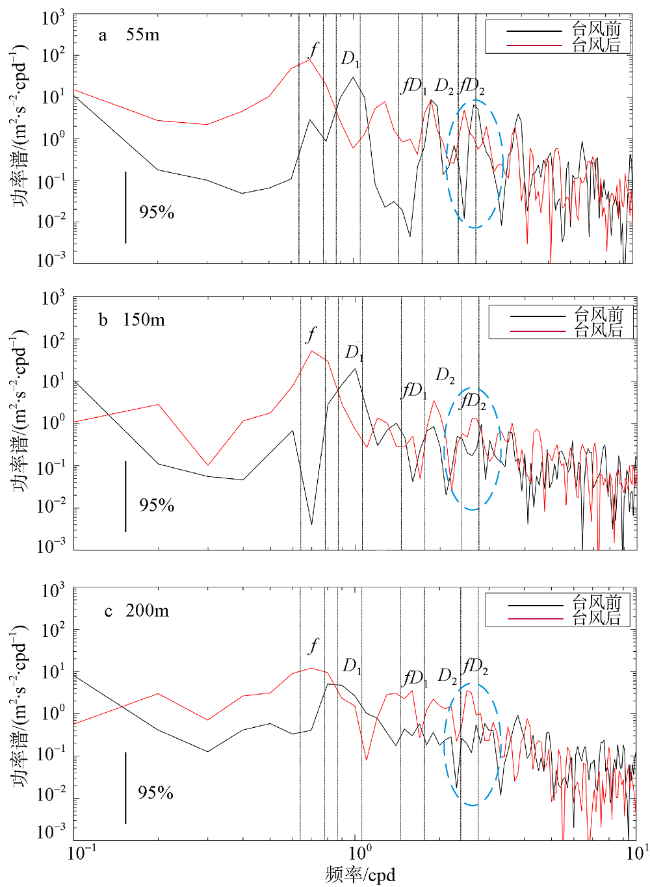
Fig. 6 Power spectra of u before (Sep. 5~14) and after (Sep. 15~24) Typhoon Kalmaegi at depths of (a) 150 m, (b) 200 m and (c) 250 m at mooring A. |
Fig. 7 Same as |
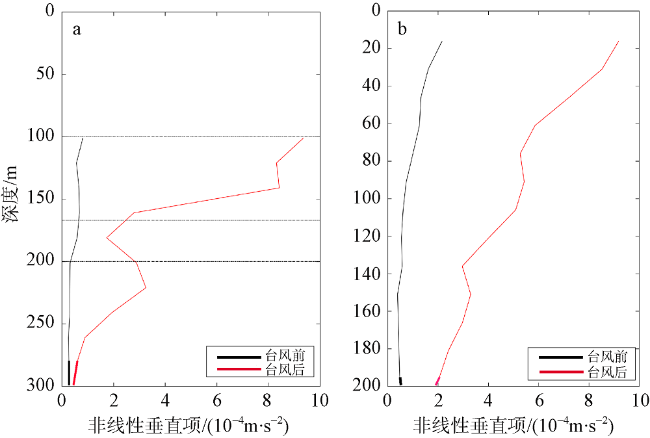
Fig. 8 Vertical distributions of amplitude of vertical nonlinear terms at moorings A (a) and B (b) before and after Typhoon Kalmaegi. |
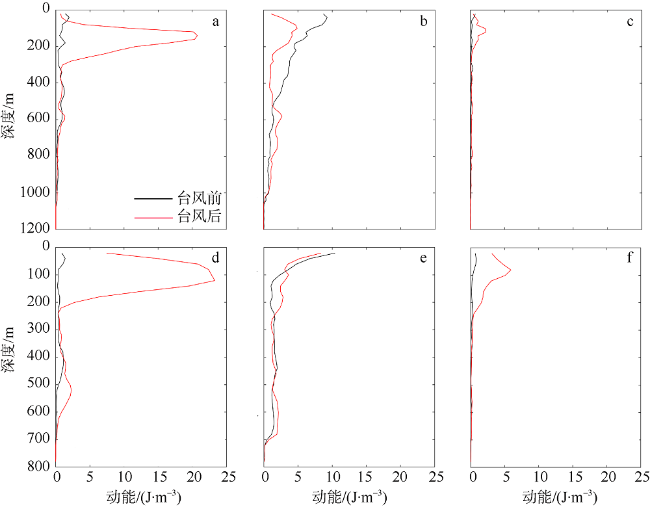
Fig. 9 Vertical distributions of kinetic energy of f, D2 and fD2 before (the black line) and after (the red line) Typhoon Kalmaegi at moorings A (a-c) and B (d-f)图9 站点A (a—c)、B (d—f)台风前(黑色实线)和台风后(红色实线)f动能 (a、d), D2动能(b、e)和fD2动能 (c、f)垂向分布 |
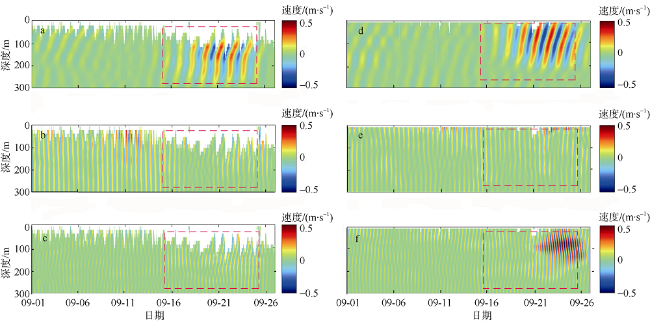
Fig. 10 Distributions of the east-west components of currents at frequencies f (a, d), D2 (b, e) and fD2 (c, f) at moorings A (a-c) and B (d-f)图10 站点A(a—c)、B(d—f)的f频带(a、d), D2频带(b、e)和fD2频带(c、f)滤波的东西向流速分量分布 |
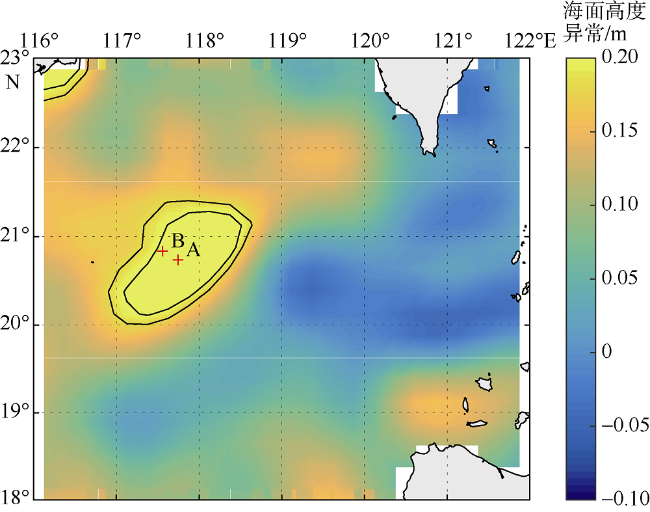
Fig. 11 Distribution of sea level anomaly on Sep. 22图11 9月22日海面高度异常值分布 |
The authors have declared that no competing interests exist.
| [1] |
|
| [2] |
|
| [3] |
|
| [4] |
|
| [5] |
|
| [6] |
|
| [7] |
|
| [8] |
|
| [9] |
|
| [10] |
|
| [11] |
|
| [12] |
|
| [13] |
|
| [14] |
|
| [15] |
|
| [16] |
|
| [17] |
|
/
| 〈 |
|
〉 |


