Marine Meteorology

Spatial patterns and secular trends of wind energy input into the surface layer in the South China Sea based on SODA reanalysis

  • YANG Qian , 1, 5 ,
  • CUI Chaoran 2, 5 ,
  • ZHANG Yu 1, 5 ,
  • LIU Zhiyu 3 ,
  • GUAN Yuping , 1, 5, 6 ,
  • HUANG Ruixin 4
Expand
  • 1. State Key Laboratory of Tropical Oceanography (South China Sea Institute of Oceanology, Chinese Academy of Sciences), Guangzhou 510301, China
  • 2. CAS Key Laboratory of Ocean Circulation and Waves (Institute of Oceanology, Chinese Academy of Sciences), Qingdao 266071, China
  • 3. College of Ocean and Earth Sciences, Xiamen University, Xiamen 361005, China
  • 4. Woods Hole Oceanographic Institution, Woods Hole, MA02543, USA
  • 5. College of Earth and Planetary Sciences, University of Chinese Academy of Sciences, Beijing 100049, China
  • 6. Zhuhai Joint Innovative Center for Climate-Environment-Ecosystem, Zhuhai 519078, China;
Corresponding author: GUAN Yuping.

Received date: 2017-12-18

  Online published: 2018-12-24

Supported by

National Natural Science Foundation of China (41676021, 41541040, 91228202);Visiting Fellowship (MELRS1608) from the State Key Laboratory of Marine Environmental Science (Xiamen University)

Copyright

热带海洋学报编辑部

Abstract

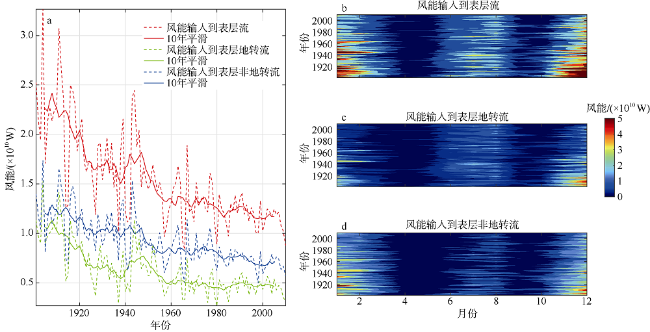
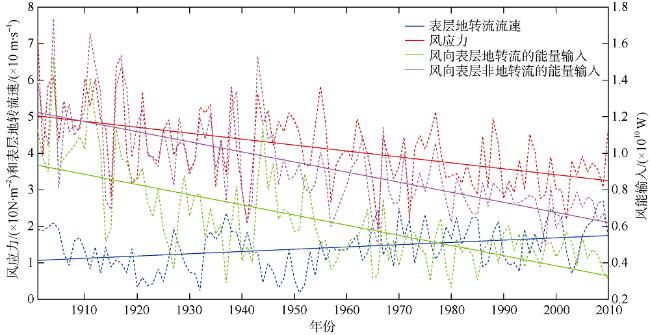
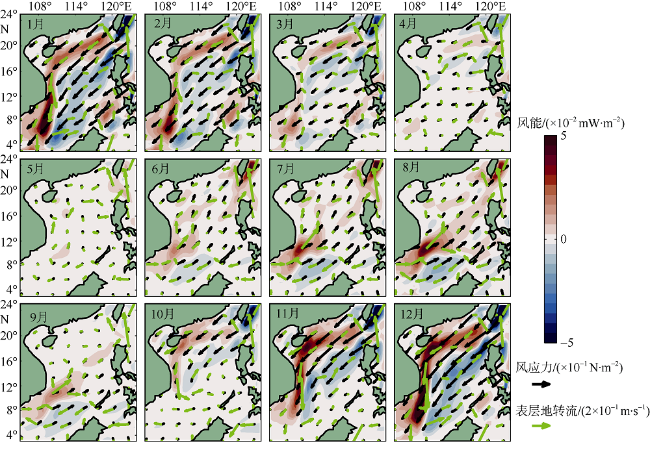
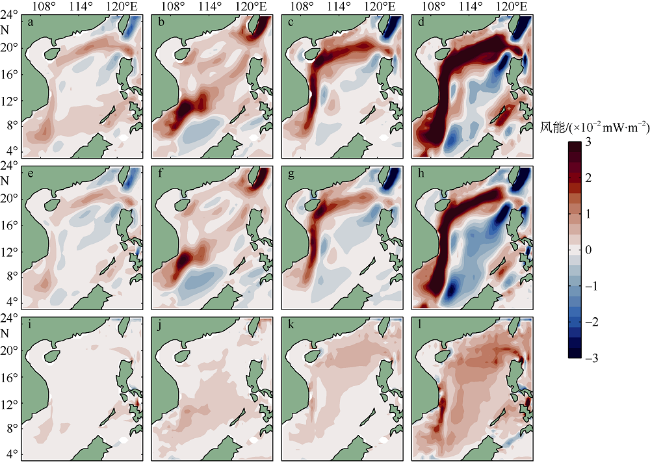
Sea surface wind is not merely a major driving force to the upper-ocean currents; the wind energy input is the main source of mechanical energy to keep these currents moving. To analyze the secular trend of wind energy input into the South China Sea (SCS), we calculate the wind energy input into the surface current, surface geostrophic current and surface ageostrophic current from 1901 and 2010 by using SODA (v 2.2.4) data. The results show that during the past 110 years, the trend of the wind energy input into surface current, surface geostrophic current and surface ageostrophic current decreased on the whole. The reducing amplitude is 56%, 65% and 49%, respectively. The dominant factor is the decline of wind stress (about 35%). Due to the monsoon systems, seasonal variation of wind energy input into the SCS is significant. In winter, the wind energy input is the strongest, mainly in the north and west parts of the basin, and the shape of energy input distribution is like a “boomerang.” Our results have some implication for further understanding SCS circulation in terms of energy.

Cite this article

YANG Qian , CUI Chaoran , ZHANG Yu , LIU Zhiyu , GUAN Yuping , HUANG Ruixin . Spatial patterns and secular trends of wind energy input into the surface layer in the South China Sea based on SODA reanalysis[J]. Journal of Tropical Oceanography, 2018 , 37(6) : 41 -48 . DOI: 10.11978/2017134

由大气风场输入海洋的机械能是驱动大尺度海洋环流和维持深海层化的主要能源, 而大气与海洋之间的能量交换更是认知地球气候的一个重要参量。这种能量交换的定量化方式之一是通过风对海洋做功。由于风做功是按照海洋表层流与海面风应力的相互作用计算的, 因此有若干个表层流分量可用于计算风对海洋做功的分量。表面压力梯度与科里奥利效应平衡形成地转流, 而非地转流一般定义为任何不是处于地转平衡的流动, 由于它包括多类流动, 因此计算较为困难。埃克曼流是非地转流的主要分量, 由表面风应力与科里奥利效应平衡而形成。风能输入海洋主要靠风应力和大气压强的贡献。风应力可以驱动表层流和波浪, 表层流可以分解为地转流、非地转流两部分。其中, 地转流得到的风能不仅直接供给上层大尺度流动, 而且可以向下传递影响深层海洋运动, 全球海洋约为0.76~1.02TW (Wunsch, 1998; Huang et al, 2006; Dawe et al, 2006; Von Storch et al, 2007; Hughes et al, 2008; Scott et al, 2009; Lauderdale et al, 2012; Zhai et al, 2012, 2013; Zhai, 2013; Wu et al, 2016)。非地转流项主要用于维持上层海洋的混合与层化(Brown et al, 2008; Wang et al,2004; Urakawa et al, 2009); Wang等(2004)估算了1997—2002年风向全球海洋埃克曼层输入的能量约为2.4TW, 且集中在南极绕极流区、北太平洋和北大西洋的北端风暴频发区。后来有不少学者对南极绕极流埃克曼层的能量输入计算进行了定量改进 (Wu et al, 2008; Elipot et al, 2009; Zhang et al, 2013)。南海主要受东亚季风控制, 夏季盛行西南季风, 冬季盛行东北季风(Shaw et al,1999; Morimoto et al, 2000; Fang et al, 2006; Wang et al, 2009)。这种季节性的风场特征对南中国海环流的形成具有很大的影响(Wang et al, 2006; Yang et al, 2015)。因此研究南海的风能输入可以进一步认识环流驱动的动力机制。
SODA(Simple Ocean Data Assimilation, http://soda.tamu.edu)再分析资料是全球海洋研究中最常用的数据之一。最近几年, 南海研究中也得到广泛应用。例如, 南海的环流: 根据SODA 2.0.2-4版资料, 1959—2008年间南海上层冬季环流减弱了10%, 这与近几十年东亚冬季风的减弱相关(Yang et al, 2012); 南海西边界流可视为印尼贯穿流的三个分支之一(Du et al, 2010), 从1950年至2010年间, 其流量体积输送总体呈现出一种缓慢增加的趋势(张成成 等, 2016); 南海的经向翻转流低频变化不仅与内部运动密切相关(Yang et al, 2016; Zhang et al, 2016), 而且其季节变化与太平洋交换有关(Zhu et al, 2016)。南海的盐度: 1972—2010年间90%以上区域表层盐度均呈现下降趋势, 整个南海的年下降速率为5.88‰, 春季下降速率最大, 为6.4‰, 夏季下降速率在四季中最小, 为5.19‰(陈海花 等, 2015)。南海的海温: 根据SODA 2.2.4版资料, 上层温度在20世纪90年代后期有一个由冷向暖的转变, 而且自1990年以来呈变暖趋势 (Wang et al, 2016; Thompson et al, 2017); 根据SODA v 2.0.2-4资料, 对于南海南部混合层海温的季节和年际变化, 前者与季风相关, 而后者与太平洋厄尔尼诺现象相关且滞后5个月(Thompson et al, 2014); 1900年以来南海上层100m增温使得南海北部内波活动呈增加的趋势(DeCarlo et al, 2015)。南海的能量: 根据SODA 2.2.4版资料, 1871—2008年南海波浪的风能输入的年均值约为0.2TW, 其空间分布冬季以南海北部为主, 夏季以南部为主且强度比冬季要弱得多; 风对南海波浪能量的输入一直呈减少趋势, 1950年以来每年减少0.43%(崔超然 等, 2016)。而南海的温差能资源储量丰富, 温差维持在较高水平, 能量密度总体呈逐年上升趋势, 能量的稳定性较好且可实现全年有效开采, 其最佳利用时间为5—7月, 最差利用时间为2—3月(闫恒乾 等, 2017)。本文利用SODA 2.2.4版资料估算1901—2010年南海表层的风能输入, 其中包括表层流、表层地转流和埃克曼层, 并给出其空间分布特征和长期变化趋势。

1 数据和方法

1.1 SODA资料介绍

SODA(Simple Ocean Data Assimilation)海洋数据集是美国马里兰大学采用全球简单海洋资料同化系统开发的一种资料分析数据, 为海洋气候研究提供了一套与大气再分析资料类似的海洋再分析资料。该系统在运行过程中同化了大量的观测资料, 已成为海洋研究常用的海洋同化资料。随着同化技术的发展和观测资料的更新, SODA资料已经发展出多个版本, 本文采用SODA 2.2.4 版。该版本数据时间起止为1871年1月—2010年12月。数据包括水平速度(u)、垂直速度(v)、盐度(salt)、现场温度(temp)、纬向风应力(taux, 单位N·m-2)、经向风应力(tauy), 水平空间分辨率为0.5°×0.5°, 时间分辨率为月平均, 垂向分为不等距的40层(Carton et al, 2005, 2008; Giese et al, 2011)。本文选取了南中国海区域流场资料, 时间跨度为1901年1月—2010年12月, 地理经纬度范围为3°—24°N, 105°—123˚E。
值得一提的是, 前文介绍了近几年国内外学者用不同版本的SODA数据研究南海的海温、盐度变化, 垂向的温差能量, 以及环流和内波现象等, 其目的之一是要说明具有0.5°×0.5°分辨率的SODA数据也适用于像南海这样的边缘海研究。关于1960年之前SODA数据的有效性问题, DeCarlo等(2015)研究了1900—2008年间的南海内波, 对SODA 2.2.4 版早期资料中的温度数据有效性做过检验。我们最近的工作(崔超然 等, 2016)用SODA 2.2.4 版数据在估算1871—2008年南海波浪的风能输入时, 检验过早期风应力数据的有效性, 主要依据是Cardone等(1990)的工作, 从1900到1984年间船测南海的风场存在着明显的减弱趋势。另一方面, 尽管1871—1960年间的SODA数据是主要根据大气和零星的海温资料(Giese et al, 2011), 本文研究的是南海表层的风能输入, 主要用其风应力数据, 其有效性也是可信的。所以用SODA 2.2.4 版资料估算1901—2010年南海表层的风能输入是可行的。

1.2 主要计算方法

1.2.1 通过表层流输入的功
根据Huang等(2006), 通过表层流输入的风应力能量可采用公式:
${{W}_{\text{s}}}=\iint{({{\tau }_{x}}\times {{u}_{\text{s}}}}+{{\tau }_{y}}\times {{v}_{\text{s}}})\text{d}S$
式中: Ws为通过表层流输入的功,${{\tau }_{x}}$和${{\tau }_{y}}$分别为纬向和经向风应力, usvs分别为纬向和经向的表层流速, S为海域面积。
1.2.2 通过地转流输入的功
根据Huang等(2006), 输入地转流的风能可采用公式:
$\mathop{v}_{\text{g}}=\frac{g}{f}\times \nabla SSH$
${{W}_{\text{g}}}=\iint{({{\tau }_{x}}\times {{u}_{\text{g}}}}+{{\tau }_{y}}\times {{v}_{\text{g}}})\text{d}S$
其中, ugvg分别为纬向和经向地转流速度, g为重力加速度, f为科氏参数, SSH为绝对海平面高度, ${{\tau }_{x}}$和${{\tau }_{y}}$分别为纬向和经向风应力, S为海域面积。
1.2.3 通过非地转流输入的功
根据Huang等(2006), 表层流速可以分解为地转流速与非地转流速两部分(V0=Vg+Vag), 可知风对非地转流的能量输入可采用公式:
${{W}_{\text{ag}}}=W\text{s}-{{W}_{\text{g}}}$
式中, WagWsWg分别为通过非地转流、表层流与地转流输入的功。

2 结果分析

2.1 风能输入的时间演变

根据Huang等(2006)文章中的公式, U0=Ug+Uag计算风能输入可知总的风能输入等于向表层地转流输入能量与向表层非地转流能量输入之和。如图1a所示, 风向表层地转流的能量输入约占向表层流能量输入的40%, 剩下的60%为表层非地转成分。该结果与全球风能输入的地转成分(0.87TW)和非地转成分(0.29TW)的占比恰恰相反(Huang et al, 2006)。这表明风向南海输入的能量较大部分用于维持埃克曼螺旋。从时间的演变上可以看出, 风向表层流、表层地转流以及表层非地转流的能量输入均呈现出显著的下降趋势。从1901年到2010年风能输入分别减少了约56.0%、64.9%和49.2%。此外, 从图1b—d中的月平均变化可以看出, 风向三者的能量输入还具有显著的季节性变化特征, 都呈现出冬季最强, 春、秋季最弱的趋势。这主要是由于冬季风远强于其余三个季节, 而夏季风强度位居第二导致的。同时, 在这110年期间, 冬季的风能输入在逐渐减弱, 与年平均的整体时间变化趋势一致(图1a)。
Fig. 1 Time evolution of wind energy input into the South China Sea from 1901 to 2010.
Red curves denote energy input into surface current, green curves denote energy input into surface geostrophic current and blue curves denote energy input into surface ageostrophic current at (a). Dotted curves are the yearly mean signals, and solid curves are 10-year smoothed signal. Their monthly energy inputs are showed in (b), (c) and (d), respectively

图1 1901—2010年南海风能输入的时间演变趋势
a. 红、绿、蓝线分别表示风向表层流、表层地转流以及表层非地转流输入能量的逐年变化趋势, 虚线为年平均的结果, 实线为去除头尾5年的10年平滑的结果。b、c、d分别为风向表层流、表层地转流和表层非地转流输入能量的逐月变化趋势

风应力对表层准定常流做功通常定义为风应力与表层流场之积(Huang, 2010)。从图1a中可知风向表层地转流和表层流输入能量的时间演变趋势非常接近, 因此这里我们仅给出风向表层地转流和非地转流能量输入与风应力以及表层地转流速随时间演变的特征, 如图所示(图2)。从图中可以看出, 风向表层地转流和非地转流输入的能量变化趋势与风应力变化趋势基本一致, 呈明显减小状态, 而与表层地转流流速变化趋势基本相反。在所选的110年间, 南海海面风应力呈明显的减小趋势, 下降了约35.3%, 而表层地转流流速大小则表现为增大趋势, 在量值上增加了约63.5%。在这两者变化的趋势下, 风向表层地转流输入的能量仍呈减小趋势, 且该减小趋势大于风应力在这期间的整体减小趋势, 原因主要有以下两点: 1) 风应力在量值大小上比地转流速大得多, 因此它的减少趋势对风能输入的变化影响更大; 2) 为了简便, 该图仅计算风应力和地转流流速的矢量大小, 并未考虑其方向。虽然流场主要由风应力驱动, 但影响流速的因素还有很多, 二者方向并不完全一致, 这从后面的图4中也可以看出。因此风向地转流输入的能量与风应力以及流速之间的关系变得更为复杂。
Fig. 2 The time series of wind energy input and relevant variables in the South China Sea
wind energy input into surface geostrophic current, surface ageostrophic current, wind stress, and surface geostrophic current velocity. Dotted curves are the original signals; dashed and solid curves are the trend of the whole time series. All variables are the South China Sea area-sum results

图2 南海风能输入与相关变量的时间序列图
风向表层地转流、表层非地转流的能量输入、风应力以及表层地转流速的时间演变。虚线表示原始信号, 实线表示趋势线。图中各值均为区域和的结果

Fig. 4 Spatial distributions of monthly wind energy input into surface geostrophic current in the South China Sea. Black vectors denote wind stress, and green vectors denote surface geostrophic current

图4 风向南海表层地转流输入能量的逐月分布图

2.2 风能输入的空间分布

给出了南海海域风向表层流、表层地转流以及表层非地转流输入能量在四个季节的空间分布情况(图3)。从中可以看出, 风输入给表层流和表层地转流的能量四季空间分布情况极为相似, 但前者在量值上略大于后者。风能输入在冬季最强, 呈现出显著的“回旋镖”状的结构, 春季最弱。南海受季风系统的控制, 一年周期内存在东北季风和西南季风。冬季期间, 盛行的东北季风在南海西边界流海域和北部海区产生了能量输入高值区域, 输入值超过50mW·m-2。能量负值输入区域集中在吕宋岛、台湾岛以及加里曼丹岛附近海域。春季时期, 东北季风逐渐消退, 这期间风应力不断减小, 故该季节的风能输入值与冬季相比大幅度减小, 但此时的风能输入口与冬季相似。南海地区夏季盛行西南季风, 风能输入主要集中在中南半岛东部108°—114°E, 8°—12°N之间的海区以及台湾岛东南部海域。秋季为季风的转换时期, 西南季风开始向东北季风转变并逐渐增强, 因此该时期的风能输入具有冬、夏两季的特征。风输入给表层非地转流的能量也具有明显的季节变化, 并且同样受季风控制。冬季, 强大的东北季风在南海西部形成强劲的西边界流, 因此冬季风输入给南海非地转流的能量主要出现在南海的北部和西边界流区域, 最大输入值超过20mW·m-2。春季, 南海海面虽然依然被东北季风控制, 但是风速减弱了很多, 故该季节时期的风能输入值也大幅减小。虽然夏季也有季风盛行, 但输入量远远没有冬季的大, 能量输入的主要区域是中南半岛东南部海域。到了秋季, 西南季风减退, 东北季风兴起, 能量输入主要集中在南海北部海域和台湾岛东南部海区, 能量输入最高值超过10mW·m-2。表层非地转流的风能量输入预示了南海上层混合的空间分布情况。
Fig. 3 Spatial patents of seasonal wind energy input into surface current (a, b, c, d), surface geostrophic current (e, f, g, h) and surface ageostrophic current (i, j, k, l) in the South China Sea

图3 风向南海表层流(a—d)、表层地转流(e—h)和表层非地转流(i—l)输入能量的季节分布图

图3给出了风向表层流、表层地转流输入能量的四季分布, 两者的分布特征基本一致, 仅在强度上存在微弱差别。因此在这一基础上, 给出了风向表层地转流输入能量的110年期间的月平均空间分布, 以及相同处理的风应力和表层地转流的矢量分布情况(图4)。从图4可以看出一年中输入表层地转流场的风能随着季风系统的两次转向而呈现的变化特征。1月, 风场表现为较强的东北季风, 风应力较大, 而此时整个南海的表层地转流呈气旋式环流。在北部和西部沿岸一侧, 风应力与地转流流速方向一致且量值较大, 因此该处的风能输入呈现较大的正值, 为全年的第一个峰值; 而在海域南部和东部, 风应力与地转流流速方向相反且量值略有减小, 从而使这一片海域的风能输入为负值且在强度上略小于靠岸一侧。同样在南沙群岛东南侧, 菲律宾与马来西亚之间的海域也呈现如此的分布, 只是在量值上显著减小了。之后, 随着风应力逐渐减小, 表层地转流场流速也不断减弱, 导致风能输入逐渐减弱, 但在整体分布形态上基本保持不变。到5月时, 西南季风开始形成, 此时表层地转流的流向与风应力方向趋于正交, 能量输入为全年最小。随后西南季风逐渐增加, 流场逐渐趋于反气旋特征, 能量输入从西南角开始增加, 在8月份达到全年的第二个峰值时刻, 但是与冬季相比, 仍然较弱, 并且主要集中在海盆的西南角。之后, 季风再次转向, 图中9月与10月的对比充分反映了这一变化, 前者风应力、流场以及能量输入高值区均在南海南部海域, 后者则完全相反, 只集中南海的北部海域。11月、12月又逐渐形成了与1月相近的特征。由此可见, 在一年之中, 南海海域风向表层地转流的能量输入主要受季风系统演变的影响, 从而呈现出与之相关的非常有规律的季节性特征。

3 结果与讨论

基于110年(1901—2010)的SODA 2.2.4版资料, 本文分析了风向南海表层流的能量输入。因为在赤道带(±3°以内)之外, 输入到表层流中的风应力能量可以分解为地转流和非地转流两部分, 其中输入地转成分的能量可以通过风应力与表层地转流之积求得, 非地转流的成分则可以通过总的表层流和地转流之差求得。分析结果表明, 风向南海表层流、表层地转流和表层非地转流的能量输入总体上呈减弱趋势, 这是因为风能输入主要受风应力影响, 而这期间的风应力主要表现为减小趋势, 110年间分别减小约56%、65%和49%。导致风能输入减小的最主要因素是风应力的减弱(减小了35%)。Cardone等(1990)曾利用船测数据明确指出1900年到1984年南海的风应力呈明显的减弱趋势。风向三者的能量输入都具有显著的季节性分布特征, 冬季强度最大、春秋最小、夏季居中, 这基本上是因为南海由季节性风场控制所致。从空间分布上看, 能量输入受季风系统随季节演变的影响很大, 最大风能输入的区域主要集中在南海北部和西部区域, 呈一个显著的“回力镖”状结构。“回力镖”结构的形成由于风场和流场在特殊位置同时处于高值区, 而且两者的方向也更加趋于平行。这种特征在风能向表层流和表层地转流的输入分布中最为显著。从110年期间的月平均空间分布上可知, 风向南海输入的能量对风应力变化的响应非常显著。其中对于风向表层地转流的能量输入而言, 风应力与流速的方向关系也会对其产生影响。
本文基于SODA数据的分析基本上给出了风向南海表层流、表层地转流和表层非地转流能量输入的时空分布。其中风向表层地转流输入的能量可以直接通过垂向的动位能转换而传递到深海, 驱动深海环流; 同时输入到非地转流中的能量也可以通过埃克曼泵吸的作用间接的引起深海的运动。因此本文的研究对于进一步研究南海次表层乃至深层的环流有重要的参考价值。
尽管本文较为清晰地给出了能量输入变化的趋势, 但是仍存在一些不足之处。首先, 本文仅采用了一种数据。一方面是因为实测数据很少, 且不可能达到百年之久; 另一方面不同的数据之间由于采用的同化或建模的方法不同, 也会导致一定的差别, 而这些差别实际上是没有意义的。其次, SODA数据作为再分析资料, 本身也会存在一定误差, 但是这已经超出了本文的研究范围。这些原因都可能会带来一定的误差, 我们希望在未来的研究中能够更详细地探讨这些问题。

The authors have declared that no competing interests exist.

[1]
陈海花, 李洪平, 何林洁, 等, 2015. 基于SODA数据集的南海海表面盐度分布特征与长期变化趋势分析[J]. 海洋技术学报, 34(4): 48-52.

CHEN HAIHUA, LI HONGPING, HE LINJIE, et al, 2015. Analysis on the distribution characteristics of sea surface salinity and its long-term variation trend in the South China Sea based on SODA data set[J]. Journal of Ocean Technology, 34(4): 48-52(in Chinese with English abstract).

[2]
崔超然, 管玉平, 朱耀华, 等, 2016. 风对南海波浪的能量输入及其长期变化[J]. 热带海洋学报, 35(4): 21-30.

CUI CHAORAN, GUAN YUPING, ZHU YAOHUA, et al, 2016. Wind energy input and its secular change of surface waves in the South China Sea[J]. Journal of Tropical Oceanography, 35(4): 21-30(in Chinese with English abstract).

[3]
闫恒乾, 王辉赞, 周树道, 等, 2017. 基于SODA资料的太平洋及我国周边海域温差能资源时空特征分析[J]. 海洋学报, 39(11): 128-140.

YAN HENGQIAN, WANG HUIZHAN, ZHOU SHUDAO, et al, 2017. Analysis on the temporal and spatial characteristics of the thermal energy in the Pacific Ocean and the sea area surrounding China based on SODA data[J]. Acta Oceanologica Sinica, 39(11): 128-140 (in Chinese with English abstract).

[4]
张成成, 蒋国荣, 陈奕德, 等, 2016. 南海西边界强流区季节和年际变化特征[J]. 海洋预报, 33(6): 81-92.

ZHANG CHENGCHENG, JIANG GUORONG, CHEN YIDE, et al, 2016. Study on seasonal and interannual variation of the SCS western boundary strong current[J]. Marine Forecasts, 33(6): 81-92 (in Chinese with English abstract).

[5]
BROWN J N, FEDOROV A V, 2008. Mean energy balance in the tropical Pacific Ocean[J]. Journal of Marine Research, 66(1): 1-23.

[6]
CARDONE V J, GREENWOOD J G, Cane M A, 1990. On trends in historical marine wind data[J]. Journal of Climate, 3: 113-127.

[7]
CARTON J A, GIESE B S, GRODSKY S A, 2005. Sea level rise and the warming of the oceans in the Simple Ocean Data Assimilation (SODA) ocean reanalysis[J]. Journal of Geophysical Research, 110(C9): C09006.

[8]
CARTON J A, GIESE B S, 2008. A reanalysis of ocean climate using Simple Ocean Data Assimilation (SODA)[J]. Monthly Weather Review, 136(8): 2999-3017.

[9]
DAWE J T, THOMPSON L, 2006. Effect of ocean surface currents on wind stress, heat flux, and wind power input to the ocean[J]. Geophysical Research Letters, 33(9): L09604.

[10]
DECARLO T M, KARNAUSKAS K B, DAVIS K A, et al, 2015. Climate modulates internal wave activity in the Northern South China Sea[J]. Geophysical Research Letters, 42(3): 831-838.

[11]
DU YAN, QU TANGDONG, 2010. Three inflow pathways of the Indonesian through flow as seen from the simple ocean data assimilation[J]. Dynamics of Atmospheres and Oceans, 50(2): 233-256.

[12]
ELIPOT S, GILLE S T, 2009. Estimates of wind energy input to the Ekman layer in the Southern Ocean from surface drifter data[J]. Journal of Geophysical Research-Oceans, 114(C6): C06003.

[13]
FANG GUOHONG, CHEN HAIYING, WE ZEXUN, et al, 2006. Trends and interannual variability of the South China Sea surface winds, surface height, and surface temperature in the recent decade[J]. Journal of Geophysical Research-Oceans, 111(C11): C11S16.

[14]
GIESE B S, RAY S, 2011. El Niño variability in simple ocean data assimilation (SODA), 1871-2008[J]. Journal of Geophysical Research, 116(C2): C02024.

[15]
HUANG RUIXIN, WANG WEI, LIU LINGLING, 2006. Decadal variability of wind-energy input to the world ocean[J]. Deep Sea Research Part II: Topical Studies in Oceanography, 53(1-2): 31-41.

[16]
HUANG RUIXIN,2010. Ocean circulation: wind-driven and thermohaline processes[M]. Cambridge: Cambridge University Press.

[17]
HUGHES C W, WILSON C, 2008. Wind work on the geostrophic ocean circulation: An observational study of the effect of small scales in the wind stress[J]. Journal of Geophysical Research-Oceans, 113(C2): C02016.

[18]
LAUDERDALE J M, NAVEIRA GARABATO A C, OLIVER K I C, et al, 2012. Climatic variations of the work done by the wind on the ocean’s general circulation[J]. Journal of Geophysical Research, 117(C9): C09017.

[19]
MORIMOTO A, YOSHIMOTO K, YANAGI T, 2000. Characteristics of sea surface circulation and eddy field in the South China Sea revealed by satellite altimetric data[J]. Journal of Oceanography, 56(3): 331-344.

[20]
SCOTT R B, XU YONGSHENG, 2009. An update on the wind power input to the surface geostrophic flow of the World Ocean[J]. Deep Sea Research Part I: Oceanographic Research Papers, 56(3): 295-304.

[21]
SHAW P T, CHAO S Y, FU L L, 1999. Sea surface height variations in the South China Sea from satellite altimetry[J]. Oceanologica Acta, 22(1): 1-17.

[22]
THOMPSON B, TKALICH P, 2014. Mixed layer thermodynamics of the Southern South China Sea[J]. Climate Dynamics, 43(7-8): 2061-2075.

[23]
THOMPSON B, TKALICH P, MALANOTTE-RIZZOLI P, 2017. Regime shift of the South China Sea SST in the late 1990s[J]. Climate Dynamics, 48(5-6): 1873-1882.

[24]
URAKAWA L S, HASUMI H, 2009. The energetics of global thermohaline circulation and its wind enhancement[J]. Journal of Physical Oceanography, 39(7): 1715-1728.

[25]
VON STORCH J-S, SASAKI H, MAROTZKE J, 2007. Wind-generated power input to the deep ocean: An estimate using a 1⁄10° general circulation model[J]. Journal of Physical Oceanography, 37(7): 657-672.

[26]
WANG BIN, HUANG FEI, WU ZHIWEI, et al, 2009. Multi-scale climate variability of the South China Sea monsoon: A review[J]. Dynamics of Atmospheres and Oceans, 47(1-3): 15-37.

[27]
WANG GUIHUA, CHEN DAKE, SU JILAN, 2006. Generation and life cycle of the dipole in the South China Sea summer circulation[J]. Journal of Geophysical Research-Oceans, 111(C6): C06002.

[28]
WANG WEI, HUANG RUIXIN, 2004. Wind energy input to the Ekman layer[J]. Journal of Physical Oceanography, 34(5): 1267-1275.

[29]
WANG ZHAOYUN, ZHAI FANGGUO, LI PEILIANG, 2016. A shift in the upper-ocean temperature trends in the South China Sea since the late 1990s[J]. Acta Oceanologica Sinica, 35(11): 44-51.

[30]
WU KEJIAN, LIU BIN, 2008. Stokes drift-induced and direct wind energy inputs into the Ekman layer within the Antarctic Circumpolar Current[J]. Journal of Geophysical Research-Oceans, 113(C10): C10002.

[31]
WU YANG, ZHAI XIAOMING, WANG ZHAOMIN, 2016. Impact of Synoptic Atmospheric Forcing on the Mean Ocean Circulation[J]. Journal of Climate, 29(16): 5709-5724.

[32]
WUNSCH C, 1998. The work done by the wind on the oceanic general circulation[J]. Journal of Physical Oceanography, 28(11): 2332-2340.

[33]
YANG HAIYUAN, WU LIXIN, 2012. Trends of upper-layer circulation in the South China Sea during 1959-2008[J]. Journal of Geophysical Research: Oceans, 117(C8): C08037.

[34]
YANG HAIYUAN, WU LIXIN, SUN SHANTONG, et al, 2015. Low-frequency variability of monsoon-driven circulation with application to the South China Sea[J]. Journal of Physical Oceanography, 45(6): 1632-1650.

[35]
YANG ZHITONG, LUO YIYONG, 2016. Low-frequency variability of the shallow meridional overturning circulation in the South China Sea[J]. Acta Oceanologica Sinica, 35(3): 10-20.

[36]
ZHAI XIAOMING, 2013. On the wind mechanical forcing of the ocean general circulation. Journal of Geophysical Research Oceans[J]. Journal of Geophysical Research: Oceans, 118(12): 6561-6577.

[37]
ZHAI XIAOMING, JOHNSON H L, MARSHALL D P, et al, 2012. On the wind power input to the ocean general circulation[J]. Journal of Physical Oceanography, 42(8): 1357-1365.

[38]
ZHAI XIAOMING, WUNSCH C, 2013. On the variability of wind power input to the oceans with a focus on the subpolar North Atlantic[J]. Journal of Climate, 26(11): 3892-3903.

[39]
ZHANG NINGNING, LAN JIAN, MA JIE, et al, 2016. The shallow meridional overturning circulation in the South China Sea and the related internal water movement[J]. Acta Oceanologica Sinica, 35(7): 1-7.

[40]
ZHANG YUMING, WU KEJIAN, ZHANG XIAOSHUANG, et al, 2013. Improving the estimate of wind energy input into the Ekman layer within the Antarctic Circumpolar Current[J]. Acta Oceanologica Sinica, 32(3): 19-27.

[41]
ZHU YAOHUA, FANG GUOHONG, WEI ZEXUN, et al, 2016. Seasonal variability of the meridional overturning circulation in the South China Sea and its connection with inter-ocean transport based on SODA2.2.4[J]. Journal of Geophysical Research: Oceans, 121(5): 3090-3105.

Outlines

/