
Journal of Tropical Oceanography >
Summer phytoplankton responses to upwelling and river plume in northern South China Sea
Received date: 2018-01-01
Online published: 2018-12-24
Supported by
Fundamental Research Funds for the Central Universities (17lgzd20);State Key Laboratory of Tropical Oceanography, South China Sea Institute of Oceanology, Chinese Academy of Sciences (LTO1605);National Natural Science Foundation of China (41306105);National Natural Science Foundation of Guangdong Province (2014A030313169)
Copyright
A coupled physical-biological 3D model was established, which is forced by realistic forcing, to quantify the effects and underlying mechanisms of upwelling and river plume on the spatial distribution of phytoplankton biomass during summer in the northern South China sea (NSCS). The model was validated by using cruise data of 2006 and 2008 and remote-sensing observations from 2006 to 2008. The results suggest that the model satisfactorily captures the processes of coastal upwelling and river plume dynamics that determine phytoplankton distribution. Model results indicate that summer phytoplankton in the NSCS were mainly distributed within 50m isobath. In Qiongdong and Shantou, phytoplankton distributed evenly. Upwelling processes accounted for up to 90% of the biomass, and horizontal advection in the upper layer was the main sink, while biological processes were the main sources for the phytoplankton biomass. In the Pearl River and Shanwei, phytoplankton shows surface and subsurface maxima: the river plume contributed 35%~40% (mainly to the upper layer) of the phytoplankton biomass, and upwelling contributed 60%~65% (mainly to the middle and bottom layers). In Yuexi, the phytoplankton biomass was extremely low in the upper layer, and mainly distributed in the middle and bottom layers; in total, upwelling contributed 92% of phytoplankton biomass. In the NSCS, both upwelling and river plume processes stimulated phytoplankton through nutrient supply. In the upwelling process, nutrient supply reflected the combination of along- and across-shore nutrient transports. The thermocline, which alters vertical nutrient transfer, is the key factor affecting the variable contributions of upwelling and river plume processes for phytoplankton in different layers. Overall, the spatial variation of summer phytoplankton is mainly driven by upwelling and river plume processes, and by the circulation-nutrient-biological coupling effect.
XU Zeting , LI Shiyu , HU Jiatang , WANG Siying , WANG Bin , GUO Mingxian , GENG Bingxu . Summer phytoplankton responses to upwelling and river plume in northern South China Sea[J]. Journal of Tropical Oceanography, 2018 , 37(6) : 92 -103 . DOI: 10.11978/2018001
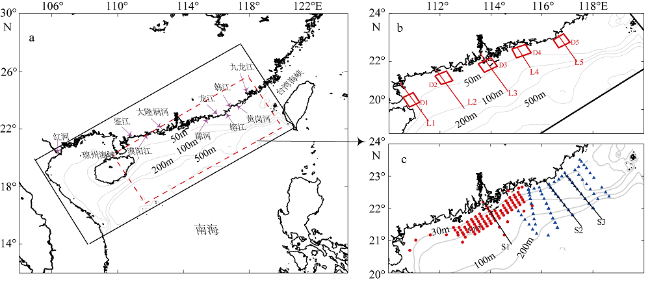
Fig. 1 (a) Model Calculation area (black box) and water depth. |
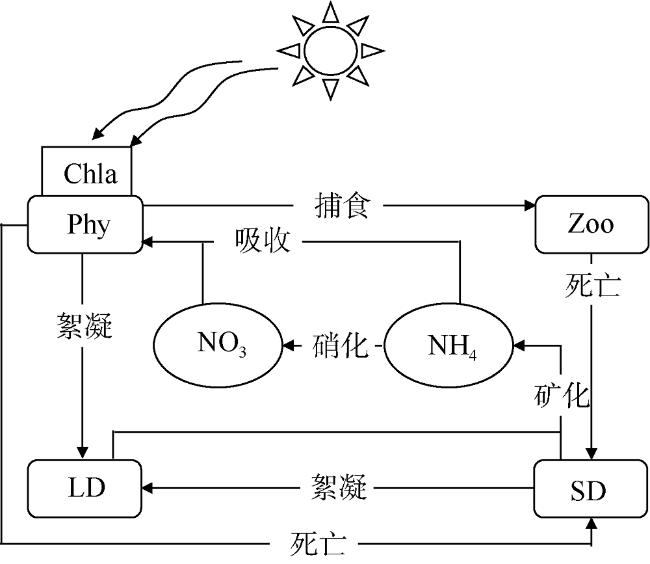
Fig. 2 Schematic of the biological model图2 NPZD生态模型生物地球化学反应过程示意 |
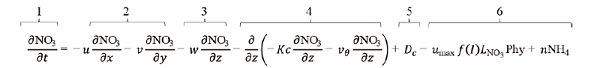 (1)
(1)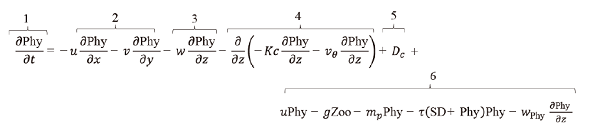 (2)
(2)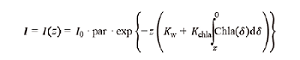 (3)
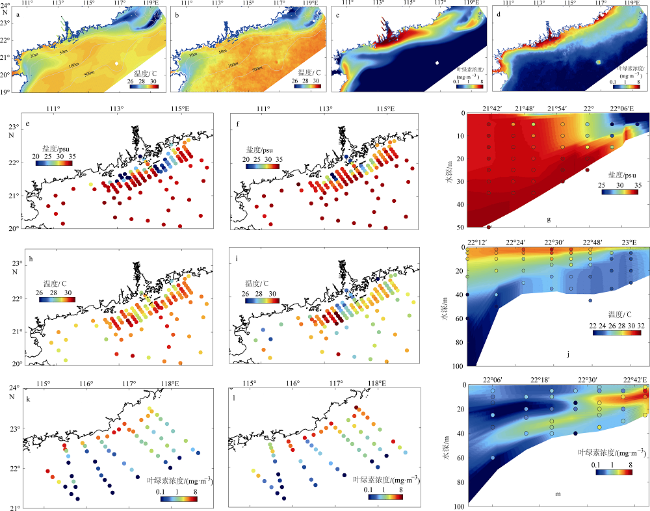
(3)Fig. 3 Comparison of simulated and observed of temperature (℃), salinity (psu) and chlorophyll (mg·m-3)图3 表层温度、盐度和叶绿素浓度模拟值与观测值的比较 |
Tab. 1 Validation metrics of the physical-biological coupling model表1 水动力-生态耦合模型验证统计指标 |
| 验证指标 | 2006—2008年遥感数据 | 2006年大面站 | 2008年大面站 | |||||||||
|---|---|---|---|---|---|---|---|---|---|---|---|---|
| Bias | RMSE | R | RE/% | Bias | RMSE | R | RE/% | Bias | RMSE | R | RE/% | |
| 海表温度 | -0.02 | 0.28 | 0.90 | 0.06 | 1.03 | 0.52 | 0.39 | 1.77 | 0.54 | 1.18 | 0.84 | 1.99 |
| 海表盐度 | — | — | — | — | 3.56 | -1.51 | 0.85 | 4.73 | 0.59 | 2.04 | 0.60 | 1.86 |
| 海表叶绿素 | -0.13 | 1.08 | 0.75 | 17.92 | — | — | — | — | -0.25 | 1.78 | 0.46 | 14.88 |
注: “—”表示缺测; Bias表示平均偏差(计算平均值-观测平均值, 温度单位为℃, 盐度单位为psu, 叶绿素浓度单位为mg·m-3); RMSE表示均方根误差, 单位与Bias一致; R表示模拟值与观测值地相关性系数; RE表示相对平均误差。 |
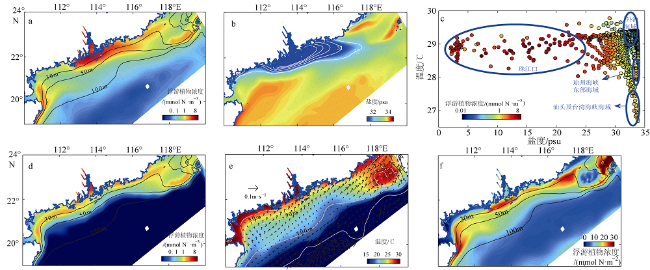
Fig. 4 Summertime surface, bottom and vertically-integrated physical parameters and phytoplankton distribution图4 夏季表层、底层及垂向积分浮游植物及水动力分布 |
Fig. 5 Phytoplankton, temperature and velocity, and NO3 distributions for sections L1~L5图5 L1—L5断面浮游植物、温度、流场和NO3分布 |
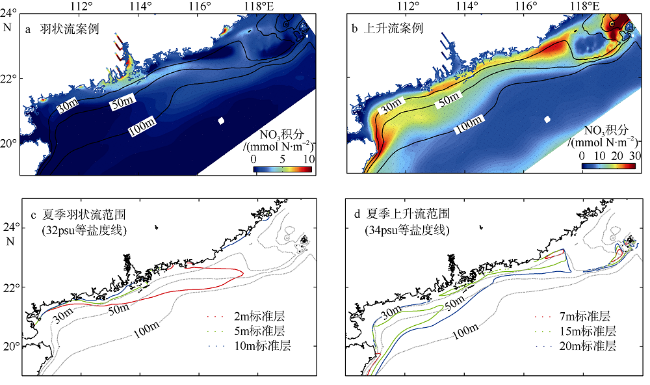
Fig. 6 Vertically-integrated phytoplankton concentration (a, b); upwelling and river plume range (c, d)图6 夏季浮游植物垂向积分浓度的贡献图(a、b)及上升流与羽状流的范围(c、d) |
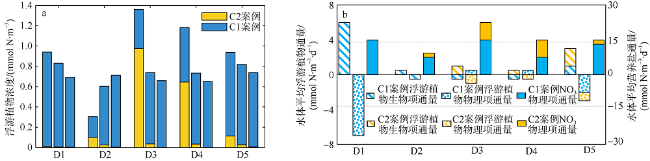
Fig. 7 (a) Upper, middle and bottom layer phytoplankton concentrations in sub-regions. (b) Diagnostic results in sub-regions图7 不同区域C1、C2案例的上、中、底层浮游植物浓度(a)及各区域水体平均诊断项结果(b) |
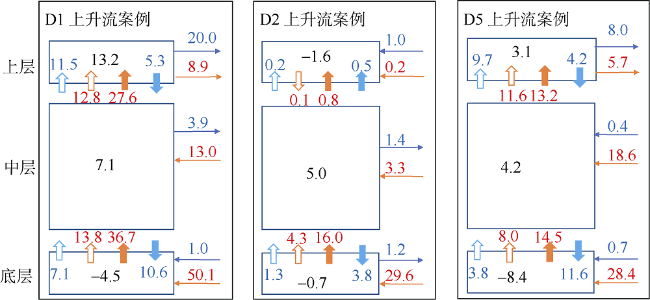
Fig. 8 Phytoplankton and NO3 diagnostic results for sub-regions D1, D2 and D5 in case C1图8 D1、D2和D5区域在C1案例中浮游植物及NO3收支 |
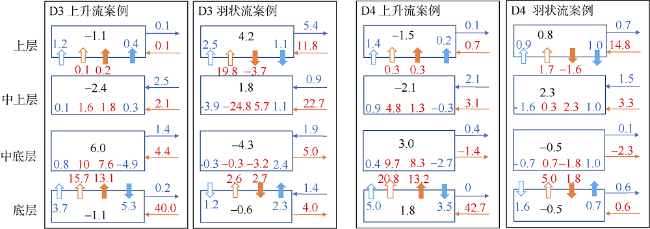
Fig. 9 Same as |
Fig. 10 Vertically-integrated NO3 flux for across (a) and along (b) seashore directions for case C1图10 C1案例水体积分跨岸(a)及沿岸(b)方向NO3通量图 |
The authors have declared that no competing interests exist.
| [1] |
|
| [2] |
|
| [3] |
|
| [4] |
|
| [5] |
|
| [6] |
|
| [7] |
|
| [8] |
|
| [9] |
|
| [10] |
中华人民共和国国家质量监督检验检疫总局, 中国国家标准化管理委员会, 2008. GB/T 12763.7-2007 海洋调查规范第7部分: 海洋调查资料交换[S]. 北京: 中国标准出版社.
|
| [11] |
|
| [12] |
|
| [13] |
|
| [14] |
|
| [15] |
|
| [16] |
|
| [17] |
|
| [18] |
|
| [19] |
|
| [20] |
|
| [21] |
|
| [22] |
|
/
| 〈 |
|
〉 |


