
Journal of Tropical Oceanography >
Inundation risk assessment of storm surge along Lei Zhou coastal areas*
Received date: 2018-06-25
Request revised date: 2018-10-30
Online published: 2019-01-16
Supported by
National Key Research and Development Program of China (2016YFC1401503)
Water Resource Science and Technology Innovation Program of Guangdong Province (2016-02)
Copyright
A storm surge and wave coupled inundation simulation model for Lei Zhou coastal areas at high resolution has been established based on ADCIRC (a parallel advanced circulation model for oceanic, coastal and estuarine waters) and SWAN (simulating waves nearshore) ocean numerical models. A total of 1415 typhoon cases that seriously impacted Lei Zhou were simulated. The result of contrastive analysis shows that wave has a significant impact on storm surge in Lei Zhou coastal areas. We designed 35 typhoon cases based on 8007 typhoons, and reserve flooded area and submerged depth for seven different grades. The inundated area of Lei Zhou can reach 463.2 km2 under 900 hPa grade. We developed 60 cases of possible maximum storm surge and calculated the biggest inundated extent and depth. Under the impact of maximum typhoon, the sea water will spill over seawalls and cause serious flooding disaster. The total submerged area is 602.0 km2 in Lei Zhou. The area whose dangerousness is first grade with flooding depth bigger than 3 m is 465.8 km2. The eastern coastal areas of Lei Zhou will face larger storm surge disaster risk than the western coastal areas. The results of the study have important implications for guiding prevention and mitigation work of storm surge disaster in Lei Zhou.
Key words: storm surge; coupled model; inundation; risk assessment
ZHANG Min , LUO Jun , HU Jinlei , ZENG Xuezhi . Inundation risk assessment of storm surge along Lei Zhou coastal areas*[J]. Journal of Tropical Oceanography, 2019 , 38(2) : 1 -12 . DOI: 10.11978/2018046
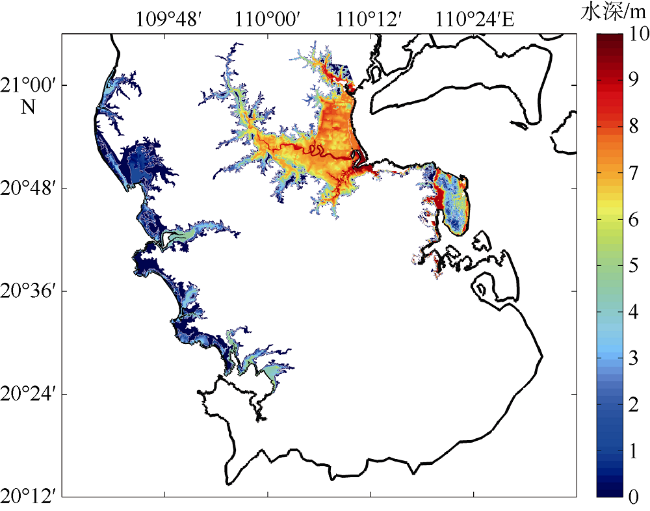
Fig. 1 Grid and bottom topography (units: m) of the study area图1 模型范围内网格及水深分布图 |
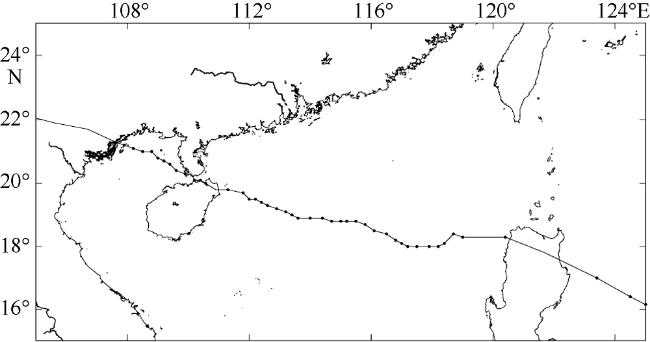
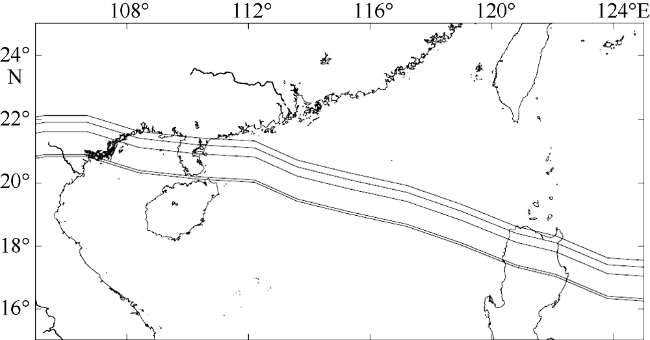
Fig. 2 Path of Typhoon Kalmaegi (No. 1415)图2 1415号台风“海鸥”路径图 |
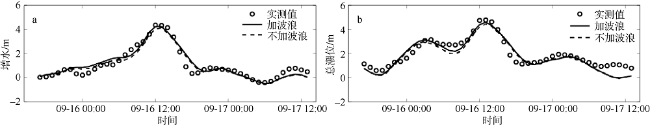
Fig. 3 Storm surge (a) and water level (b) correlation curves of Zhanjiang station during Typhoon Kalmaegi (No. 1415)图3 1415号台风“海鸥”湛江站增水过程(a)及潮位过程(b)对比曲线 |
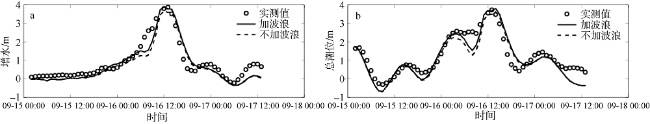
Fig. 4 Storm surge (a) and water level (b) correlation curves of Naozhou station during Typhoon Kalmaegi (No. 1415)图4 1415号台风“海鸥”硇州站增水过程(a)及潮位过程(b)对比曲线 |
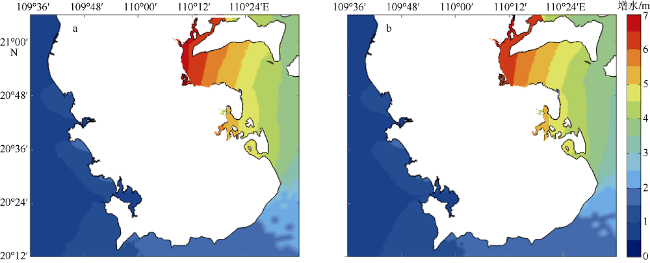
Fig. 5 Distributions of maximum storm surge (units: m) when considering wave effect (a) and without wave effect (b) during Typhoon Kalmaegi (No. 1415)图5 考虑波浪(a)和不考虑波浪(b)作用下“海鸥”过程最大增水分布图 |
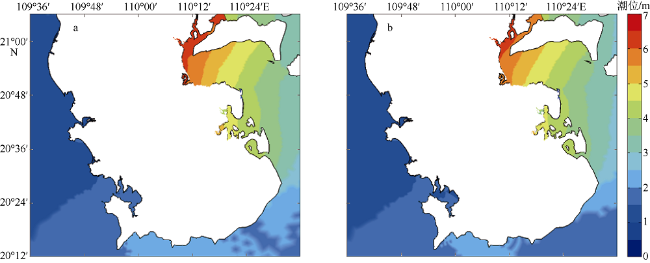
Fig. 6 Distributions of maximum water level (units: m) when considering wave effect (a) and without wave effect (b) during Typhoon Kalmaegi (No. 1415)图6 考虑波浪(a)和不考虑波浪(b)作用下“海鸥”过程最高潮位分布图 |
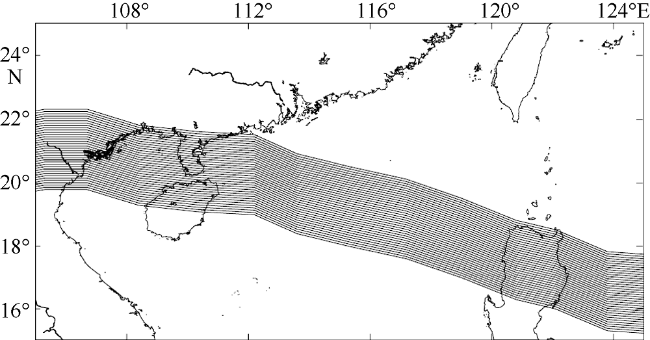
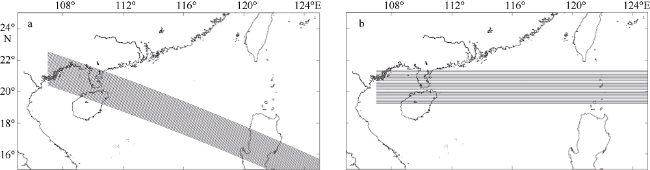
Fig. 7 Paths of No. 8007 typhoon after translation图7 8007号台风平移后路径集 |
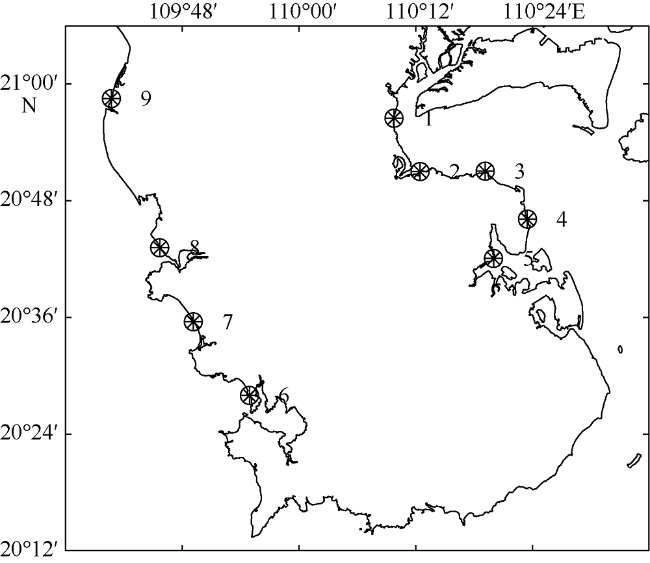
Fig. 8 Location distribution of representative points. Circle represents location and number denotes identifier图8 代表点位置分布 |
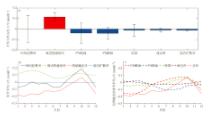
Fig. 9 The top five worst paths of No.8007 typhoon after translation图9 最不利路径中的前5条8007号台风平移后路径 |
Tab. 1 The maximal storm surge (units: m) of every representative point during No. 8007 typhoon cases表1 8007台风事件集下各代表点最大风暴增水(单位: m) |
| 路径 | 1 | 2 | 3 | 4 | 5 | 6 | 7 | 8 | 9 |
|---|---|---|---|---|---|---|---|---|---|
| t0 | 4.291 | 4.142 | 3.648 | 3.413 | 3.707 | 0.453 | 0.465 | 0.445 | 0.407 |
| t1 | 4.383 | 4.219 | 3.718 | 3.469 | 3.785 | 0.447 | 0.462 | 0.454 | 0.397 |
| t2 | 4.469 | 4.300 | 3.790 | 3.541 | 3.853 | 0.450 | 0.464 | 0.451 | 0.399 |
| t3 | 4.557 | 4.391 | 3.872 | 3.604 | 3.933 | 0.451 | 0.460 | 0.447 | 0.393 |
| t4 | 4.654 | 4.472 | 3.945 | 3.677 | 4.010 | 0.445 | 0.458 | 0.440 | 0.390 |
| t5 | 4.745 | 4.567 | 4.020 | 3.745 | 4.114 | 0.439 | 0.452 | 0.442 | 0.378 |
| t6 | 4.852 | 4.657 | 4.111 | 3.835 | 4.218 | 0.442 | 0.445 | 0.435 | 0.374 |
| t7 | 4.967 | 4.777 | 4.206 | 3.937 | 4.361 | 0.435 | 0.442 | 0.434 | 0.394 |
| t8 | 5.103 | 4.896 | 4.318 | 4.056 | 4.508 | 0.436 | 0.441 | 0.423 | 0.442 |
| t9 | 5.251 | 5.044 | 4.434 | 4.189 | 4.675 | 0.439 | 0.448 | 0.432 | 0.452 |
| t10 | 5.424 | 5.192 | 4.563 | 4.325 | 4.849 | 0.442 | 0.450 | 0.431 | 0.451 |
| t11 | 5.593 | 5.352 | 4.682 | 4.456 | 5.028 | 0.456 | 0.453 | 0.449 | 0.492 |
| t12 | 5.768 | 5.504 | 4.806 | 4.577 | 5.180 | 0.465 | 0.475 | 0.440 | 0.465 |
| t13 | 5.922 | 5.632 | 4.911 | 4.663 | 5.294 | 0.495 | 0.480 | 0.467 | 0.499 |
| t14 | 6.033 | 5.723 | 4.980 | 4.697 | 5.324 | 0.509 | 0.487 | 0.485 | 0.507 |
| t15 | 6.064 | 5.706 | 4.953 | 4.587 | 5.028 | 0.699 | 0.512 | 0.473 | 0.493 |
| t16 | 5.966 | 5.565 | 4.832 | 4.346 | 4.649 | 0.829 | 0.505 | 0.489 | 0.501 |
| t17 | 5.718 | 5.266 | 4.567 | 4.075 | 4.436 | 0.892 | 0.623 | 0.489 | 0.519 |
| t18 | 5.433 | 4.942 | 4.240 | 3.818 | 4.117 | 0.916 | 0.727 | 0.480 | 0.484 |
| t19 | 5.151 | 4.649 | 3.979 | 3.560 | 3.750 | 0.929 | 0.791 | 0.481 | 0.527 |
| t20 | 4.763 | 4.265 | 3.681 | 3.297 | 3.400 | 1.018 | 0.866 | 0.477 | 0.503 |
| t21 | 4.346 | 3.850 | 3.377 | 3.038 | 3.065 | 1.099 | 0.948 | 0.478 | 0.545 |
| t22 | 3.918 | 3.436 | 3.078 | 2.773 | 2.736 | 1.174 | 1.049 | 0.516 | 0.571 |
| t23 | 3.587 | 3.121 | 2.809 | 2.508 | 2.399 | 1.205 | 1.184 | 0.631 | 0.534 |
| t24 | 3.332 | 2.867 | 2.550 | 2.233 | 2.045 | 1.221 | 1.225 | 0.731 | 0.538 |
| t25 | 3.062 | 2.607 | 2.294 | 1.944 | 1.742 | 1.233 | 1.230 | 0.821 | 0.554 |
| t26 | 2.777 | 2.342 | 2.083 | 1.743 | 1.643 | 1.169 | 1.186 | 0.931 | 0.575 |
| t27 | 2.469 | 2.062 | 1.859 | 1.570 | 1.507 | 1.088 | 1.107 | 0.983 | 0.572 |
| t28 | 2.167 | 1.778 | 1.642 | 1.408 | 1.347 | 1.027 | 1.012 | 0.955 | 0.601 |
| t29 | 1.958 | 1.584 | 1.415 | 1.221 | 1.161 | 0.957 | 0.932 | 1.015 | 0.663 |
| t30 | 1.694 | 1.341 | 1.186 | 1.040 | 0.908 | 0.886 | 0.864 | 0.982 | 0.717 |
| t31 | 1.387 | 1.060 | 0.981 | 0.900 | 0.722 | 0.826 | 0.803 | 0.900 | 0.747 |
| t32 | 1.227 | 0.899 | 0.814 | 0.793 | 0.627 | 0.751 | 0.725 | 0.811 | 0.863 |
| t33 | 1.107 | 0.791 | 0.709 | 0.696 | 0.569 | 0.690 | 0.651 | 0.727 | 0.819 |
| t34 | 1.017 | 0.713 | 0.652 | 0.628 | 0.507 | 0.622 | 0.580 | 0.642 | 0.746 |
| t35 | 0.950 | 0.659 | 0.609 | 0.568 | 0.476 | 0.572 | 0.530 | 0.554 | 0.758 |
注: 加粗数字表示各代表点在某路径下增水最大 |
Tab. 2 Classification of typhoon intensity表2 台风强度等级划分表 |
| 级别 | Ⅰ | Ⅱ | Ⅲ | Ⅳ | Ⅴ | Ⅵ | Ⅶ |
|---|---|---|---|---|---|---|---|
| 最低气压/hPa | 900 | 910 | 920 | 930 | 940 | 950 | 960 |
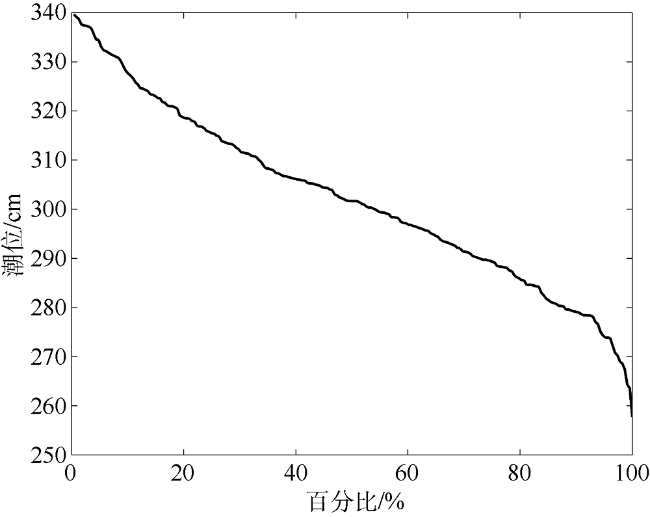
Fig. 10 The frequence curve graph of monthly maximal tide of Zhanjiang station from 1997 to 2015图10 1997—2015年湛江站月最大天文潮位频率曲线图 |
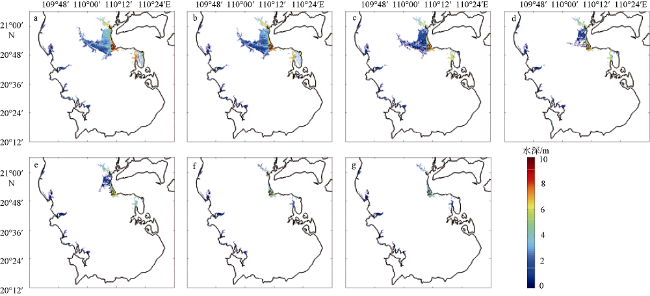
Fig. 11 The inundated range and depth (units: m) in Leizhou during the typoon of each strength grade. (a) 900hPa; (b) 910hPa; (c) 920hPa; (d) 930hPa; (e) 940hPa; (f) 950hPa; (g) 960hPa图11 各台风等级下雷州市淹没范围及淹没水深 |
Tab. 3 The maximum storm surge and water level of Zhanjiang, Naozhou, and Nandu stations during the typoon of each strength grade (under 85 elevation datum)表3 各台风强度等级下湛江站、硇洲站、南渡站最大增水和最高潮位(基面: 85高程) |
| 级别 | 最低气压/hPa | 湛江站 | 南渡站 | 硇洲站 | |||
|---|---|---|---|---|---|---|---|
| 最大增水/m | 最高潮位/m | 最大增水/m | 最高潮位/m | 最大增水/m | 最高潮位/m | ||
| Ⅰ | 900 | 5.993 | 7.694 | 6.898 | 9.691 | 4.892 | 5.222 |
| Ⅱ | 910 | 5.586 | 7.335 | 6.455 | 9.333 | 4.522 | 4.852 |
| Ⅲ | 920 | 5.202 | 7.053 | 6.093 | 8.949 | 4.261 | 4.591 |
| Ⅳ | 930 | 4.759 | 6.737 | 5.637 | 8.348 | 3.969 | 4.299 |
| Ⅴ | 940 | 4.373 | 6.443 | 5.162 | 7.721 | 3.674 | 4.004 |
| Ⅵ | 950 | 3.532 | 5.772 | 4.369 | 6.728 | 3.108 | 3.438 |
| Ⅶ | 960 | 3.066 | 5.368 | 3.798 | 6.049 | 2.653 | 2.983 |
Tab. 4 Area statistics of submerge depth in eastern and western coastal areas of Leizhou during the typoon of each strength grade表4 不同强度台风下雷州市东西两岸淹没水深面积统计 |
| 东岸淹没面积/km2 | 西岸淹没面积/km2 | |||||||||
|---|---|---|---|---|---|---|---|---|---|---|
| 危险性等级 | Ⅰ | Ⅱ | Ⅲ | Ⅳ | 合计 | Ⅰ | Ⅱ | Ⅲ | Ⅳ | 合计 |
| 淹没水深/m | [3,+∞) | [1.2~3.0) | [0.5~1.2) | [0.15~0.5) | [3,+∞) | [1.2~3.0) | [0.5~1.2) | [0.15~0.5) | ||
| 一级, 900hPa | 176.5 | 162.4 | 23.5 | 5.4 | 367.8 | 0.3 | 59.6 | 23.9 | 11.6 | 95.4 |
| 二级, 910 hPa | 131.9 | 161.7 | 38.1 | 6.1 | 337.8 | 0 | 45.8 | 27.2 | 11.1 | 84.1 |
| 三级, 920 hPa | 67.4 | 96.3 | 79.8 | 27.9 | 271.4 | 0 | 44.3 | 22.9 | 10.1 | 77.3 |
| 四级, 930 hPa | 57.3 | 23.7 | 36.0 | 15.1 | 132.1 | 0 | 42.3 | 23.5 | 9.4 | 75.2 |
| 五级, 940 hPa | 50.7 | 17.9 | 32.6 | 12.3 | 113.5 | 0 | 35.4 | 23.2 | 9.7 | 68.3 |
| 六级, 950 hPa | 32.3 | 19.4 | 2.2 | 2.0 | 55.9 | 0 | 14.2 | 32.6 | 11.5 | 58.3 |
| 七级, 960 hPa | 27.7 | 17.7 | 4.0 | 0.2 | 49.6 | 0 | 9.3 | 35.0 | 11.9 | 56.2 |
Tab. 5 The maximal storm surge (units: m) of every representative point during the typhoon in four directions表5 四个方向台风路径下代表点最大风暴增水(单位: m) |
| 角度 | 1 | 2 | 3 | 4 | 5 | 6 | 7 | 8 | 9 |
|---|---|---|---|---|---|---|---|---|---|
| 67°30′ | 8.410 | 7.989 | 6.998 | 6.968 | 8.146 | 3.075 | 2.734 | 1.776 | 0.488 |
| 75°00′ | 9.057 | 8.442 | 7.651 | 6.843 | 7.603 | 2.788 | 2.341 | 1.541 | 0.330 |
| 82°30′ | 9.321 | 8.641 | 7.536 | 6.696 | 6.743 | 2.631 | 2.164 | 1.254 | 0.476 |
| 90°00′ | 9.347 | 9.007 | 7.733 | 6.950 | 6.910 | 2.450 | 1.893 | 0.608 | 0.468 |
注: 加粗数字表示各代表点在某角度路径下增水最大 |
Fig. 12 The constructed paths of possibly maximum tropical cyclone. (a) land at an angle of 67°30′; (b) land at an angle of 90°图12 构造的可能最大热带气旋路径 |
Fig. 13 The inundated range and depth (units: m) in Leizhou during possible maximum typoon图13 雷州市可能最大事件淹没范围及水深包络图 |
Tab. 6 The maximum storm surge and water level of Zhanjiang, Naozhou, and Nandu stations during possible maximum typoon (under 85 elevation datum)表6 可能最大情景下湛江站、硇洲站、南渡站最大增水和最高潮位(基面为85高程) |
| 站位 | 最大增水/m | 最高潮位/m |
|---|---|---|
| 湛江 | 7.806 | 10.081 |
| 硇洲 | 5.534 | 7.184 |
| 南渡 | 8.015 | 10.382 |
Tab. 7 Area statistics of submerge depth in eastern and western coastal areas of Leizhou during possible maximum typoon表7 可能最大台风风暴潮情景下雷州市东西两岸各等级淹没水深面积统计 |
| 东岸 | 西岸 | |||||||||
|---|---|---|---|---|---|---|---|---|---|---|
| 危险性等级 | Ⅰ | Ⅱ | Ⅲ | Ⅳ | 合计 | Ⅰ | Ⅱ | Ⅲ | Ⅳ | 合计 |
| 淹没水深/m | [3,+∞) | [1.2~3.0) | [0.5~1.2) | [0.15~0.5) | [3,+∞) | [1.2~3.0) | [0.5~1.2) | [0.15~0.5) | ||
| 面积/km2 | 408.9 | 41.1 | 6.2 | 0.8 | 457.0 | 56.9 | 44.5 | 31.2 | 12.4 | 145.0 |
The authors have declared that no competing interests exist.
| [1] |
|
| [2] |
|
| [3] |
国家能源局, 2011. NB/T25002-2011 核电厂海工构筑物设计规范[S]. 北京: 中国电力出版社: 1-197 (in Chinese).
|
| [4] |
国家核安全局政策法规处, 1991. HAF0113 核电厂安全导则汇编—核电厂设计基准热带气旋[G]. 北京: 中国法制出版社: 277-295 (in Chinese).
|
| [5] |
|
| [6] |
|
| [7] |
|
| [8] |
|
| [9] |
|
| [10] |
|
| [11] |
|
| [12] |
|
| [13] |
|
| [14] |
中华人民共和国住房和城乡建设部, 中华人民共和国国家质量监督检验检疫总局, 2012. GB/T50663-2011 核电厂工程水文技术规范[S]. 北京: 中国计划出版社: 1-116 (in Chinese).
|
| [15] |
|
| [16] |
|
| [17] |
|
| [18] |
|
| [19] |
|
| [20] |
|
/
| 〈 |
|
〉 |

