Marine Hydrography

Laboratory study on the effect of varying reef-flat width on wave transformation and wave-induced setup

  • YAO Yu , 1, 2 ,
  • HE Tiancheng 2 ,
  • TANG Zhengjiang 2 ,
  • JIANG Changbo 2, 3
Expand
  • 1. Key Laboratory of Coastal Disasters and Defense of Ministry of Education, Hohai University, Nanjing 210098, China
  • 2. School of Hydraulic Engineering, Changsha University of Science & Technology, Changsha 410004, China;
  • 3. Key Laboratory of Water-Sediment Sciences and Water Disaster Prevention of Hunan Province, Changsha 410004, China
Corresponding author: YAO Yu. E-mail:

Received date: 2018-07-29

  Request revised date: 2018-11-05

  Online published: 2019-04-15

Supported by

National Natural Science Foundation of China (51679014)

Hunan Science and Technology Plan Program (2017RS3035)

Open Foundation of Key Laboratory of Coastal Disasters and Defense of Ministry of Education (201602)

Copyright

热带海洋学报编辑部

Abstract

A series of laboratory experiments were carried out in a wave flume to study the influences of different reef-flat widths on wave transformation over reef coasts as well as wave-induced setup on reef flats. A series of incident irregular wave conditions were tested based on the idealized reef model with three reef-flat widths. Results show that as waves propagate across the reef, the swell height decays all the way, whereas the infragravity wave height increases gradually along the reef and reaches the maximum at the shoreline. Near the shoreline, the swell height decreases with increasing reef-flat width, but the variation of infragravity wave height with the reef-flat width is not obvious. The effect of varying reef-flat width on wave-induced setup over the reef flat is insignificant. The first resonant mode is identified on reef flat for the infragravity waves, and the level of resonant amplification near the shoreline is determined by the combined effect of reef-flat water depth, incident peak wave period and reef-flat width.

Cite this article

YAO Yu , HE Tiancheng , TANG Zhengjiang , JIANG Changbo . Laboratory study on the effect of varying reef-flat width on wave transformation and wave-induced setup[J]. Journal of Tropical Oceanography, 2019 , 38(2) : 13 -19 . DOI: 10.11978/2018079

近年来, 我国在南中国海的珊瑚岛礁周围进行了填礁造岛工程, 并修建了诸如灯塔、码头、机场、油气开采平台等设施。此类工程设施常处于远海地区, 海况恶劣, 周围海底地形变化剧烈(姚宇 等, 2017)。如何保障已建成的岛礁建筑物在风暴潮等极端气候下的安全, 降低因洪涝灾害造成的人员和财产损失引起了学者们的广泛关注。典型的珊瑚礁地形主要由礁前斜坡与礁坪组成, 礁前斜坡与礁坪的连接处称为礁缘。在常浪条件下, 波浪作用于礁前斜坡, 通过礁缘处的破碎和礁坪上的摩擦损耗后, 到达礁后岸滩用于波浪爬高的能量几乎可以忽略不计。波浪爬高是珊瑚礁海岸地区洪涝灾害发生的主要因素, 主要由短波(频率区段为0.04~0.4Hz)、低频长波(频率区段为0.001~0.04Hz)和波浪增水共同组成(Merrifield et al, 2014)。其中低频长波成分在某些情况下特别是由风暴潮引起的高潮位时, 易于在半封闭礁坪上发生共振现象引起海岸线附近波浪的放大效应, 加剧波浪海岸爬高即发生洪涝灾害的风险(Péquignet et al, 2009)。
物理模型实验是国内外研究波浪沿礁演变规律的手段之一。例如Gourlay (1996)进行了一系列的模型实验, 较为全面地研究了规则波在概化珊瑚礁物理模型上的传播, 增水和波生流问题。梅弢等(2013)通过实验模拟了常年平均波浪和重现期为50a两种波浪条件, 研究了波浪在珊瑚礁上的传播规律。丁军等(2015)通过港池实验模拟某典型岛礁附近的真实地形, 研究了岛礁地形上波浪的传播变形规律。姚宇等(2017)通过开展波流水槽实验, 研究了潮汐流影响下规则波在珊瑚礁海岸地形上的传播变形和增水规律。上述物理模型实验研究均未考虑礁形变化等因素对波浪在珊瑚礁地形上传播变形的影响。
近年来, 此领域的学者们主要通过数值模拟对礁形变化影响下波浪的传播变形规律进行研究, 例如Shimozono等(2015)以超强台风“海燕”过境为背景, 基于Boussinesq方程对太平洋Eastern Samar岛珊瑚礁海岸的波浪爬高进行了研究, 结果显示低频长波和短波是岸滩爬高的主要成分且二者所占的比重受到礁坪宽度和岸滩坡度的影响。Quataert等(2015)在马绍尔群岛Roi-Namur礁采集现场观测数据, 基于XBeach模型研究了礁前斜坡坡度、礁坪宽度和礁面糙率等礁形变化对海岸洪涝灾害的影响。
目前文献中尚未发现有开展礁坪宽度变化对波浪传播变形影响的物理模型实验工作。本文通过波浪水槽物理模型实验, 研究珊瑚礁礁坪宽度变化对波浪传播变形和礁坪上波浪增水的影响, 并通过波谱分析了海岸线附近低频长波能量的变化规律。研究结果将为评估风暴潮极端波浪条件下珊瑚礁对岛礁工程建设的保护作用提供一定的理论参考。

1 实验设置

图1为物理模型实验设置示意图。实验在长沙理工大学水利实验中心长40m, 宽0.5m, 高0.8m的波浪水槽中进行。水槽左端为一台推板式造波机, 在距造波机27.3m处采用坡度为1 : 6的斜面模拟礁前斜坡, 斜坡后接一定长度的水平平台模拟礁坪, 礁坪距水槽底高度为0.35m, 礁坪后接坡度为1 : 3.3的斜面模拟礁后岸滩。整个礁体物理模型由PVC材料制作, 并通过固定支架悬挂于水槽壁上, PVC板宽度与水槽宽度一致。使用玻璃胶填充模型与水槽壁之间、礁坪相接处及礁前斜坡与水槽底部之间的缝隙。
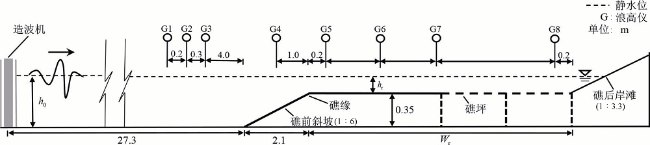
Fig. 1 Experimental setup. h0 donates the offshore water depth; hr donates the reef-flat water depth

图1 实验布置图
图中h0为远海水深; hr为礁坪水深

实验采用8个电容式浪高仪(G1~G8)测量自由液面高程的变化, 布置方式如图1所示。在外海侧设置浪高仪G1、G2和G3用以测量分离入射波和反射波, G4被放置于礁坪斜坡中部测量波浪的浅水变形。G5、G7和G8分别布置于礁缘附近(礁缘向岸侧0.2m)、礁坪中部和海岸线附近(岸滩斜坡坡脚向海侧0.2m), 用来监测从礁缘向海岸线波浪的传播变形过程。G6放置于G5和G7浪高仪的正中间位置。在实验过程中, 所有浪高仪通过数据采集系统同步采集, 采样频率为50Hz, 采样时长为自造波机启动后的1200s。
实验中的物理模型尺寸参照Becker等(2014)对马绍尔群岛进行现场观测的资料, 按照弗如德相似准则确立, 几何比尺为1 : 20。实验测试了4个深水有效波高HS0 (0.04m、0.06m、0.08m、0.10m)、2个礁坪水深hr (0.05m、0.10m)和3个峰周期Tp (1.0s、1.5s、2.0s)组合下的一系列不规则波工况。在上述所有波况下, 分别测试3个礁坪宽度Wr (4.8m、8m、11.2m)对波浪传播变形的影响, 对应的原型礁坪宽度尺寸分别为96m、160m、224m。为了消除初始数据不稳定性的影响, 本文选取实验测量的200~ 1200s时间段的波浪数据进行分析。不规则波的波浪频谱根据浪高仪所测得的自由液面时间序列通过快速傅立叶变化(FFT)的方法分析得到。对于短波波高与低频长波波高的计算, 由于物理实验与现场观测有所区别, 因此本文采用Buckley等(2016)对低频长波和短波频段的划分方法, 将入射波的谱峰频率的二分之一作为低频长波和短波频段划分的界限。短波波高和低频长波波高的具体计算公式如下:
${{H}_{\text{SS}}}=4\sqrt{\int_{{{f}_{\text{p}}}/2}^{\infty }{S(f)}\text{ d}f}\text{,}\ \ \ {{H}_{\text{IG}}}=4\sqrt{\int_{0}^{{{f}_{\text{p}}}/2}{S(f)}\text{ d}f}$
式中: HSS为短波波高(单位: m); HIG为低频长波波高(单位: m); fp是入射波的谱峰频率(单位: Hz); S(f)为波浪谱(单位: m2•s)。

2 结果分析

2.1 礁坪宽度对沿礁波高变化的影响

2.1.1 波高的沿礁变化
图2展示了典型波浪工况HS0=0.08m, Tp=1.5s, hr=0.05m时的短波波高(HSS)和低频长波波高(HIG)在不同礁坪宽度(Wr)情况下的沿礁变化规律。图2表明: 波浪以群波的包络形式由远海向近岸传播时, 远海处(G1~G3)存在少量的低频长波, 这可能是由于在包络线中束缚着一定的低频长波(van Dongeren et al, 2013)。到达礁前斜坡附近(G4)时, 由于浅水作用导致HSS值增大, 随后波浪在礁缘附近(G5)发生破碎, HSS值迅速减小, 而HIG值则增加显著, 这是由于群波效应造成的破碎点的移动产生的(Pomeroy et al, 2012)。波浪到达礁坪中部(G7)时, 破碎过程结束, 继续向海岸线附近(G8)传播时, 由于礁面摩擦导致HSS值沿礁持续减小并在G8时达到最小值, 而HIG值沿礁持续增大并在G8达到最大, 这是由于低频长波在礁坪上存在一阶共振放大效应(详见2.4节)。对于总波高HT, 波浪在破碎前(G1~G4), 其成分主要是HSS; 随着波浪从G5传播到G7, HSS成分逐渐减小, HIG成分逐渐增大; 当波浪传播至G8, 其成分主要为HIG
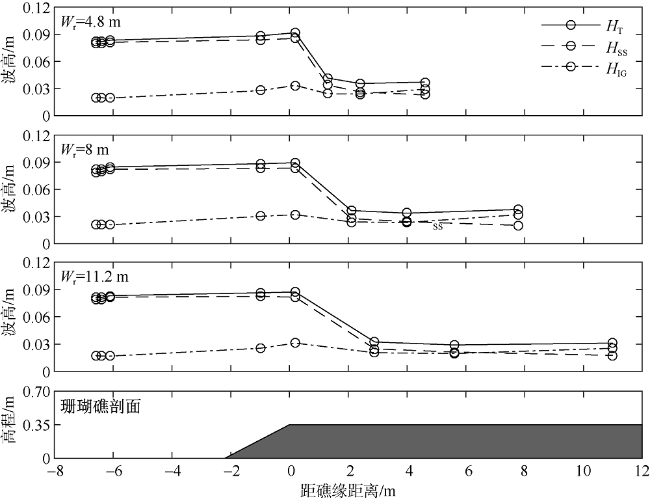
Fig. 2 Swell height (HSS), infragravity wave height (HIG) and total wave height (HT), across the reef profile (wave condition HS0=0.08m, Tp=1.5s, hr=0.05m )

图2 不同礁坪宽度(${{W}_{\text{r}}}$)下短波波高(HSS)、低频长波波高(HIG)和总波高(HT)的沿礁变化(波况: HS0=0.08m, Tp=1.5s, hr=0.05m)

2.1.2 海岸线附近波高的变化
为研究礁坪宽度的变化对海岸线附近(G8)波高变化的影响, 图3展示了HS0=0.08m时G8的短波波高(HSS)和低频长波波高(HIG)随礁坪宽度(Wr)的变化规律。图3a表明: HSS随礁坪水深的减小而减小, 这是由于水深较小时将会增大波浪破碎强度; HSS随入射波峰周期的增大而增大; 同时HSS随着礁坪宽度的增大而减小, 这是由于礁坪宽度的增大导致礁面摩阻损耗增加。图3b表明: HIG随礁坪水深的增大而减小, 这可能是由于水深的增大限制波浪在礁缘附近的破碎强度, 从而减少了上述由于破碎点移动产生的HIG; 同时入射波峰周期越大, G8附近的HIG值越大, 这是由于峰周期的增大减小了频谱的带宽, 增加了包络线中低频长波的能量(Yao et al, 2016); HIG随着礁坪宽度的增长变化规律不明确, 这与礁坪宽度的变化改变了珊瑚礁地形固有共振频率, 因此在不同的波浪条件下会产生不同强度的共振响应有关。
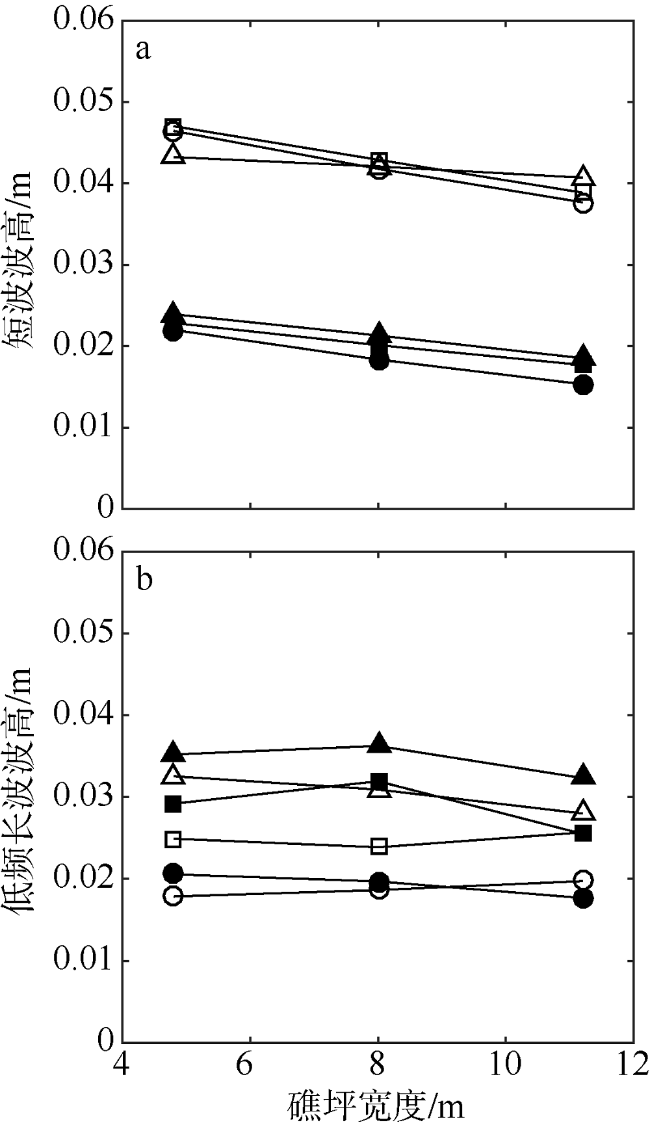
Fig. 3 Variations of swell height (HSS) and infragravity wave height (HIG) with reef-flat width (Wr) near the coastline at G8 (HS0=0.08m). Circles denote Tp=1.5s; Squares denote Tp=1.5s; Triangles denote Tp=2.0s; Solid markers denote hr=0.05m; Open markers denote hr=0.1m

图3 海岸线附近(G8)短波波高(HSS)和低频长波波高(HIG)随礁坪宽度(Wr)的变化(HS0=0.08m)
图中圆形表示Tp=1.0s; 方形表示Tp=1.5s; 三角形表示Tp=2.0s; 实心表示hr=0.05m; 空心表示hr=0.1m

2.2 礁坪波浪增水的变化规律

图4a展示了礁坪宽度Wr=8m时, 岸线附近的波浪增水(${{\bar{\eta }}_{\text{ r}}}$)随入射波高(HS0)的变化规律; 图4b展示了入射波高HS0=0.08m时, ${{\bar{\eta }}_{\text{ r}}}$在不同礁坪宽度(Wr)情况下的变化规律。由于波浪水槽的封闭性, 由质量守恒可知珊瑚礁坪上产生的增水会造成远海侧的减水, 因此, 本文使用海岸线附近处(G8)浪高仪所测得的平均水位减去远海位置(G1)浪高仪所测得的相对平均水位作为珊瑚礁坪上的波浪增水参考值。分析图4a可知: 礁坪上的波浪增水随入射波高的增大而呈线性增长趋势; 对比不同水深发现, 礁坪水深较小时, 会产生更大的波浪增水; 同时其也随入射峰周期的增大而增大, 上述结论均与Gourlay (1996)的报道相符合。分析图4b可知: 同一入射波条件下, 礁坪宽度变化对G8附近的波浪增水无明显影响, 这是因为实验观察发现, 同一入射波在测试的3个礁坪宽度上均已完成了整个破碎过程, 因此由相同波浪破碎产生的辐射应力梯度(由礁坪水深决定)所造成的增水应趋于一致。
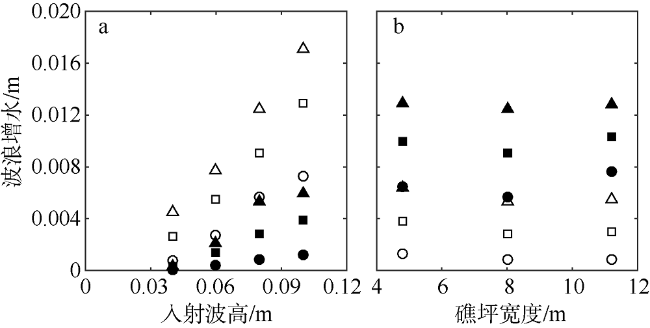
Fig. 4 Variation of wave-induced setup (${{\bar{\eta }}_{\text{ r}}}$) on the reef-flat width with (a) incident significant wave height (HS0) and (b) reef-flat width (Wr). Circles donate Tp=1.0s; Squares donate Tp=1.5s; Triangles donate Tp=2.0s; Black markers donate hr=0.05m; White markers donate hr=0.1m

图4 礁坪波浪增水(${{\bar{\eta }}_{\text{ r}}}$)随入射有效波高(a)和礁坪宽度(b)的变化
图中圆形表示Tp=1.0s; 方形表示Tp=1.5s; 三角形表示Tp=2.0s; 实心表示hr=0.05m; 空心表示hr=0.1m

2.3 波浪频谱分析

为了揭示波浪能量的沿礁变化, 图5展示了典型入射波况HS0=0.08m, Tp=1.5s, hr=0.05m时, 3种礁坪宽度(Wr)影响下4个代表性测点G1 (远海处)、G5 (礁缘附近)、G7 (礁坪中部)和G8 (海岸线附近)的波浪频谱图。观察图5波浪频谱图, 可以发现: G1附近存在少量的低频长波能量(f = 0~ 0.33Hz), 这是波群向岸传播时, 存在少量束缚在包络线中的低频长波(van Dongeren et al, 2013)。在G5附近, 波浪发生破碎, 短波区间(f > 0.33Hz)能量衰减剧烈, 同时与图2对应, G5处低频长波区间能量有较大的增长, 这同样是由于群波效应引起的破碎点移动产生的低频长波(Pomeroy et al, 2012)。波浪在礁坪上继续向岸传播时, 短波能量由于礁坪摩擦继续减少, 低频长波能量由于共振放大效应沿礁增大。波浪传播到达G8时, 短波能量已大幅削弱, 而低频长波能量则达到最大值。
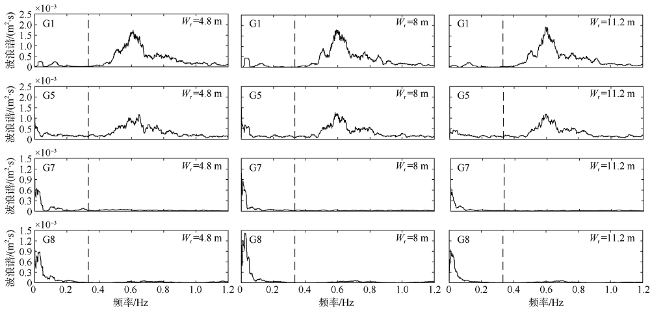
Fig. 5 Variation of wave spectra with different reef-flat widths (Wr) across the reef profile (HS0=0.08m, Tp=1.5s, hr=0.05m). The dashed line denotes the splitting frequency between the swell wave and the infragravity wave frequency bands

图5 不同礁坪宽度(Wr)条件下波浪谱的沿礁变化(HS0=0.08m, Tp=1.5s, hr=0.05m)
虚线表示低频长波和短波划分的界限${{f}_{\text{c}}}$

对比3种不同礁坪宽度情况, 发现海岸线G8附近波浪在短波频段的能量随着礁坪宽度的增大而减小; 而在礁坪宽度Wr=8m时低频长波频段的能量明显高于Wr为4.8m和11.2m时的能量, 具体原因分析见2.4节。

2.4 有关礁坪共振的讨论

礁缘到海岸线附近低频长波能量的放大可以利用礁坪共振理论进行分析。珊瑚岛礁地形近似于半开放盆地港湾, 理论上礁坪共振周期可参照开放盆地的共振模式(Nwogu et al, 2010)进行分析, 其形式如下:
${{T}_{n}}=\text{ }\frac{4{{W}_{\text{r}}}}{(2n-1)\sqrt{g({{h}_{\text{r}}}+{{{\bar{\eta }}}_{\text{r}}})}},\text{ }n\text{ }=\text{ }1,\text{ }2,\text{ }3\cdot \cdot \cdot $
式中: Tn为第n阶共振周期(单位: s); n为共振阶数; g为重力加速度; hr为礁坪水深(单位: m); ${{\bar{\eta }}_{\text{ r}}}$为礁坪上波浪增水(单位: m)。
为了进一步研究礁坪水深(hr)、波浪峰周期(Tp)和礁坪宽度(Wr)对海岸线附近波浪低频长波频段频谱以及可能存在的共振的影响, 图6展示了2种礁坪水深、3种波浪峰周期和3种礁坪宽度情况下G8位置(海岸线附近)低频长波频段的波浪频谱图。
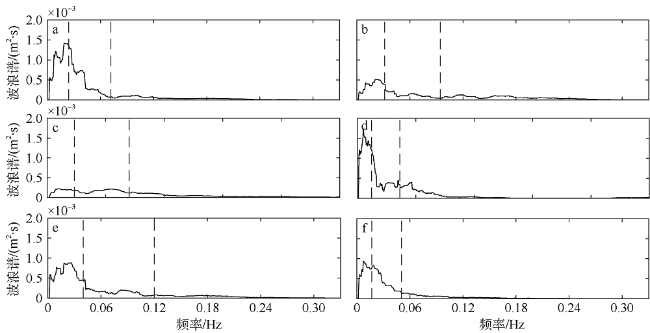
Fig. 6 Wave spectra within the infragravity band ($f$= 0 - 0.33 Hz) near the coastline (G8) under different water depths (hr), periods (Tp) and reef-flat widths (Wr). (a) HS0=0.08m, Tp=1.5s, hr=0.05m, Wr=8m; (b) HS0=0.08m, Tp=1.5s, hr=0.1m, Wr=8m; (c) HS0=0.08m, Tp=1.0s, hr=0.05m, Wr=8m; (d) HS0=0.08m, Tp=2.0s, hr=0.05m, Wr=8m; (e) HS0=0.08m, Tp=1.5s, hr=0.05m, Wr=4.8m; (f) HS0=0.08m, Tp=1.5s, hr=0.05m, Wr=11.2m. In each plot, the left vertical dashed line denotes the first-order resonant frequency, and the right vertical dashed line denotes the second-order resonant frequency

图6 海岸线附近(G8)低频波浪频谱(f = 0~0.33Hz)随礁坪水深(hr), 波浪周期(Tp)和礁坪宽度(Wr)的变化
a. HS0=0.08m, Tp=1.5s, hr=0.05m, Wr=8m; b. HS0=0.08m, Tp=1.5s, hr=0.1m, Wr=8m; c. HS0=0.08m, Tp=1.0s, hr=0.05m, Wr=8m; d. HS0=0.08m, Tp=2.0s, hr=0.05m, Wr=8m; e. HS0=0.08m, Tp=1.5s, hr=0.05m, Wr=4.8m; f. HS0=0.08m, Tp=1.5s, hr=0.05m, Wr=11.2m。各子图中左虚线为一阶共振频率, 右边虚线为二阶共振频率

观察图6可发现波浪频谱中的峰值频率基本集中在一阶礁坪共振频率附近, 可见珊瑚礁礁坪上低频长波的运动存在着一阶共振模式。对比图6a和6b可知: hr=0.05m时较hr=0.1m到达海岸线的低频长波具有更大的能量, 这与Quataert等(2015)现场观测发现的礁坪水深越大, 海岸低频长波能量越大的结论并不一致, 这是因为此工况(HS0=0.08m, Tp=1.5s, Wr=8m)在hr=0.05m时更接近于一阶理论共振频率从而在海岸线激发了更大的低频长波共振放大效应。
对比图6a、6c和6d可知: G8附近低频长波的能量随着波浪峰周期的增大而增大, 这是由于峰周期的增大减小了频谱的带宽, 增加了包络线中低频长波的能量所造成(Yao et al, 2016)。对比图6a、6e和6f可知: Wr=8m时低频长波能量明显大于Wr为11.2m和4.8m时的能量值, 且可以发现Wr=8m时低频长波频段的峰值频率最接近一阶礁坪理论共振频率, 表明在入射波条件相同时, Wr=8m相较于Wr为4.8m和11.2m, 更有利于激发珊瑚礁坪的一阶共振模式。这与图3b中对应工况(HS0=0.08m, Tp=1.5s, hr=0.05m)在不同礁坪宽度情况下, 低频长波波高出现的先增大后减小规律相对应。通过上述分析, 可知共振放大效应强度由礁坪水深、入射波峰周期和礁坪宽度共同决定。

3 结论

本文通过物理模型实验研究礁坪宽度变化影响下珊瑚礁海岸附近波浪传播变形。主要结论如下: 1) 不规则波通过礁坪向岸传播过程中, 短波波高由于波浪破碎以及礁面摩阻损耗逐渐衰减, 低频长波则由波浪破碎点的移动产生并在礁坪上发生共振效应逐渐增大; 2) 礁坪宽度的增大能显著降低波浪在岸线附近的短波波高, 而低频长波随礁坪宽度变化的规律不显著; 3) 礁坪宽度变化时礁坪波浪增水值趋于一致; 4) 波谱分析进一步表明, 珊瑚礁坪上低频长波的运动存在着一阶共振模式, 且共振放大效应强度受礁坪水深、入射波峰周期和礁坪宽度共同影响。

The authors have declared that no competing interests exist.

[1]
丁军, 田超, 王志东, 等, 2015. 近岛礁波浪传播变形模型试验研究[J]. 水动力学研究与进展, 30(2): 194-200.该文以某典型岛礁地形为研究对象,通过水池模型试验方法对岛礁附近波浪沿程变化、横剖面波高变化和礁坪上波浪变化等近岛礁波浪传播变形特征进行了分析。研究结果表明,波浪从远海传播至岛礁附近,经过礁坪前地形剧烈变化地带时波高增大后迅速减小,并在礁坪边缘与浅水礁坪的衔接段形成破碎带,最后进入浅水礁坪后波高基本由水深控制。

DOI

DING JUN, TIAN CHAO, WANG ZHIDONG, et al, 2015. Experimental research on wave deformation near the typical island[J]. Chinese Journal of Hydrodynamics, 30(2): 194-200 (in Chinese with English abstract).

[2]
梅弢, 高峰, 2013. 波浪在珊瑚礁坪上传播的水槽试验研究[J]. 水道港口, 34(1): 13-18.

MEI TAO, GAO FENG, 2013. Flume experiment research on law of wave propagation in reef flat[J]. Journal of Waterway and Harbor, 34(1): 13-18 (in Chinese with English abstract).

[3]
姚宇, 唐政江, 杜睿超, 等, 2017. 潮汐流影响下珊瑚岛礁附近波浪传播变形和增水试验[J]. 水科学进展, 28(4): 614-621.为揭示潮汐流影响下珊瑚岛礁附近波浪的运动特征,通过波流水槽试验对潮汐流存在下规则波的传播变形和增水规律进行了研究,测试了一系列的潮汐流流量并对比正向流、反向流以及无流的情况。研究结果表明:反向流使波浪破碎点向远海侧移动,正向流则使其向海岸侧移动,反向流存在时破碎带内的湍流较正向流时更为剧烈;反向流时破碎点附近入射波能量由主频波向高次谐波发生转移更为显著;潮汐流的存在对波浪反射、透射和能量耗散并无明显影响;正向流造成礁坪上波浪增水减少,反向流则促进增水的增长,增水最大值与潮汐流流量间存在显著的线性关系。研究成果可望为岛礁工程的建设和维护提供一定的理论参考。

DOI

YAO YU, TANG ZHENGJIANG, DU RUICHAO, et al, 2017. Laboratory study of wave transformation and wave-induced setup over reef islands under the effect of tidal current[J]. Advances in Water Science, 28(4): 614-621 (in Chinese with English abstract).

[4]
BECKER J M, MERRIFIELD M A, FORD M, 2014. Water level effects on breaking wave setup for Pacific Island fringing reefs[J]. Journal of Geophysical Research: Oceans, 119(2): 914-932.The effects of water level variations on breaking wave setup over fringing reefs are assessed using field measurements obtained at three study sites in the Republic of the Marshall Islands and the Mariana Islands in the western tropical Pacific Ocean. At each site, reef flat setup varies over the tidal range with weaker setup at high tide and stronger setup at low tide for a given incident wave height. The observed water level dependence is interpreted in the context of radiation stress gradients specified by an idealized point break model generalized for nonnormally incident waves. The tidally varying setup is due in part to depth-limited wave heights on the reef flat, as anticipated from previous reef studies, but also to tidally dependent breaking on the reef face. The tidal dependence of the breaking is interpreted in the context of the point break model in terms of a tidally varying wave height to water depth ratio at breaking. Implications for predictions of wave-driven setup at reef-fringed island shorelines are discussed.

DOI

[5]
BUCKLEY M L, LOWE R J, HANSEN J E, et al, 2016. Wave setup over a fringing reef with large bottom roughness[J]. Journal of Physical Oceanography, 46(8): 2317-2333.react-text: 314 The effects of rows of spherical roughness elements upon transition of the boundary layer are described. It is shown that a row of spherical roughness elements is effective for tripping transition, although the roughness Reynolds number is not much lower than that of a wire trip. There is evidence of a strong distortion of the downstream turbulent boundary layer. This is seen in the values of... /react-text react-text: 315 /react-text [Show full abstract]

DOI

[6]
GOURLAY M R, 1996. Wave set-up on coral reefs. 1. Set-up and wave-generated flow on an idealised two dimensional horizontal reef[J]. Coastal Engineering, 27(3-4): 161-193.All other factors being the same, wave set-up is greatest at low tide levels whereas wave-generated flow is greater at higher tide levels. The magnitude of the set-up on a platform reef with a wave-generated flow is less than on a fringing reef without any net flow by an amount equal to the velocity head of the flow across the reef. Dimensionless parameters \00ghrT√ ηo and q√gHo3 are found to be functions of relative submergence parameters hrHo or (ηr + hr)Ho. For values of (\00ghr + hr) H o > 1 waves break on the reef-top and radiation stress theory can be used to calculate set-up. For (\00ghr + hr) H o < 0.7 waves break on the reef-face and set-up is determined by broadcrested weir control at the reef-edge. (The symbols are defined as follows: g is gravitational acceleration; h r is still water depth over horizontal reef-top; H o is offreef wave height (equivalent deep water value); q is discharge per unit length of reef edge; T is wave period and \00ghr is maximum wave set-up on reef-top.)

DOI

[7]
MERRIFIELD M A, BECKER J M, FORD M, et al, 2014. Observations and estimates of wave-driven water level extremes at the Marshall Islands[J]. Geophysical Research Letters, 41(20): 7245-7253.Abstract Wave-driven extreme water levels are examined for coastlines protected by fringing reefs using field observations obtained in the Republic of the Marshall Islands. The 2% exceedence water level near the shoreline due to waves is estimated empirically for the study sites from breaking wave height at the outer reef and by combining separate contributions from setup, sea and swell, and infragravity waves, which are estimated based on breaking wave height and water level over the reef flat. Although each component exhibits a tidal dependence, they sum to yield a 2% exceedence level that does not. A hindcast based on the breaking wave height parameterization is used to assess factors leading to flooding at Roi-Namur caused by an energetic swell event during December 2008. Extreme water levels similar to December 2008 are projected to increase significantly with rising sea level as more wave and tide events combine to exceed inundation threshold levels.

DOI

[8]
NWOGU O, DEMIRBILEK Z, 2010. Infragravity wave motions and runup over shallow fringing reefs[J]. Journal of Waterway, Port, Coast, and Ocean Engineering, 136(6): 295-305.

DOI

[9]
PÉQUIGNET A C N, BECKER J M, MERRIFIELD M A, et al, 2009. Forcing of resonant modes on a fringing reef during tropical storm Man-Yi[J]. Geophysical Research Letters, 36(3): L03607.Open basin resonant modes have been observed at tidal frequencies on coastal shelves, but their excitation on coral reef platforms has only been suggested. The topography of and water depth over most fringing reefs correspond to resonant periods that are the order of tens of minutes and fall outside of the energetic part of the wave spectrum. During tropical storm Man-Yi, low frequency near resonant oscillations dominated the variance of the sea surface elevation at the shoreline of Ipan reef, Guam. The excitation of the resonant modes resulted both from a large increase in water level over the reef due to wave setup, which increased the resonant frequencies, and the occurrence of wave group forcing with time scales commensurate with these increased resonant frequencies. Citation: Pequignet, A. C. N., J. M. Becker, M. A. Merrifield, and J. Aucan (2009), Forcing of resonant modes on a fringing reef during tropical storm Man-Yi, Geophys. Res. Lett., 36, L03607, doi: 10.1029/2008GL036259.

DOI

[10]
POMEROY A, LOWE R, SYMONDS G, et al, 2012. The dynamics of infragravity wave transformation over a fringing reef[J]. Journal of Geophysical Research: Oceans, 117(C11): C11022.1] A 3 week field study was conducted to investigate the dynamics of low-frequency (infragravity) wave motions over a fringing reef at Ningaloo Reef, Western Australia. Short-period wave motions (0.040900090.2 Hz) were observed to dissipate on the reef crest beyond which infragravity wave motions (0.0040900090.04 Hz) gradually dominated toward the lagoon. However, both the short waves and the infragravity waves were relatively small (both <0.3 m) on the reef flat owing to the shallow water depth (<2 m). The results revealed that the surf zone generation of free infragravity wave motions on the steep (0908041:20) fore-reef slope was dominated by breakpoint forcing (as opposed to shoaling bound waves), which was also supported by detailed numerical simulations of the generation process. This is consistent with theory suggesting the efficiency of the breakpoint forcing mechanism should be high in this steep-slope regime. Shoreward propagating infragravity waves traveled across the reef but were damped by bottom friction dissipation; however, this was at a rate much smaller than experienced by the residual short waves. With these rates of frictional dissipation also strongly dependent on the water depth over the reef, the infragravity wave heights increased at higher water levels and hence were strongly modulated by the tide. Due to the strong dissipation of infragravity waves over this wide and shallow reef that is hydraulically rough, any seaward propagating infragravity waves that reflected at the shoreline were small, leading to the dominance of progressive (shoreward propagating) infragravity wave motions throughout the reef and lagoon.

DOI

[11]
QUATAERT E, STORLAZZI C, VAN ROOIJEN A, et al, 2015. The influence of coral reefs and climate change on wave driven flooding of tropical coastlines[J]. Geophysical Research Letters, 42(15): 6407-6415.Abstract A numerical model, XBeach, calibrated and validated on field data collected at Roi-Namur Island on Kwajalein Atoll in the Republic of Marshall Islands, was used to examine the effects of different coral reef characteristics on potential coastal hazards caused by wave-driven flooding and how these effects may be altered by projected climate change. The results presented herein suggest that coasts fronted by relatively narrow reefs with steep fore reef slopes (~1:10 and steeper) and deeper, smoother reef flats are expected to experience the highest wave runup. Wave runup increases for higher water levels (sea level rise), higher waves, and lower bed roughness (coral degradation), which are all expected effects of climate change. Rising sea levels and climate change will therefore have a significant negative impact on the ability of coral reefs to mitigate the effects of coastal hazards in the future.

DOI

[12]
SHIMOZONO T, TAJIMA Y, KENNEDY A B, et al, 2015. Combined infragravity wave and sea-swell runup over fringing reefs by super typhoon Haiyan[J]. Journal of Geophysical Research: Oceans, 120(6): 4463-4486.Abstract Super typhoon Haiyan struck the Philippines on 8 November 2013, marking one of the strongest typhoons at landfall in recorded history. Extreme storm waves attacked the Pacific coast of Eastern Samar where the violent typhoon first made landfall. Our field survey confirmed that storm overwash heights of 6 14 m above mean sea level were distributed along the southeastern coast and extensive inundation occurred in some coastal villages in spite of natural protection by wide fringing reefs. A wave model based on Boussinesq-type equations is constructed to simulate wave transformation over shallow fringing reefs and validated against existing laboratory data. Wave propagation and runup on the Eastern Samar coast are then reproduced using offshore boundary conditions based on a wave hindcast. The model results suggest that extreme waves on the shore are characterized as a superposition of the infragravity wave and sea-swell components. The balance of the two components is strongly affected by the reef width and beach slope through wave breaking, frictional dissipation, reef-flat resonances, and resonant runup amplification. Therefore, flood characteristics significantly differ from site to site due to a large variation of the two topographic parameters on the hilly coast. Strong coupling of infragravity waves and sea swells produces extreme runup on steep beaches fronted by narrow reefs, whereas the infragravity waves become dominant over wide reefs and they evolve into bores on steep beaches.

DOI

[13]
VAN DONGEREN A, LOWE R, POMEROY A, et al, 2013. Numerical modeling of low-frequency wave dynamics over a fringing coral reef[J]. Coastal Engineering, 73: 178-190.78 Infragravity wave energy dominates swell wave energy over the reef and accounts for 50% of shear stresses locally. 78 Model results both in 1D and 2D compare well to data for the duration of a swell event. 78 In the two-dimensional model, a lower friction coefficient was required due to the presence of significant mean flows. 78 IG waves are predominantly generated by the breakpoint mechanism and dissipated by friction. 78The infragravity waves were modulated by tidal depth variations, primarily due to the variability in frictional dissipation.

DOI

[14]
YAO YU, BECKER J M, FORD M R, et al, 2016. Modeling wave processes over fringing reefs with an excavation pit[J]. Coastal Engineering, 109: 9-19.Highlights 61 A Boussinesq model is used to study the impact of a reef-flat excavation pit on wave transformation across a fringing reef. 61 The numerical model reproduces wave transformation in both the sea and swell (SS) and infragravity (IG) frequency bands. 61 The model suggests that an excavation pit increases/reduces SS/IG shoreline wave heights compared to an unmodified reef. 61 The reduction in IG wave heights is found to be associated with modifications of the 04 and 06 wavelength IG standing modes. 61 The effects of the pit position, width, and the incident wave conditions on wave transformation are assessed by the model. Abstract The excavation of reef-flat sand and aggregate for engineering projects is a common practice on atoll islands, with attendant coastal management and hazard mitigation issues. To assess the impact of reef-flat excavation pits on wave transformation, a numerical study is carried out based on one-dimensional weakly dispersive, highly nonlinear Boussinesq equations. Model simulations are compared to field observations made at Majuro Atoll, Republic of the Marshall Islands (Ford et al., 2013a), at a 75-m-wide fringing reef flat with a 17-m-wide, 4-m-deep excavation pit and at an adjacent unmodified reef flat. With a calibrated empirical breaking model and uniform friction coefficient, the numerical model is shown to satisfactorily reproduce the observed sea and swell (SS) and infragravity (IG) frequency band wave heights for a moderate amplitude wave event. By removing the lateral morphological differences of the field experiment, the model shows that an excavation pit reduces/increases shoreline IG/SS wave heights compared to numerical tests without the pit, in qualitative agreement with Ford et al. (2013a). An EOF analysis demonstrates that the reduction in IG wave heights is associated with modifications of the 04 and 06 wavelength IG standing modes across the reef caused by the pit. Model tests are used to evaluate the effects of cross-reef pit location and width on wave transformation. Shoreline wave heights are least affected by a pit located near the reef crest, and both SS and IG wave heights increase as the pit location moves shoreward. Shoreline wave heights are an increasing function of pit width as the increase in SS wave height exceeds the decrease in IG wave height produced by the pit. The effects of incident wave height and spectral bandwidth are also examined for the reef with and without pit. It is found that both shoreline SS and IG wave heights increase with the increasing incident wave height for both profiles. The numerical model results also demonstrate that the shoreline response is sensitive to the bandwidth of the incident wave spectrum, and larger IG shoreline wave heights are excited for narrower spectral bandwidths until wave reflection limits the forcing.

DOI

Outlines

/