
Journal of Tropical Oceanography >
Impact of simulated warming and nutrients input on plankton community metabolism in Daya Bay*
Received date: 2018-07-25
Request revised date: 2018-09-10
Online published: 2019-04-15
Supported by
National Key Research and Development Program of China (2017YFC0506302)
National Basic Research Program (2015CB452904)
National Natural Science Foundation of China (41276161)
Copyright
Characters of plankton community metabolism of Daya Bay were studied using data collected in August 2016 and January 2017. The possible effects of nutrients input were discussed to understand the response mechanism of plankton to warming and eutrophication based on simulation experiments. The results indicated that both GPP (gross primary production) and CR (community respiration) were influenced by warming and nutrients input, and response of GPP to environment was seriously sensitive. The impact of GPP on nutrients input was more remarkably than that of temperature, except for being significantly inhibited in early cultured stage (24 h) with extremely high temperature conditions. In winter, both GPP and CR were significantly affected by the warming effect (p<0.05). Overall, both warming effect and nutrients input could affect carbon metabolism of plankton community which would lead to the declining of marine ecosystem stability, thereby affecting marine ecosystem stability and biodiversity and quality of marine ecological environment and fishery resource output.
Key words: plankton; community metabolism; nutrients input; Daya Bay
XIE Fuwu , SONG Xingyu , TAN Yehui , TAN Meiting , HUANG Yadong , LIU Huaxue . Impact of simulated warming and nutrients input on plankton community metabolism in Daya Bay*[J]. Journal of Tropical Oceanography, 2019 , 38(2) : 48 -57 . DOI: 10.11978/2018075
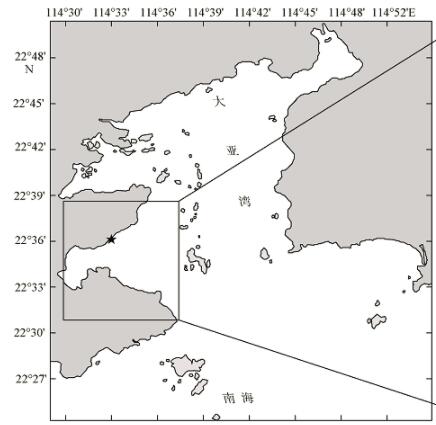
Fig. 1 Maps of sampling stations in Daya Bay图1 现场温度调查和模拟实验采样站位分布图 |
Tab. 1 Simulation experimental design in Daya Bay during summer and winter表1 大亚湾模拟实验设计 |
| 单因素模拟实验条件(M1) | 交互模拟实验(M2) | |
|---|---|---|
| 夏季 | 6个温度梯度(38℃、36℃、34℃、32℃、30℃、28℃) | 3个营养盐加富梯度*和3个温度梯度(36℃、32℃、28℃) |
| 冬季 | 6个温度梯度(28℃、26℃、24℃、22℃、20℃、18℃) | 3个营养盐加富梯度*和3个温度梯度(28℃、24℃、20℃) |
注: *营养盐加富梯度[低浓度组(LN): 不添加营养盐; 中浓度组(MN): 添加终浓度为10μmol·L-1的硝酸盐及0.6μmol·L-1的磷酸盐; 高浓度组(HN): 添加终浓度为100μmol·L-1的硝酸盐及6μmol·L-1的磷酸盐] |
Tab. 2 The environmental parameters of surface water in Daya Bay表2 夏冬两季大亚湾表层站位环境参数 |
| 季节 | 站位 | 温度/℃ | 盐度/‰ | pH | Chl-a/(μg·L-1) | DIP/(μmol·L-1) | DIN/(μmol·L-1) | DIN/DIP |
|---|---|---|---|---|---|---|---|---|
| 夏季 | M1 | 28.3 | 30.7 | 8.1 | 5.37 | 0.44 | 35.46 | 80.59 |
| M2 | 29.9 | 33.6 | 8.3 | 1.58 | 0.05 | 7.82 | 156.40 | |
| 冬季 | M1 | 18.4 | 29.1 | 8.0 | 0.63 | 0.51 | 12.50 | 24.51 |
| M2 | 17.9 | 29.9 | 8.0 | 1.43 | 0.30 | 10.62 | 35.40 |
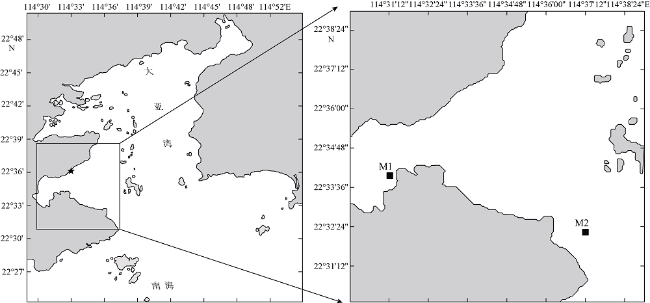
Fig. 2 Features of plankton community metabolism in simulated experiments图2 模拟升温实验浮游生物群落代谢特征 |
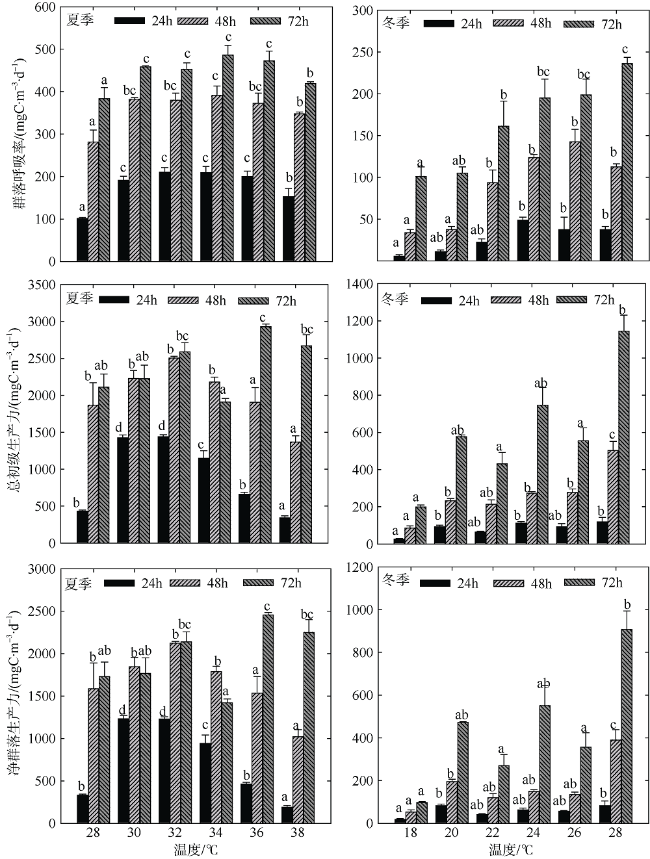
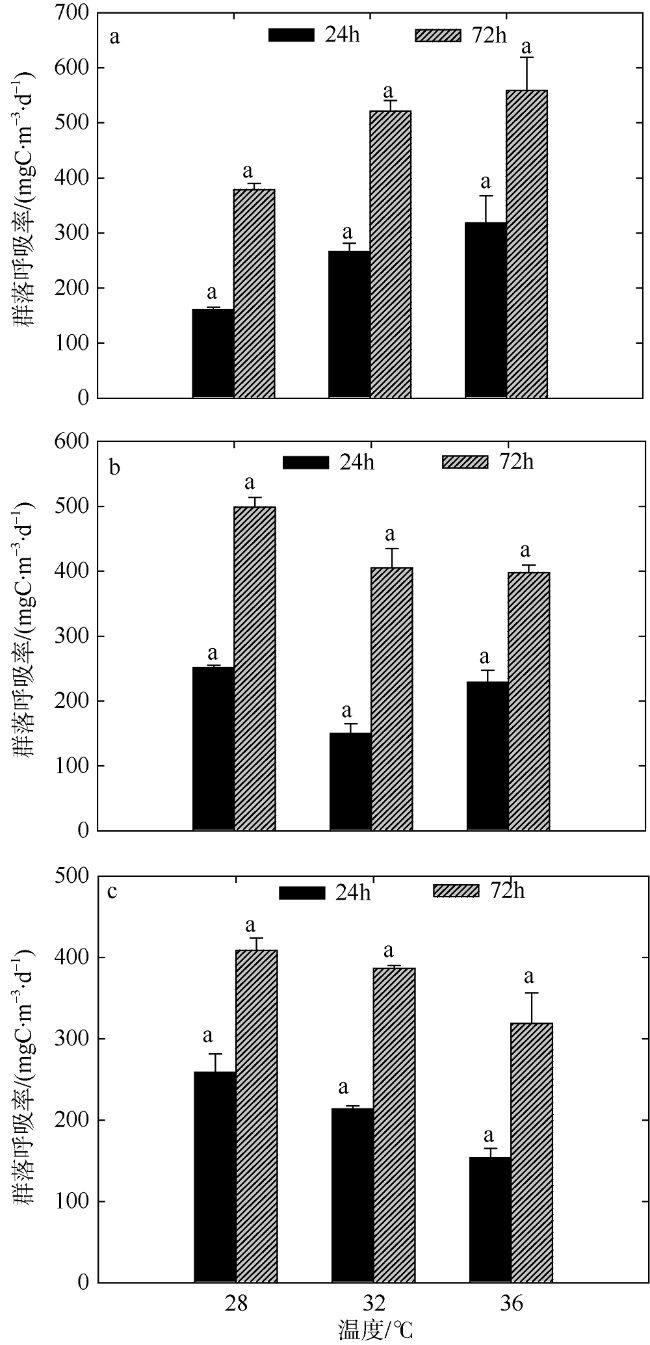
Fig. 3 Variation of plankton CR of two-factors simulated experiments in summer. Significant differences among the temperature groups are indicated by using different superscripts (p<0.05), while no significant difference is shown using the same superscript. LN: low nutrients, MN: medium nutrients, HN: high nutrients. Significant differences among the nutrients groups are marked by “*”, while no significant difference is shown without “*”图3 夏季双因素模拟实验浮游生物群落呼吸率的变化 |
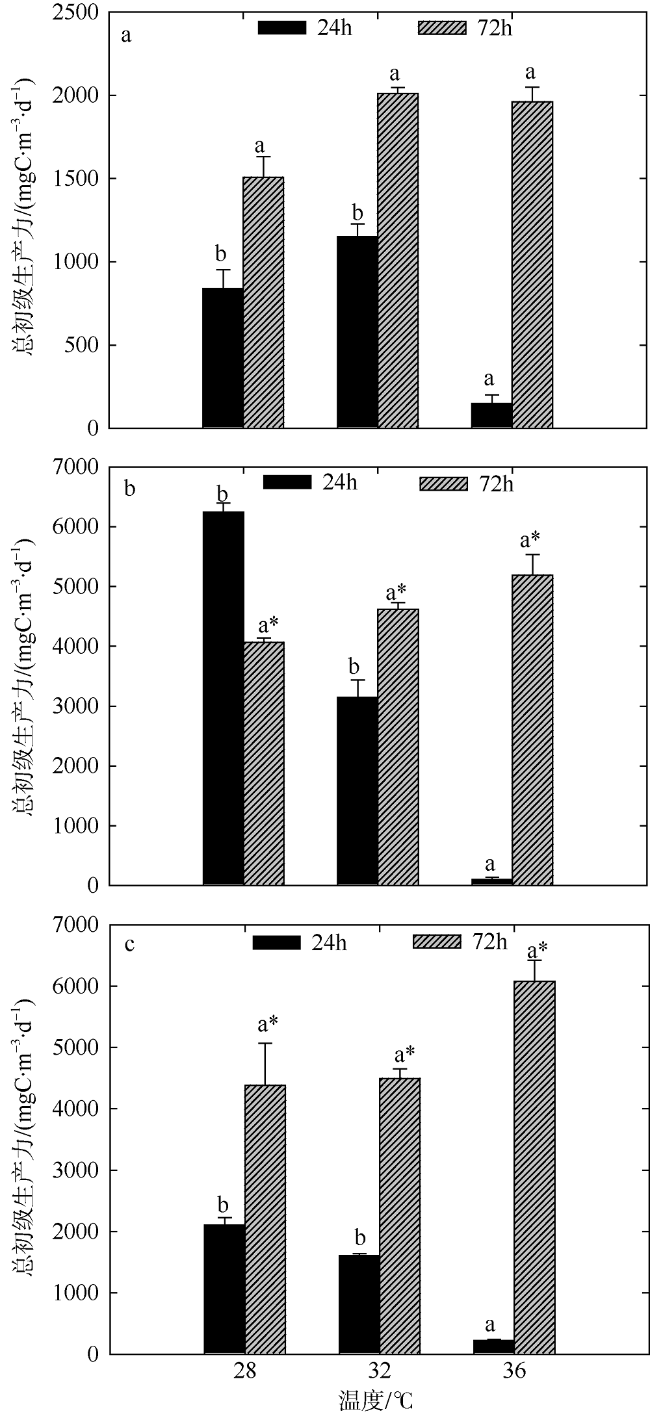
Fig. 4 Variation of plankton GPP of two-factors simulated experiments in summer. Significant differences among the temperature groups are indicated by using different superscripts (p<0.05), while no significant difference is shown using the same superscript. LN: low nutrients, MN: medium nutrients, HN: high nutrients. Significant differences among the nutrients groups are marked by “*”, while no significant difference is shown without “*”图4 夏季双因素模拟实验浮游生物群落总初级生产力的变化 |
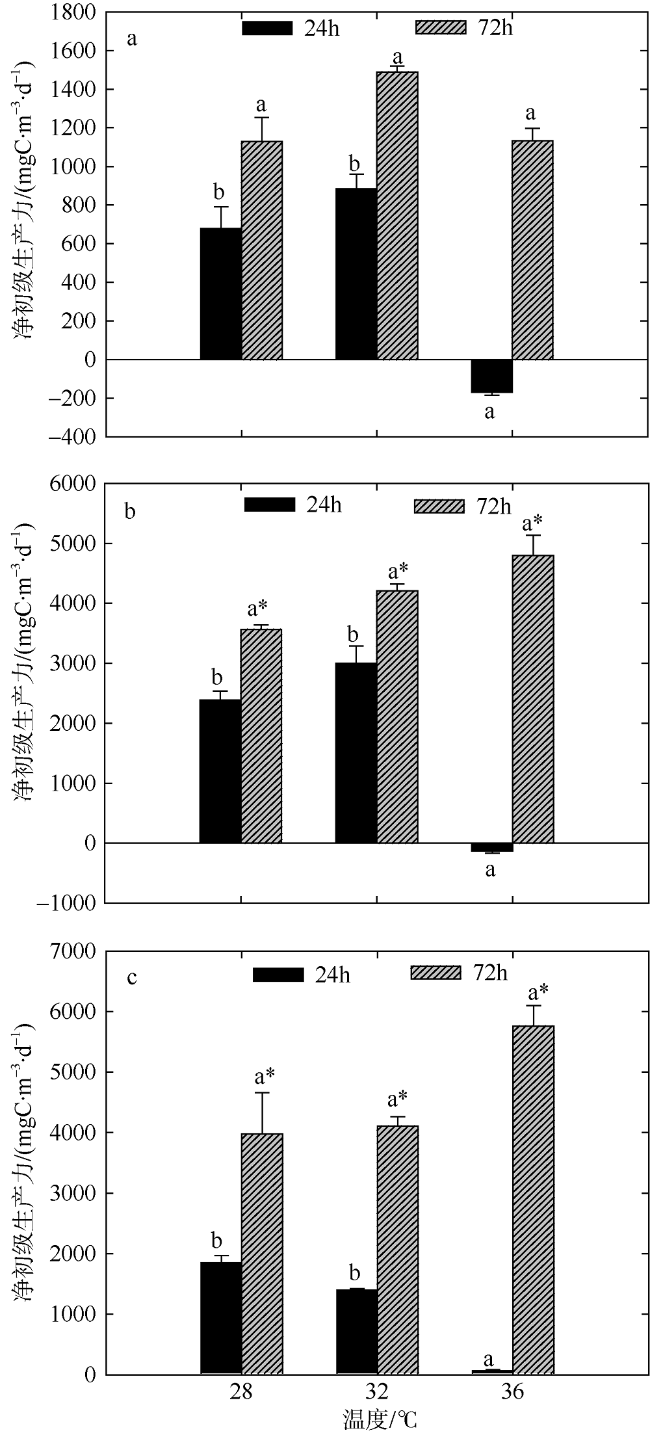
Fig. 5 Variation of plankton NCP of two-factors simulated experiments in summer. Significant differences among the temperature groups are indicated by using different superscripts (p<0.05), while no significant difference is shown using the same superscript. LN: low nutrients, MN: medium nutrients, HN: high nutrients. Significant differences among the nutrients groups are marked by “*”, while no significant difference is shown without “*”图5 夏季双因素模拟实验浮游生物群落净生产力的变化 |
Tab. 3 Ratio of GPP/CR of two-factors simulated experiments during summer and winter表3 TSE浮游生物总生产与总代谢的比值(GPP/CR) |
| 营养盐 | 夏季 | 冬季 | |||||||
|---|---|---|---|---|---|---|---|---|---|
| 28℃ | 32℃ | 36℃ | 均值 | 20℃ | 24℃ | 28℃ | 均值 | ||
| 24h | 低营养 | 5.21 | 4.32 | 0.47 | 3.33 | 5.38 | 2.78 | 1.76 | 3.31 |
| 中营养 | 10.50 | 21.00 | 0.44 | 10.65 | 2.63 | 2.60 | 2.37 | 2.53 | |
| 高营养 | 8.14 | 7.53 | 1.44 | 5.70 | 2.63 | 3.00 | 1.40 | 2.34 | |
| 均值 | 7.95 | 10.95 | 0.78 | 3.55 | 2.79 | 1.84 | |||
| 72h | 低营养 | 3.98 | 3.86 | 10.72 | 6.19 | 2.51 | 5.92 | 3.12 | 3.85 |
| 中营养 | 8.15 | 11.39 | 11.63 | 10.39 | 2.91 | 4.52 | 3.14 | 3.52 | |
| 高营养 | 10.72 | 13.18 | 19.07 | 14.32 | 2.95 | 4.00 | 4.41 | 3.79 | |
| 均值 | 7.62 | 9.48 | 13.81 | 2.79 | 4.81 | 3.56 | |||
Fig. 6 Variation of plankton CR of two-factors simulated experiments in winter. Significant differences among the temperature groups are indicated by using different superscripts (p<0.05), while no significant difference is shown using the same superscript. LN: low nutrients, MN: medium nutrients, HN: high nutrients. Significant differences among the nutrients groups are marked by “*”, while no significant difference is shown without “*”图6 冬季双因素模拟实验浮游生物群落CR值变化 |
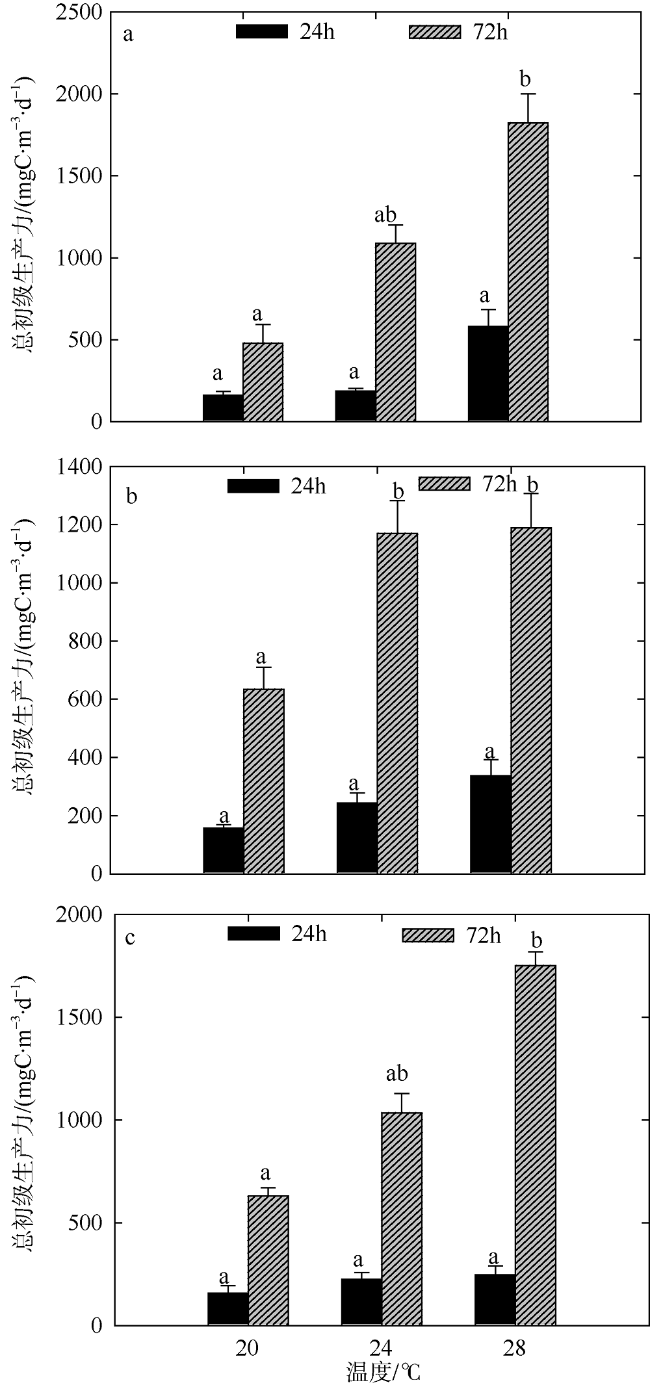
Fig. 7 Variation of plankton GPP of two-factors simulated experiments in winter. Significant differences among the temperature groups are indicated by using different superscripts (p<0.05), while no significant difference is shown using the same superscript. LN: low nutrients, MN: medium nutrients, HN: high nutrients. Significant differences among the nutrients groups are marked by “*”, while no significant difference is shown without “*”图7 冬季双因素模拟实验浮游生物群落GPP值变化 |
Fig. 8 Variation of plankton NCP of two-factors simulated experiments in winter. Significant differences among the temperature groups are indicated by using different superscripts (p<0.05), while no significant difference is shown using the same superscript. LN: low nutrients, MN: medium nutrients, HN: high nutrients. Significant differences among the nutrients groups are marked by “*”, while no significant difference is shown without “*”图8 冬季双因素模拟实验浮游生物群落NCP值变化 |
The authors have declared that no competing interests exist.
| [1] |
|
| [2] |
|
| [3] |
|
| [4] |
|
| [5] |
|
| [6] |
|
| [7] |
|
| [8] |
|
| [9] |
|
| [10] |
|
| [11] |
|
| [12] |
|
| [13] |
|
| [14] |
|
| [15] |
|
| [16] |
|
| [17] |
|
| [18] |
|
| [19] |
|
| [20] |
|
| [21] |
|
| [22] |
|
| [23] |
|
| [24] |
|
| [25] |
|
| [26] |
|
| [27] |
|
/
| 〈 |
|
〉 |


