
Journal of Tropical Oceanography >
An analysis of response characteristics of saline circulation to typhoon precipitation in South China Sea
Copy editor: LIN Qiang
Received date: 2018-10-16
Request revised date: 2018-11-27
Online published: 2019-06-17
Supported by
The National Natural Science Foundation of China(91428206)
The National Natural Science Foundation of China(41576022)
The National Natural Science Foundation of China(41811530301)
The National Natural Science Foundation of China(91528304)
The National Natural Science Foundation of China(41621064)
The National Key Research and Development Program of China(2017YFC1404103)
The National Programme on Global Change and Air-Sea Interaction(GASI-IPOVAI-04)
Program of Shanghai Academic/Technology Research Leader(17XD1400600)
Copyright
By using various satellite remote sensing data and statistical analysis method, the contribution of typhoons in summer (from June to September) to the precipitation and freshwater flux in the South China Sea (SCS) and their possible influences on circulation anomalies in the SCS in the past 17 years (2000-2016) were studied. The main conclusions are as follows. Typhoon is one of the crucial factors that impact the precipitation in both northern and middle SCS, and the daily mean precipitation can be increased by 12 mm, which accounts for half of the daily mean rainfall in the SCS during summer. Besides, there are significant differences in the location and intensity of the rainfall distributions between the Northwest Pacific Ocean typhoons (NWP TYs) and SCS typhoons(SCS TYs). In summer, the saline circulation in the SCS induced by freshwater flux shows a weak cyclone that centers in the southwestern part of Hainan island with its magnitude of about -0.15 Sv, which is approximately 10% of wind-induced circulation (about -1.5 Sv) during the corresponding period. Precipitation induced by typhoons can intensify cyclonic saline circulation in the northern-central part of the SCS in summer. And the intensity of the saline circulation caused by NWP typhoons is stronger compared to that by SCS typhoons.
Key words: typhoon; freshwater flux; saline circulation; South China Sea
LIU Na , WANG Guihua , GONG Yuanfa , LIU Lei . An analysis of response characteristics of saline circulation to typhoon precipitation in South China Sea[J]. Journal of Tropical Oceanography, 2019 , 38(3) : 13 -21 . DOI: 10.11978/2018107
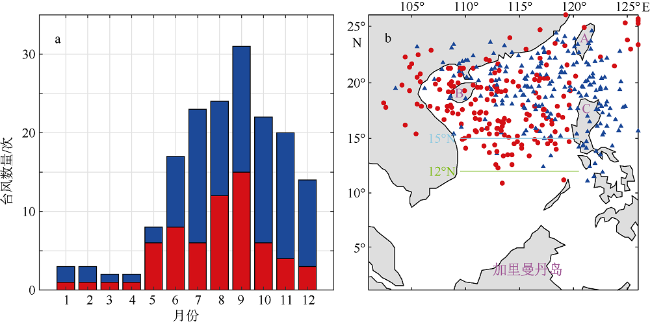
图1 南海台风的季节变化(a)和夏季每24h台风中心位置(b)a、b中蓝色代表西北太平洋台风, 红色代表南海“土台风”; b中A: 台湾岛; B: 海南岛; C: 吕宋岛 Fig. 1 Seasonal variation of TYs in the SCS (a) and 24h locations of TYs in summer (b). The blue triangles represent NWP TYs, and red dots represent SCS TYs. A: Taiwan Island; B: Hainan Island; C: Luzon Island |
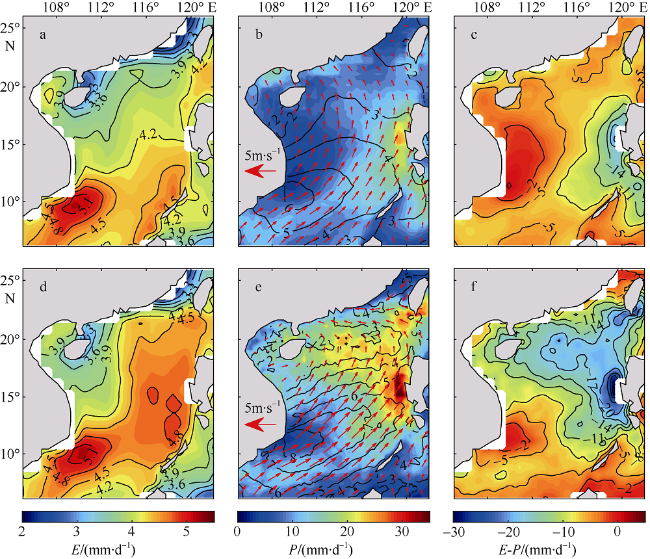
图2 夏季南海气候态(a—c)和台风期间(d—f)的蒸发(a、d)、降水和风场(b、e)以及淡水通量(c、f)分布b、e中的等值线表示风速 Fig. 2 Average distribution maps of evaporation (a, d), rainfall and wind (b, e), and freshwater flux (c, f) in summer. (a-c): Evaporation, rainfall and wind, and freshwater flux of the original forcing, respectively. (d-f): Evaporation, rainfall and wind, and freshwater flux of the forcing with all TYs, respectively. The isobaths in (b, e) represent wind speed |
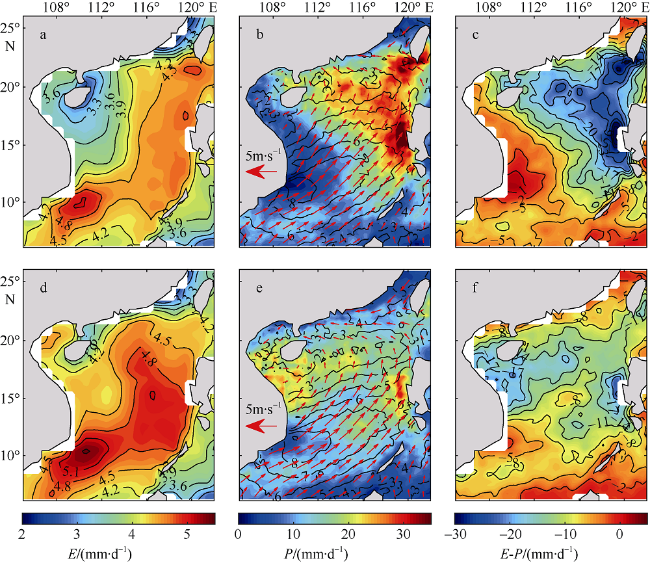
图3 夏季南海西北太平洋台风(a—c)和南海“土台风”期间(d—f)的蒸发(a、d)、降水和风场(b、e)以及淡水通量(c、f)分布b、e中的等值线表示风速 Fig. 3 Average distribution maps of evaporation (a, d), rainfall and wind (b, e), and freshwater flux (c, f) in summer. (a-c): Evaporation, rainfall and wind, and freshwater flux of the forcing only with NWP TYs, respectively. (d-f): Evaporation, rainfall and wind, and freshwater flux of the forcing only with SCS TYs respectively. The isobaths in (b, e) represent wind speed |
图4 夏季南海所有台风(a、d)、西北太平洋台风(b、e)和南海“土台风”(c、f)引起的降水及海表面风异常(a—c)、淡水通量异常(d—f)Fig. 4 Differences of rainfall, wind field (a-c) and freshwater flux (d-f) in summer between the original forcing and the forcing with all TYs (a, d); between the original forcing and the forcing only with NWP TYs (b, e); and between the original forcing and the forcing only with SCS TYs (c, f) |
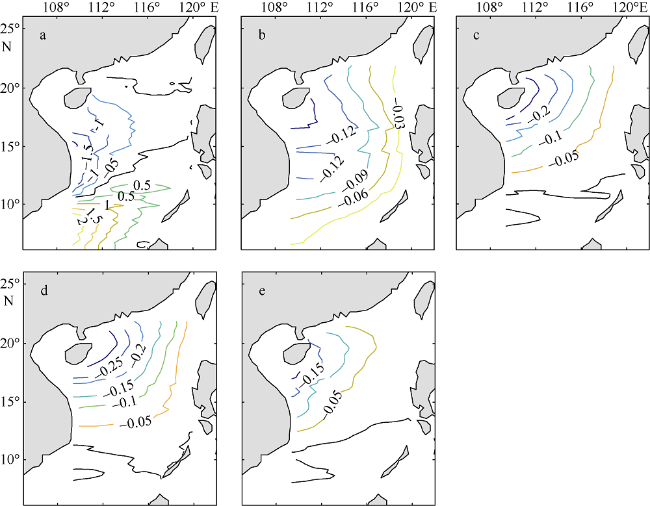
图5 夏季气候态Sverdrup流函数(a)和气候态(b)、所有台风(c)、西北太平洋台风(d)以及南海“土台风”(e)的G-S正压流函数(单位: Sv) 1Sv=10-6m3·s-1。负值代表气旋式环流, 黑色粗实线代 Fig. 5 Stream function of the original wind forcing calculated from the Sverdrup theory (a) and G-S barotropic stream function of the original rainfall forcing (b). Also shown are the rainfall forcing with all TYs (c); the rainfall forcing only with NWP TYs (d); the rainfall forcing only with SCS TYs (e) (units: Sv; 1 Sv=10-6 m3·s-1). The negative values represent cyclonic circulation, and the thick black line represents zero |
The authors have declared that no competing interests exist.
作者已声明无竞争性利益关系。
| [1] |
陈润珍 , 2007. 南海热带气旋纬向分布特征[J]. 台湾海峡, 26(4):465-471.
|
| [2] |
关芬呈, 谢清华 , 1984. 南海台风的统计特征[J]. 海洋通报, 3(4):19-27.
|
| [3] |
黄瑞新 , 2012. 大洋环流: 风生与热盐过程[M]. 北京: 高等教育出版社: 466-475.
|
| [4] |
钮学新, 杜惠良, 滕代高 , 等, 2010. 影响登陆台风降水量的主要因素分析[J]. 暴雨灾害, 29(1):76-80.
|
| [5] |
苏纪兰, 袁立业 , 2005. 中国近海水文[M]. 北京: 海洋出版社: 263-271.
|
| [6] |
吴迪生, 赵雪, 冯伟忠 , 等, 2005. 南海灾害性土台风统计分析[J]. 热带气象学, 21(3):309-314.
|
| [7] |
|
| [8] |
|
| [9] |
|
| [10] |
|
| [11] |
|
| [12] |
|
| [13] |
|
| [14] |
|
| [15] |
|
| [16] |
|
| [17] |
|
| [18] |
|
| [19] |
|
| [20] |
|
| [21] |
|
| [22] |
|
| [23] |
|
| [24] |
|
| [25] |
|
| [26] |
|
| [27] |
|
| [28] |
|
/
| 〈 |
|
〉 |

