
Journal of Tropical Oceanography >
Intraseasonal-to-semiannual variability of barrier layer thickness in the eastern equatorial lndian Ocean and Bay of Bengal
Copy editor: YIN Bo
Received date: 2018-11-29
Request revised date: 2019-03-03
Online published: 2019-10-09
Supported by
National Key Research Development Program of China(2018YFA0605702)
Natural Science Foundation of China(41522601)
Natural Science Foundation of China(41876002)
Natural Science Foundation of China(41876224)
Fundamental Research Funds for the Central Universities(2017B04714)
Fundamental Research Funds for the Central Universities(2017B04114)
Copyright
Based on the gridded temperature and salinity data of ARGO and satellite observations from 2002 to 2015, the intraseasonal-to-semiannual variability of barrier layer (BL) in the eastern equatorial Indian Ocean (EEIO) and Bay of Bengal (BOB) is revealed, and its variation mechanism is discussed. The results show that strong variation of barrier layer thickness (BLT) is located in the EEIO and northern BOB. In the equatorial region, the variability in BLT is affected by both isothermal layer depth (ILD) and mixing layer depth (MLD). From May to July and from November to January, driven by westerly winds, the Wyrtki jet carries high-salinity water from the Arabian Sea to the eastern equatorial region, forming salinity stratification with fresh water on the surface. The downwelling Kelvin wave, which is also driven by westerly winds, deepens the isothermal layer. Then, the isothermal layer separates from the mixed layer. The barrier layer is formed. In the northern BOB, a large amount of fresh water brought by abundant rainfall and runoff produces strong salinity stratification near the surface, which causes the mixed layer to be very shallow all year round. The intraseasonal-to-semiannual variability in BLT is mainly controlled by ILD. A dynamic correlation exists between the two high value regions. The equatorial westerly (easterly) winds force the downwelling (upwelling) Kelvin wave to spread eastward, and it turns into a coastal Kelvin wave when arriving at Sumatra Island; then, the waves propagate northward to the eastern and northern boundaries of the BOB. In addition, at the top of Burma's Irrawaddy Delta, the coastal Kelvin wave radiates Rossby waves that cause positive (negative) anomalies of ILD in the bay. The wave speed determines the change in the bay, which lags the equatorial region by 1~2 months.
MA Tian , QI Yiquan , CHENG Xuhua . Intraseasonal-to-semiannual variability of barrier layer thickness in the eastern equatorial lndian Ocean and Bay of Bengal[J]. Journal of Tropical Oceanography, 2019 , 38(5) : 18 -31 . DOI: 10.11978/2018132
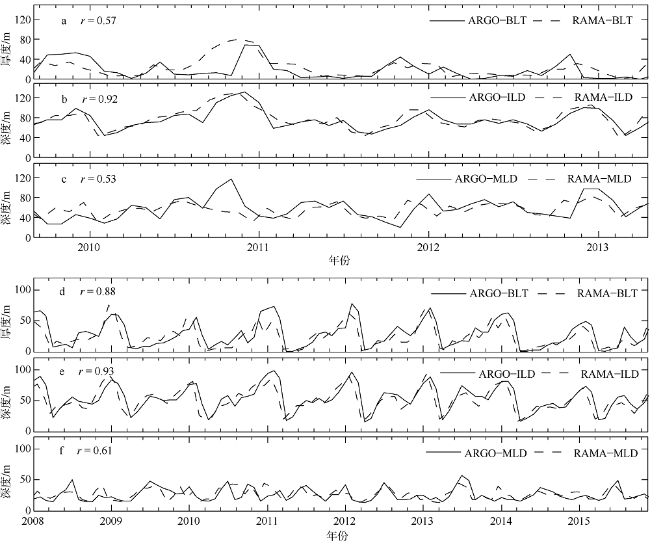
图3 ARGO网格化数据(实线)与RAMA浮标数据(虚线)计算得到的障碍层(BLT)、等温层(ILD)、混合层(MLD)时间序列a、b、c位于(90°E, 0°N); d、e、f 位于(90°E, 15°N) Fig. 3 Barrier layer thickness (BLT), isothermal layer depth (ILD), and mixed layer depth (MLD) derived from gridded ARGO data (solid curves) and RAMA data (dashed curves) at (90°E, 0°) (a, b, c) and at (90°E, 15°N) (d, e, f) |
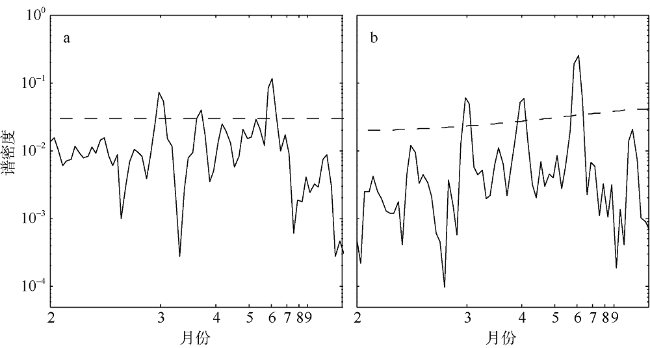
图6 区域A平均(a)和区域B平均(b)的障碍层厚度功率谱(7个月高通滤波)虚线表示95%信度水平 Fig. 6 Power spectra for barrier layer thickness after 7-month high-pass filtering in the regions A (a) and B (b). The dash curve indicates the 95% confidence levels |
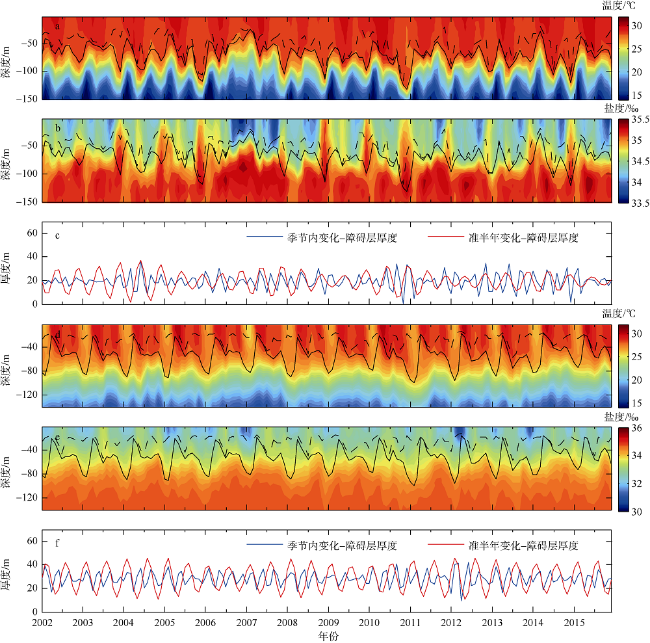
图8 温度、盐度(填色)廓线和等温层深度(黑色实线)、混合层深度(黑色虚线)、障碍层厚度随时间变化a、b、c位于(90°E, 0°N); d、e、f位于(90°E, 15°N)。图c和图f中红线为障碍层厚度5~7个月带通滤波结果, 蓝线为障碍层厚度2.5~4.5个月带通滤波结果 Fig. 8 Depth-time sections of temperature, salinity (shaded), and time series of isothermal layer depth (black lines), mixed layer depth (black dashed lines), and barrier layer thickness. The red line indicates the barrier layer thickness in the 5~7 month band. The blue line indicates the barrier layer thickness in the 2.5~4.5 month band. Panels (a, b, c) are at (90°E, 0°); and (d, e, f) are at (90°E, 15°N) |
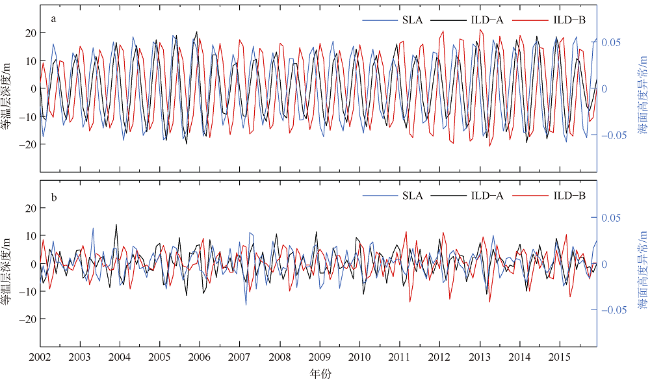
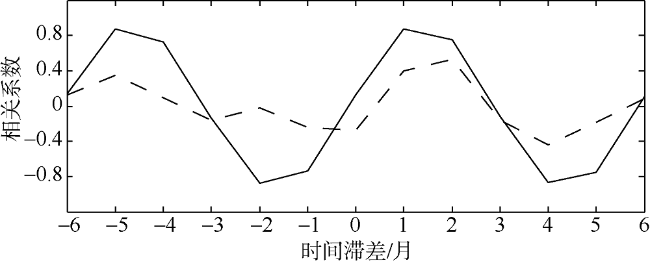
图9 海面高度异常(SLA)和等温层深度(ILD)时间序列a. 5~7个月带通滤波结果; b. 2.5~4.5个月带通滤波结果。图例中SLA表示区域A海面高度异常; ILD-A表示区域A等温层深度; ILD-B表示区域B等温层深度 Fig. 9 Time series of sea level anomaly (SLA) and isothermal layer depth (ILD). Blue line indicates SLA in Region A, and black line indicates ILD in Region A. Red line indicates ILD in Region B. Panels a and b show variability in the 5~7 month band, and 2.5~4.5 month band, respectively |
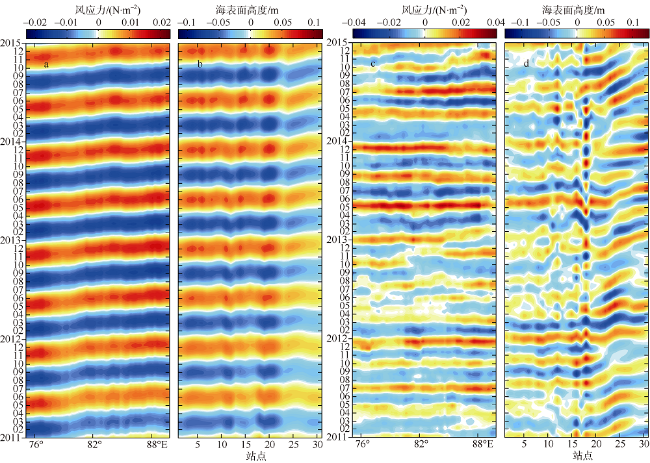
图11 断面纬向风应力和各站点海面高度异常随时间变化图a. 纬向风应力(170~190d带通滤波); b. 海面高度异常(170~190d带通滤波); c. 纬向风应力(75~135d带通滤波); d. 海面高度异常(75~135d带通滤波) Fig. 11 Time-longitude plots of zonal wind stress and time-station plots of sea level anomaly. (a) Zonal wind stress in the 170~190 day band; (b) Sea level anomaly in the 170~190 day band; (c) Zonal wind stress in the 75~135 day band; (d) Sea level anomaly in the 75~135 day band |
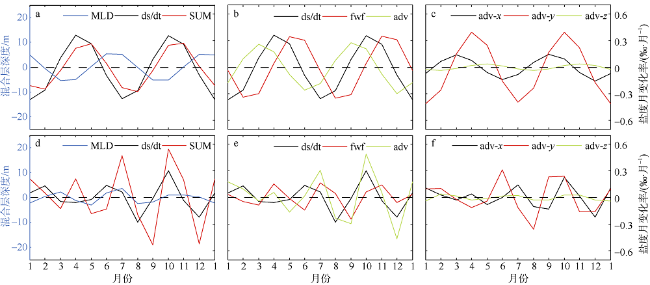
图13 区域A盐度收支与混合层深度变化a、b、c为5~7个月带通滤波结果; d、e、f为2.5~4.5个月带通滤波结果。图例中MLD表示混合层深度; ds/dt表示盐度月变化率; SUM表示盐度收支方程右侧各项之和; fwf表示淡水通量; adv表示水平平流和垂向夹卷之和; adv-x/y/z分别表示纬向输运、经向输运和垂向输运 Fig. 13 Salt budget and mixed layer depth variation in Region A, with MLD for mixed layer depth, ds/dt for salinity monthly tendency, SUM for sum of the right-hand side of salt budget, fwf for freshwater flux, adv for sum of horizontal (zonal & meridional) advections and entrainment, and adv-x/y/z for zonal/meridional/vertical transports, respectively. (a, b, c): 5~7 month band; (d, e, f): 2.5~4.5 month band |
图14 区域B盐度收支与混合层变化a、b、c为5~7个月带通滤波结果; d、e、f为2.5~4.5个月带通滤波结果。图例中MLD表示混合层深度; ds/dt表示盐度月变化率; SUM表示盐度收支方程右侧各项之和; fwf表示淡水通量; adv表示水平平流和垂向夹卷之和; adv-x/y/z分别表示纬向输运、经向输运和垂向输运 Fig. 14 Salt budget and mixed layer depth variation in Region B, with MLD for mixed layer depth, ds/dt for salinity monthly tendency, SUM for sum of the right-hand side of salt budget, fwf for freshwater flux, adv for sum of horizontal (zonal & meridional) advections and entrainment, and adv-x/y/z for zonal/meridional/vertical transports, respectively. (a, b, c): 5~7 month band; (d, e, f): 2.5~4.5 month band |
| [1] |
李奎平, 王海员, 刘延亮 , 等, 2013. 孟加拉湾春季海温增暖对其夏季风爆发的影响[J]. 海洋科学进展, 31(4):438-445.
|
| [2] |
林小刚, 齐义泉, 程旭华 , 2014. 3—5月份东印度洋上层水文要素特征分析[J]. 热带海洋学报, 33(3):1-9.
|
| [3] |
林新宇, 邱云, 杜岩 , 等, 2016. 孟加拉湾海表盐度变化特征的卫星遥感应用研究[J]. 海洋学报, 38(5):46-56.
|
| [4] |
邱云 , 2007. 孟加拉湾上层环流及其变异研究[D]. 厦门: 厦门大学.
|
| [5] |
孙启伟, 杜岩, 张玉红 , 2017. 利用Argo和Aquarius卫星观测研究热带南印度洋海表盐度的季节变化[J]. 热带海洋学报, 36(4):25-34.
|
| [6] |
晏红明, 肖子牛, 王灵 , 2004. 孟加拉湾季风活动与云南5月降雨量[J]. 高原气象, 22(6):624-630.
|
| [7] |
张玉红, 徐海明, 杜岩 , 等, 2009. 阿拉伯海东南海域盐度收支的季节变化[J]. 热带海洋学报, 28(5):66-74.
|
| [8] |
|
| [9] |
|
| [10] |
|
| [11] |
|
| [12] |
|
| [13] |
|
| [14] |
|
| [15] |
|
| [16] |
|
| [17] |
|
| [18] |
|
| [19] |
|
| [20] |
|
| [21] |
|
| [22] |
|
| [23] |
|
| [24] |
|
| [25] |
|
| [26] |
|
| [27] |
|
| [28] |
|
| [29] |
|
| [30] |
|
| [31] |
|
| [32] |
|
/
| 〈 |
|
〉 |


