
Journal of Tropical Oceanography >
Influence of sea surface temperature gradients in the tropical Pacific and Indian oceans of the Northern Hemisphere on the frequency of tropical cyclone generation in the western North Pacific in summer
Copy editor: YIN Bo
Received date: 2018-12-12
Request revised date: 2019-04-04
Online published: 2019-10-09
Supported by
National Natural Science Foundation of China(41575083)
National Natural Science Foundation of China(41730961)
Copyright
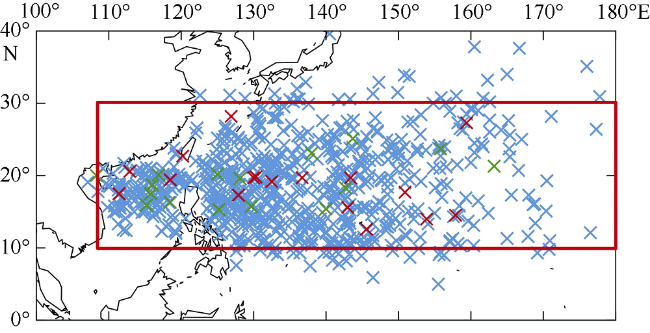
Based on the Hadley Center sea surface temperature (SST) data, NECP/NCAR reanalysis data from 1951 to 2018 and numerical model (ECHAM4) simulation outputs, in view of the unusually large number of tropical cyclones (TCs) in the western North Pacific such as in 1994 and 2018, the modalities of SST anomalies (SSTA) and their influence mechanism were studied, in terms of their impacts on the increase of TC generation. It is suggested that the warming of the central tropical Pacific and the cooling of the Indian Ocean in the Northern Hemisphere are the main reasons for the increase of TC generated in the western North Pacific in summer, and the North Atlantic negative tripolar type of SSTA leads to further increase in the TC generated. The central tropical Pacific warming and the Indian Ocean cooling produce anomalous westerly wind and cyclonic circulation anomalies in the east of the Philippines. The North Atlantic negative tripolar type of SSTA excites cyclonic circulation anomalies from the South China Sea and the Philippine Seas to the southeast coast waters of China. The former in the central Pacific Ocean and the latter in the South China Sea create local environments conducive to TC generation. In the summers of 1994 and 2018, the central tropical Pacific SSTAs were warm, the Indian Ocean SSTAs were cold, and the North Atlantic showed negative tripolar type of SSTA. The number of TC generated in the western Pacific Ocean increased greatly. In the past 30 years, when the central tropical Pacific warmed up and the Indian Ocean cooled down, the North Atlantic showed a stronger negative tripolar type of SSTA than that before 1989, the linear correlation between the Pacific Northwest TC generation and Indian Ocean-Pacific SSTA gradients was more significant.
FANG Ke , YU Jinhua . Influence of sea surface temperature gradients in the tropical Pacific and Indian oceans of the Northern Hemisphere on the frequency of tropical cyclone generation in the western North Pacific in summer[J]. Journal of Tropical Oceanography, 2019 , 38(5) : 42 -51 . DOI: 10.11978/2018136
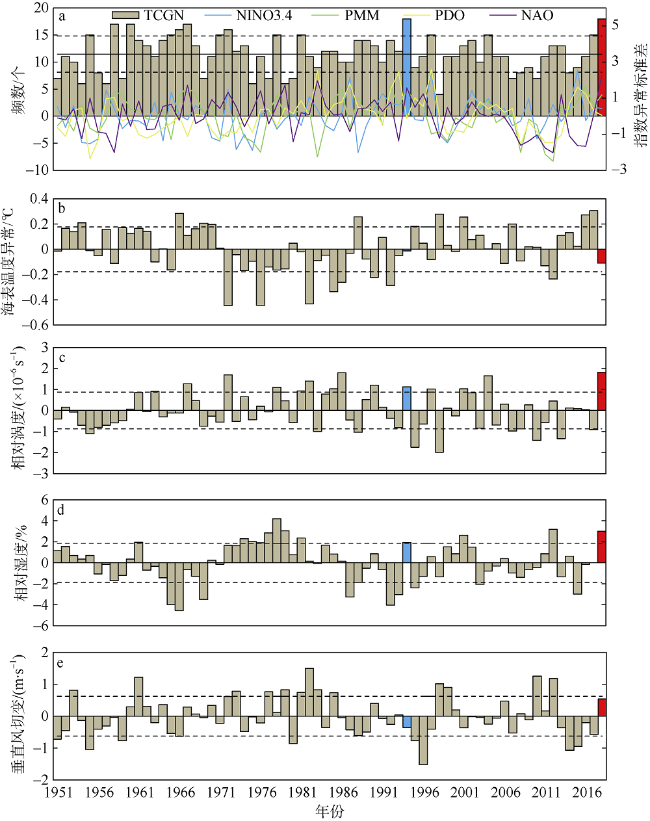
图2 1951—2018年夏季热带气旋生成频数(TCGN)、各指数和环境要素区域平均(105°—180°E, 10°—30°N)异常的时间序列a. TCGN和气候指数标准差; b. 海表温度异常(SSTA); c. 850hPa相对涡度; d. 600hPa相对湿度; e. 850~200hPa纬向风切变。黑色虚线为正负一倍标准差, 黑色实线为平均值, 蓝色竖柱为1994年, 红色竖柱为2018年 Fig. 2 The TCGN, climate indices and regional average (105°-180°E, 10°-30°N) of environmental factors at summers from 1951 to 2018: TCGN (a, left coordinate) and climate indices (a, NINO3.4, PMM, PDO, NAO; right coordinate), SSTA (b, units: ℃), anomalous relative vorticity at 850 hPa (c, units: ×10-6 s-1), anomalous relative humidity at 600 hPa (d, units: %), anomalous vertical wind shear of zonal wind between 850 and 200 hPa (e, units: m·s-1). The black dotted line is one standard deviation, and the solid black line is the average |
图3 1994年(a)和2018年(b)夏季海表温度异常(阴影, 单位: ℃)和850hPa风场异常(矢量, 单位: m·s-1)的空间分布红框为选取的北半球热带中太平洋海域, 蓝框为选取的北半球热带印度洋海域 Fig. 3 Spatial distributions of SSTA (shading; units: ℃) and anomalous wind vector at 850 hPa (vector; units: m·s-1) in summers of 1994 (a) and 2018 (b). The red box is the tropical Pacific Ocean, and the blue box is the tropical Indian Ocean in the Northern Hemisphere |
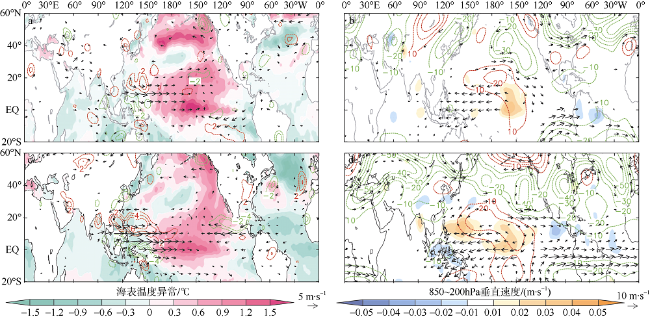
图5 1951—1988年(a, b)和1989—2018年(c, d) TPI指数高年减低年的夏季环境场空间分布合成图a和c中阴影为海表温度异常(单位: ℃), 矢量为850hPa风场异常(单位: m·s-1), 等值线为850hPa相对涡度异常(单位: ×10-6s-1); b和d中阴影为850~200hPa垂直速度(单位: m·s-1), 矢量为200hPa风场异常(单位: m·s-1), 等值线为200hPa位势高度异常(单位: gpm)。除SSTA和200hPa位势高度外的其他环境场仅给出通过95%信度检验 Fig. 5 Composite anomalous fields of environmental factors, respectively, in summers of 1951-1988 (a, b) and 1989-2018 (c, d). SSTA (a, c, shading; units: ℃), anomalous wind vector at 850 hPa (a, c, vector; units: m·s-1), anomalous relative vorticity at 850 hPa (a, c, dotted lines; units: 10-6 s-1), 850~200 hPa vertical speed (b, d, shading; units: m·s-1), anomalous wind vector at 200 hPa (b, d, vector; units: m·s-1), anomalous geopotential height at 200 hPa (b, d, dotted line; units: gpm). Shown are the environmental factors except for SSTA and geopotential height at 200 hPa exceeding the 95% significant level |
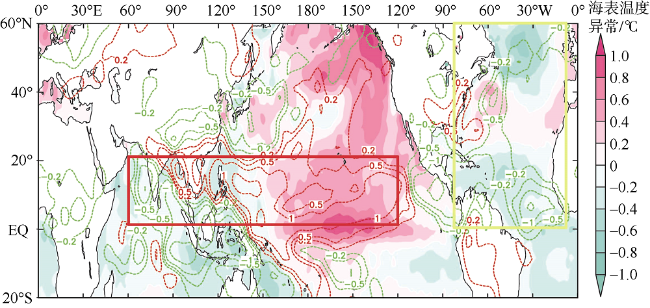
图6 1989—2018年夏季全球海表温度异常(阴影, 单位: ℃)和降水(等值线, 单位: mm·d-1)对TPI指数的回归分布红框为TPI-SSTA, 黄框为NA-SSTA Fig. 6 Regression distributions of global SSTA (shading; units: °C) and precipitation (dashed line; units: mm·d-1) for the TPI index in the summers of 1989-2018. The red box is TPI-SSTA, and the yellow box is NA-SSTA |
表1 ECHAM4试验设计Tab. 1 Target regions for the numerical experiments |
| 试验名称 | 气候态海温范围 | 添加异常海温范围 |
|---|---|---|
| 控制试验 | 0°—360°, 90°S—90°N | 无 |
| TPI-RUN | 0°—360°, 90°S—90°N | 60°E—120°W, 0°—20°N |
| NA-RUN | 0°—360°, 90°S—90°N | 80°—10°W, 0°—60°N |
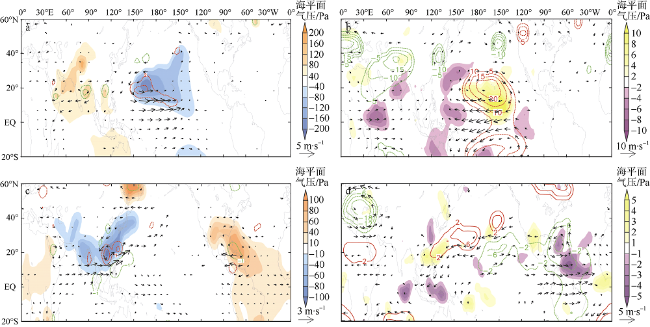
图7 夏季环境要素对TPI-RUN (a, b)和NA-RUN (c, d)强迫的响应a和c阴影为海平面气压(单位: Pa), 矢量为850hPa风场(单位: m·s-1), 等值线为850hPa相对涡度(单位: ×10-6s-1); b和d阴影为600hPa相对湿度(单位: %), 矢量为200hPa风场(单位: m·s-1), 等值线为200hPa位势高度(单位: gpm)。仅给出通过95%信度检验 Fig. 7 Responses of environmental factors in the Northern Hemisphere to TPI-RUN (a, b) and NA-RUN (c, d) in summer. Sea level pressure (a, c, shading; units: Pa), wind vector at 850 hPa (a, c, vector, units: m·s-1), relative vorticity at 850 hPa (a, c, dotted line; red/green is positive/negative; units: ×10-6 s-1), relative humidity at 600 hPa (b, d, shading; units: %), wind vector at 200 hPa (b, d, vector; units: m·s-1), geopotential height at 200 hPa (b, d, dotted line; red/green is positive/negative; units: gpm). Shown are the environmental factors exceeding the 95% significant level |
| [1] |
李丹荔 , 1988. 南海形成的台风数与北太平洋SST关系分析[J]. 热带海洋, 7(4): 81- 82, 85-87.
|
| [2] |
李刚, 李崇银, 江晓华 , 等, 2015. 1900—2009年全球海表温度异常的时空变化特征分析[J]. 热带海洋学报, 34(4):12-22.
|
| [3] |
李琰, 王庆元, 李欢 , 等, 2014. 前期热带太平洋、印度洋持续性海温异常事件对菲律宾低层大气环流的影响[J]. 热带海洋学报, 33(1):36-43.
|
| [4] |
刘钦燕, 周文 , 2010. 西北太平洋台风数目与海洋热含量的年代际关系分析[J]. 热带海洋学报, 29(6):8-14.
|
| [5] |
叶英, 董波 , 1997. 1994/1995年西北太平洋热带气旋气候特征与热带海洋和大气环流分析[J]. 海洋预报, 14(2):44-52.
|
| [6] |
晏红明, 李清泉, 袁媛 , 等, 2013. 夏季西北太平洋大气环流异常及其与热带印度洋—太平洋海温变化的关系[J]. 地球物理学报, 56(8):2542-2557.
|
| [7] |
周旭, 余锦华, 王志福 , 2013. 西北太平洋热带气旋频数的气候变化及其与环境要素间的联系[J]. 气象科学, 33(1):43-50.
|
| [8] |
|
| [9] |
|
| [10] |
|
| [11] |
|
| [12] |
|
| [13] |
|
| [14] |
|
| [15] |
|
| [16] |
|
| [17] |
|
| [18] |
|
| [19] |
|
| [20] |
|
| [21] |
|
| [22] |
|
/
| 〈 |
|
〉 |

