
Journal of Tropical Oceanography >
Comparison and prediction of unusual-turning tracks of typhoons Nock-ten and Orma
Received date: 2019-04-24
Request revised date: 2019-06-26
Online published: 2020-01-09
Supported by
National Natural Science Foundation of China(41671022)
National Natural Science Foundation of China(41575063)
Huai River Basin Meteorological Open Research Fund And Anhui Key Laboratory Of Atmospheric Science and Satellite Remote Sensing Open Fund(HRM201701)
Copyright
In this paper, the circulations of Typhoon Nock-ten with abnormal northward turning and of Typhoon Omar with abnormal westward turning near Taiwan Island are analyzed and compared. The total flow is decomposed into climatic and anomalous flows, and the abnormal turning paths of Nock-ten and Omar are forecasted by using the beta-advection model. The results are as follows. 1) Analyses of total flow at 500 hPa reveal that the main influencing environmental systems include the western North Pacific subtropical high and the west trough during the period of unusual north-turning; the western North Pacific subtropical high and the Continental high merged and consolidated at the north and one typhoon in the southeast, which favored Orma’s unusual western turning. 2) Anomalous flows manifested that southwesterly wind gradually aggrandized on the south side of Nock-ten, the southeasterly wind gradually changed into southerly wind on the east side, forming a northwardly "belt" at the unusual north-turning time; there maintained an anticyclone during the unusual west-turning time on the north side of Orma. 3) The generalized beta-advection model is applied to identify the tracks of Nock-ten and Omar. Results show that the north-turning Nock-ten track is forecasted well by considering the climatic and anomalous flows, whereas the west-turning Orma is forecasted well with the consideration of anomalous flow.
WANG Min , YIN Yixing , CHEN Xiaoyang , ZHAO Yang . Comparison and prediction of unusual-turning tracks of typhoons Nock-ten and Orma[J]. Journal of Tropical Oceanography, 2020 , 39(1) : 53 -65 . DOI: 10.11978/2019042
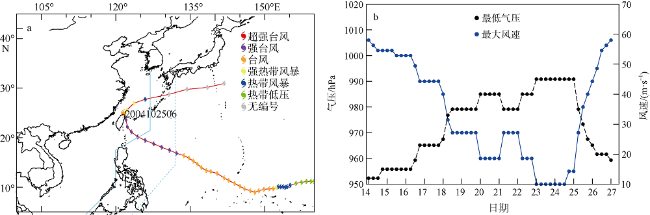
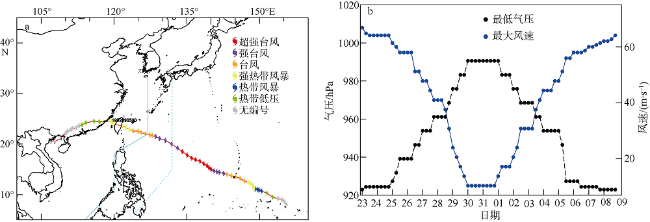
图2 台风“洛坦”的路径图(a)及台风近中心最低气压、最大风速随时间的变化示意图(b)图a中蓝色虚线表示中央气象台规定的48h警戒线,蓝色实线表示24h警戒线 Fig. 2 Tracks of Typhoon Nock-ten (a) and its variation of min pressure and max wind (b) Severe tropical storm. The blue dotted line indicates 48-hour warning line, and the blue solid line indicates 24-hour waring line. |
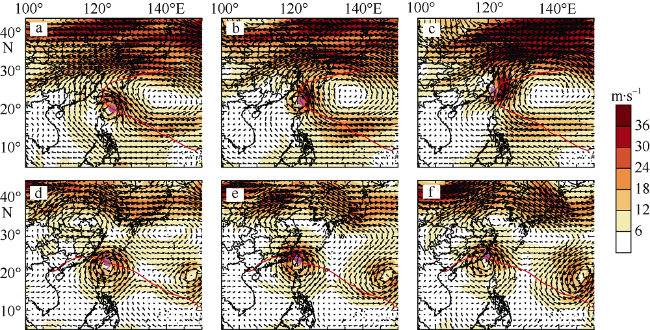
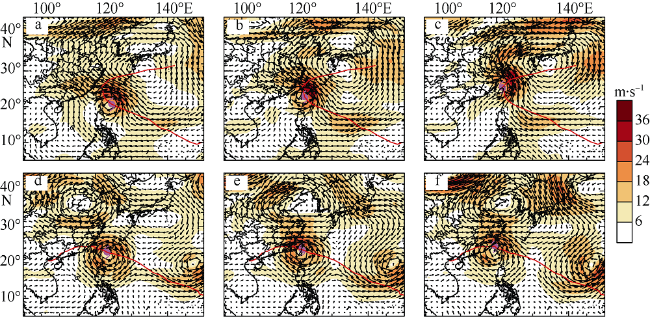
图4 “奥玛”(a—c)和“洛坦”(d—f)异常偏折过程中的500hPa全风场(单位: m·s-1)a、d为异常偏折前24h; b、e为异常偏折前12h; c、f为异常偏折时刻。粉色台风符号为对应时刻台风的位置, 红色实线为台风的路径, 填色为风速 Fig. 4 Total flows at 500 hPa of typhoons Nock-ten and Orma (units: m·s-1). (a, d) are 24 hours before unusual turning time; (b, e) are 12 hours before unusual turning time; (c, f) are unusual turning times. Pink symbol represents the TC’s location, and red line represents the track of typhoon, shading is for speed |
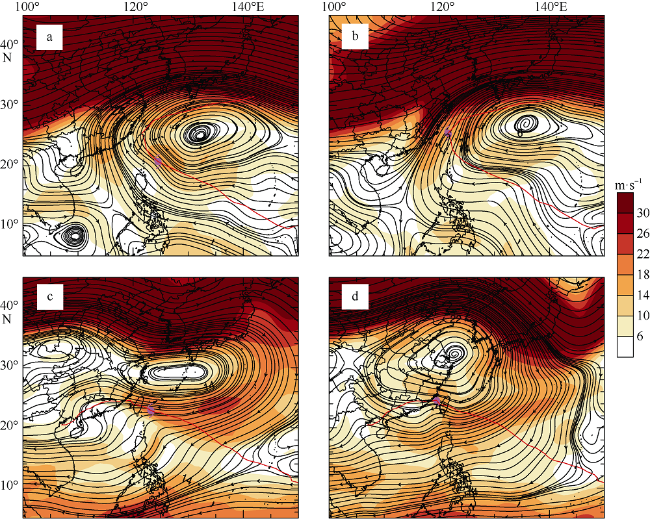
图6 “洛坦”(a、b)和“奥玛”(c、d)200hPa的旋转风场a、c为异常偏折前24h, b、d为异常偏折时刻, 填色为旋转风速 Fig. 6 Rotational flow field of typhoons Nock-ten (a, b) and Orma (c, d) at 200 hP. (a, c) are at 24 hours before unusual turning time, and (b, d) are at unusual turning times. Shading is for the speed of rotational wind |
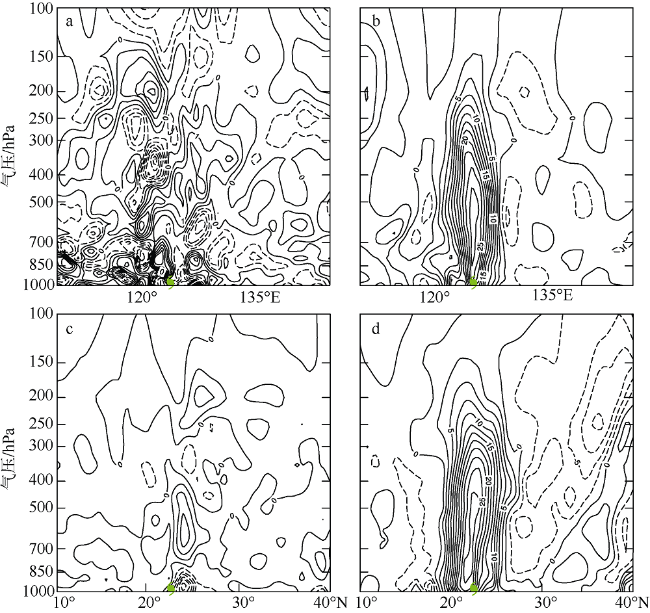
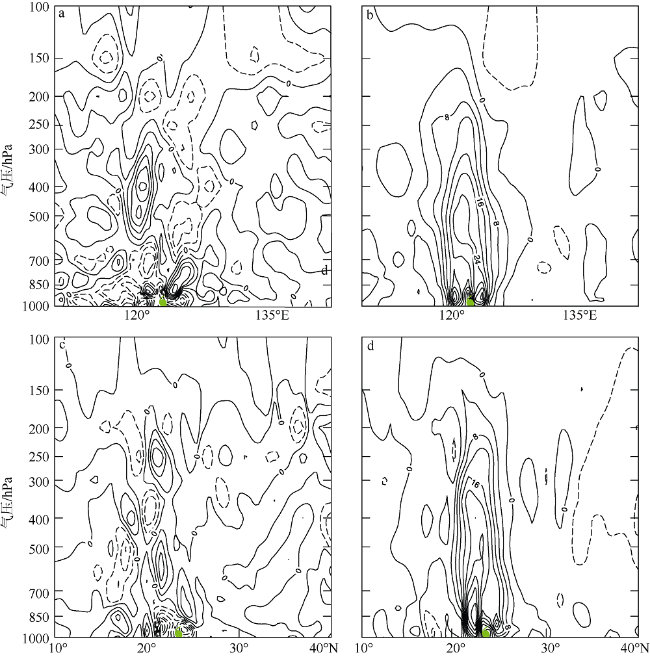
图7 “洛坦”在2004年10月24日18时(即异常偏折前12h)的东西向(a、b)及南北向(c、d)的散度距平(a、c, 单位:10-5s-1)和涡度距平(b、d, 单位:10-5s-1)的垂直剖面绿色台风标志为台风所在位置, 实线为正值, 虚线为负值 Fig. 7 Vertical cross sections of divergence anomaly (a, c; units:10-5s-1) and vorticity anomaly(b, d; units: 10-5s-1) of Nock-ten at 1800 UTC 24 October 2004 (12 hours before unusual turning) along longitude (a, b) and latitude (c, d) where the TC was located. Green symbol represents the location of the typhoon, solid contour represents positive values, and dashed contour represents negative values |
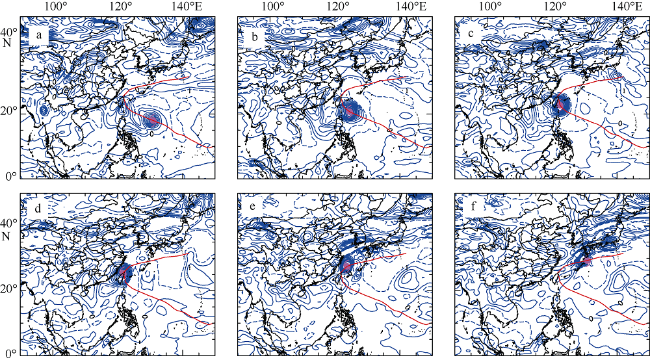
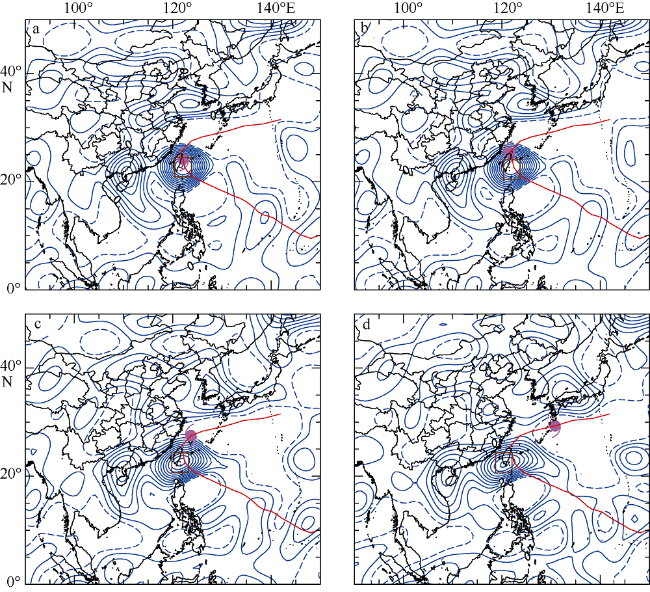
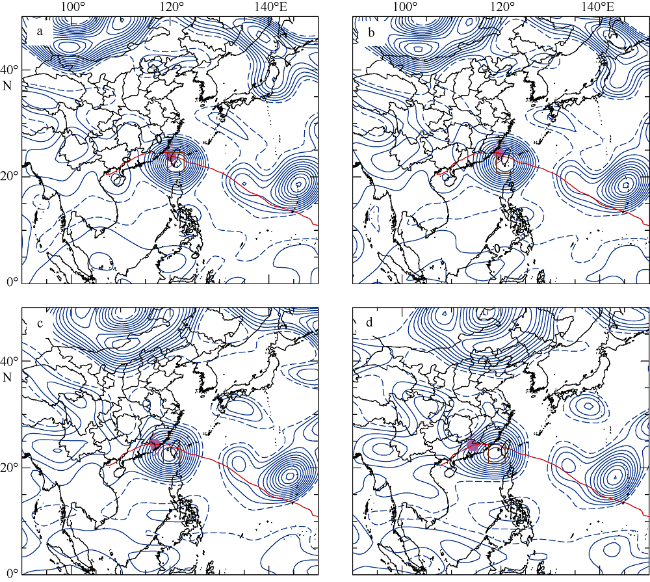
图8 “洛坦”异常偏折过程中700hPa的涡度扰动(10-5s-1)分布a. 异常偏折前48h; b. 异常偏折前24h; c. 异常偏折前12h; d. 异常偏折时刻; e. 异常偏折后12h; f. 异常偏折后24h。红线为台风的移动路径, 粉色符号为对应时刻台风中心的位置,实线为正值,虚线为负值 Fig. 8 Vorticity anomaly of Nock-ten (10-5s-1) at 700 hPa during the unusual turning. a) 48 hours before unusual turning time; b) 24 hours before unusual turning time; c) 12 hours before unusual turning time; d) at the unusual turning time; e) 12 hours after unusual turning time; f) 24 hours after unusual turning time. The red lines is the track of Typhoon Nock-ten, and the pink marker represents the location of Nock-ten. The solid lines are positive, and the dashed lines are negative |
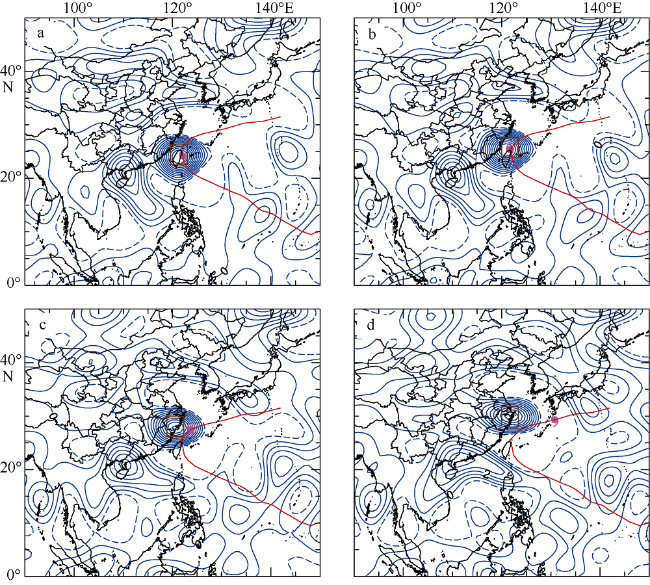
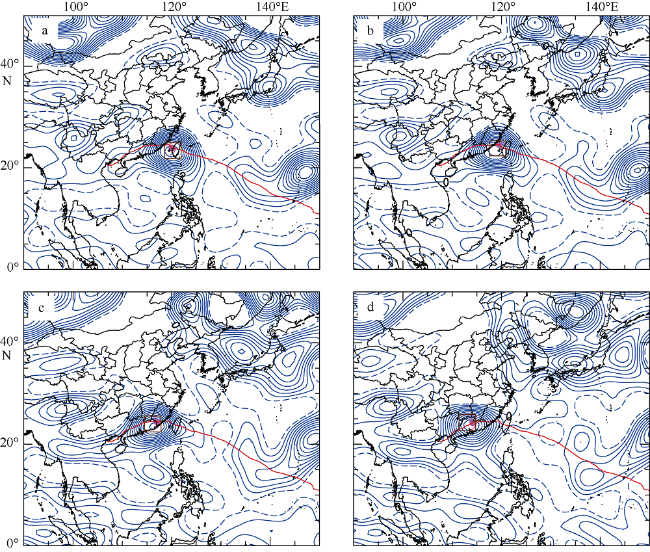
图9 9215号台风“奥玛”以2004年10月24日18时为初始时刻利用CBAM对其他时刻的涡度扰动(单位: 10-5s-1)预报a. 10月25日0时; b. 10月25日6时; c. 10月25日18时; d. 10月26日06时。粉色符号代表在对应时刻台风中心的实际位置, 棕色方框为对应时刻预测的“洛坦”涡旋中心位置, 红线代表台风实际的路径,实线表示涡度扰动为正,虚线表示涡度扰动为负 Fig. 9 Prediction of vorticity anomaly of Orma (10-5s-1) starting from 1800 UTC 24 October 2004 using CBAM. a) 0000 UTC 25, b) 0600 UTC25, c) 1800 UTC 25, and d) 0600 UTC 26. The brown box indicates the predicting location of the typhoon vortex. The typhoon track and its current location are indicated by the red solid curve and the pink symbol, respectively.The solid line indicates that vorticity anomaly is positive, while the broken line indicates negative. |
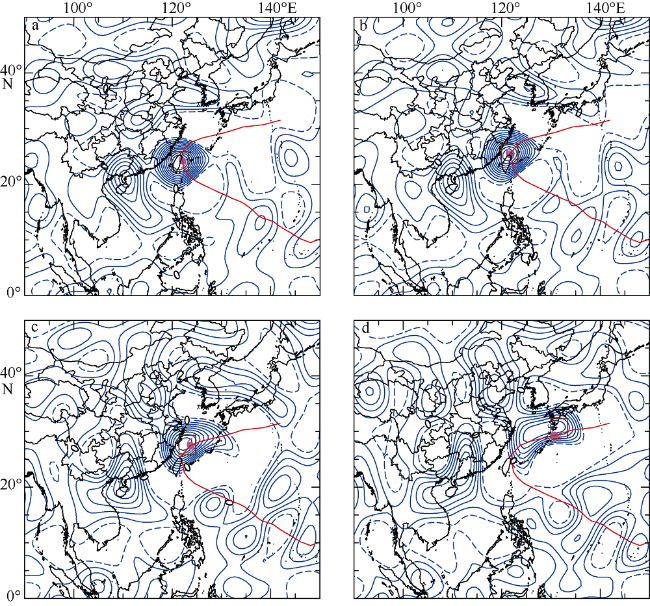
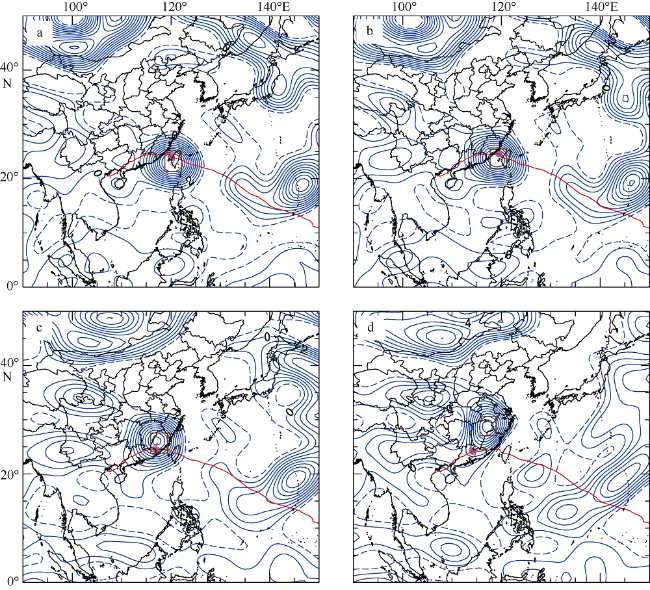
图14 9215号台风“奥玛”以1992年9月4日12时为初始时刻利用CBAM对其他时刻涡度扰动预报a. 9月4日18时; b. 9月5日0时; c. 9月5日12时; d. 9月6日0时。其他同 Fig. 14 Predictions of vorticity anomaly of Orma starting from 1200 UTC 4 October 2004 using the CBAM model. a) 1800 UTC 4 September, b) 0000 UTC 5 September, c)1200 UTC 5 September, and d) 0000 UTC 6 September. The others are the same as those in |
| [1] |
陈联寿, 徐祥德, 罗哲贤 , 2002. 热带气旋异常运动引论[C]. 北京:中国气象学会第25次全国会员代表大会暨学术年会.
|
| [2] |
董贞花, 谭季青 , 2010. 台风"麦莎"两次东折成因的诊断分析[J]. 科技通报, 26(6):821-827.
|
| [3] |
段晶晶, 吴立广, 倪钟萍 , 2014. 2004年台风“艾利”与“米雷”路径异常变化分析[J]. 气象学报, 72(1):1-11.
|
| [4] |
黎爱兵, 张立凤, 臧增亮 , 等, 2012. 有限区域流函数和速度势的计算及其在台风中应用[J]. 气象科学, 32(1):1-8.
|
| [5] |
罗霞, 费建芳, 黄小刚 , 等, 2013. 西北太平洋热带气旋反转型路径的统计特征及形成机制研究[C]//第30届中国气象学会年会. 南京: 中国气象学会.
|
| [6] |
麻素红, 吴俞, 瞿安祥 , 等, 2012. T213与T639模式热带气旋预报误差对比[J]. 应用气象学报, 23(2):167-173.
|
| [7] |
钱维宏, 张广文, 黄静 , 2015. 不同资料大气扰动分量对2010年台风鲇鱼强度变化的描述[J]. 气象, 41(7):806-815.
|
| [8] |
钱维宏, 蒋宁, 杜钧 , 2016. 中国东部7类暴雨异常环流型[J]. 气象, 42(6):674-685.
|
| [9] |
王敏 , 2018. 西北太平洋热带气旋路径异常偏折的区域及环流动力相关特征研究[D]. 北京: 中国气象科学研究院.
|
| [10] |
王敏, 徐祥德, 李英 , 2019. 西北太平洋热带气旋路径异常偏折的分类特征[J]. 热带气象学报, 35(2):177-186.
|
| [11] |
魏新, 王力群, 李海宁 , 等, 2014. 环流场及结构变化对1214热带气旋“天秤”西折路径影响[J]. 海洋预报, 31(3):72-79.
|
| [12] |
许娈 , 2013. 2010年西北太平洋超强台风“凡亚比”和“鲇鱼”的诊断与模拟研究[D]. 南京: 南京信息工程大学.
|
| [13] |
徐祥德, 解以扬, 李培彦 , 1994. 阻塞结构对近海台风异常路径影响的数值试验[J]. 应用气象学报, 5(1):104-108.
|
| [14] |
许映龙, 张玲, 高拴柱 , 2010. 我国台风预报业务的现状及思考[J]. 气象, 36(7):43-49.
|
| [15] |
许映龙 , 2011. 超强台风鲇鱼路径北翘预报分析[J]. 气象, 37(7):821-826.
|
| [16] |
张定媛, 田晓阳, 贾朋群 , 2018. 热带气旋预报性能及指标综合评述[J]. 气象, 44(12):1628-1634.
|
| [17] |
张胜军, 陈联寿, 徐祥德 , 2005. Helen台风(9505)异常路径的诊断分析与数值模拟[J]. 大气科学, 29(6):937-946.
|
| [18] |
|
| [19] |
|
| [20] |
|
| [21] |
|
| [22] |
|
| [23] |
|
| [24] |
|
| [25] |
|
| [26] |
|
| [27] |
|
| [28] |
|
/
| 〈 |
|
〉 |

