
Journal of Tropical Oceanography >
Detection algorithm of internal waves in the South China Sea based on boundary characteristics of remote sensing image
Copy editor: LIN Qiang
Received date: 2019-11-23
Request revised date: 2020-01-22
Online published: 2020-02-10
Supported by
National Natural Science Foundation of China(51679132)
National Natural Science Foundation of China(51079082)
Capacity Construction Project of Local University Base of Shanghai Science and Technology Commission(17040501600)
Copyright
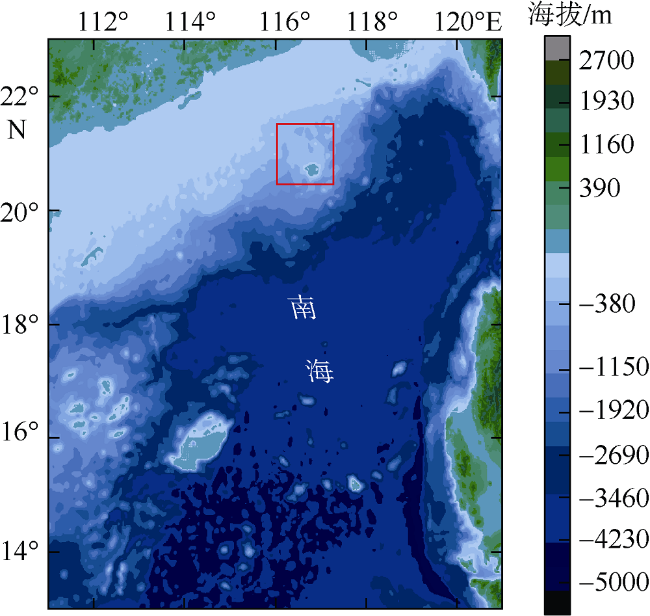
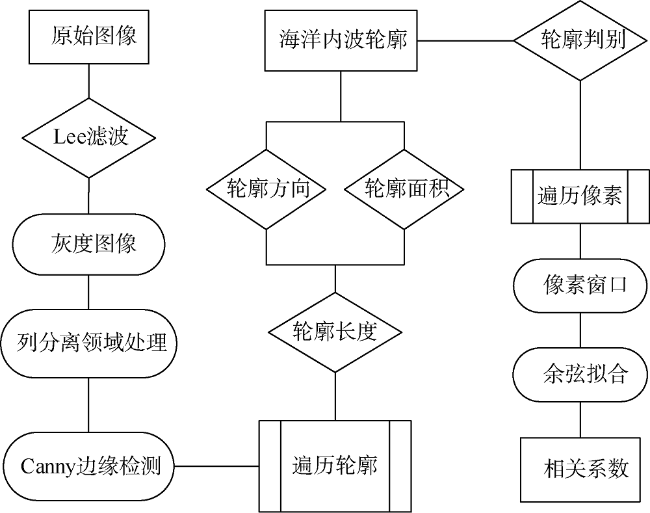
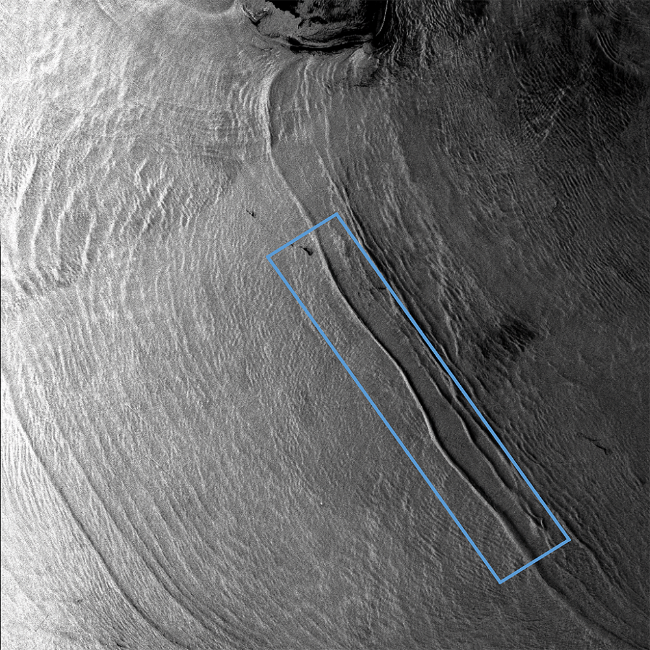
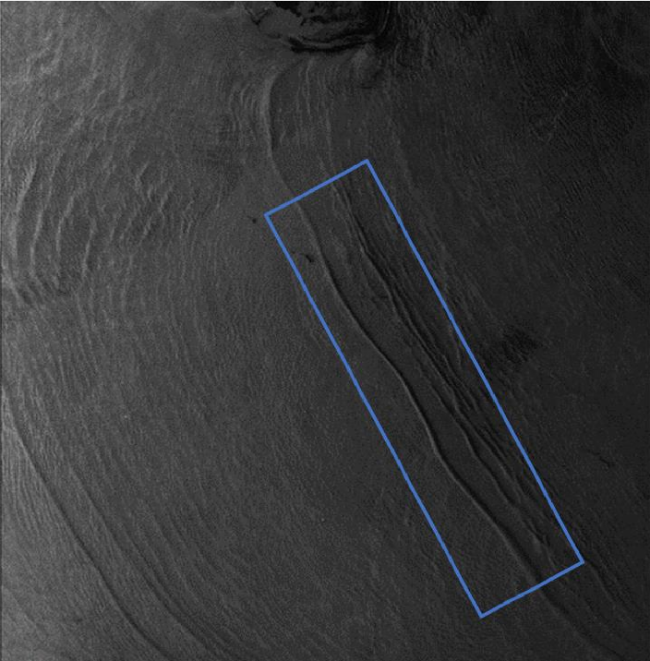
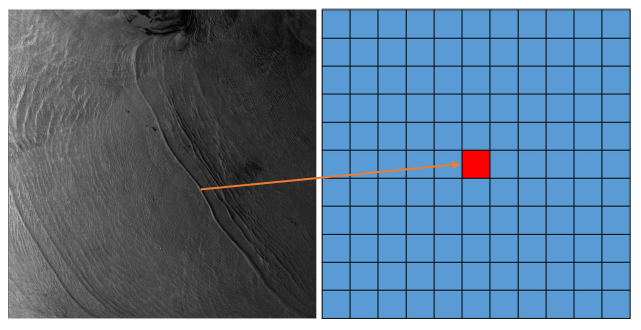
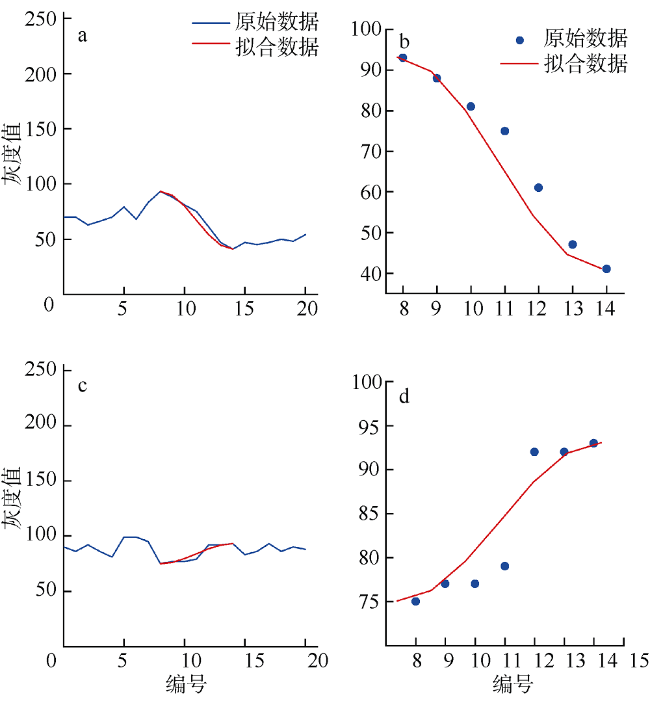
Ocean internal waves play an important role in the activities of ocean. The study of ocean internal waves is of great significance to theoretical research of marine science, the protection, development and utilization of marine resources, and maritime military in China. In order to find the location of ocean internal waves in time and quantitatively analyze the parameters of ocean internal waves, an integrated detection algorithm is proposed on the basis of the boundary characteristics of light and dark stripes of ocean internal waves in Synthetic Aperture Radar (SAR) images. The stripes are detected through the process of column separation neighborhood and the edge detection algorithm of Canny operator, and selected by the use of the three features of ocean internal waves including contour length, area ratio, and propagation direction. The algorithm is applied to several internal waves in the South China Sea to verify its robustness and applicability. The results show that the proposed algorithm can effectively identify the light and dark stripes of ocean internal waves, and can remove not only the contour of the non-internal wave stripes but also the small and unobvious stripes contours of internal waves. The detected stripes are fitted pixel by pixel with cosine function, and the locations of the light and dark stripes and the distance between the light and dark stripes are found based on the fitted results. The location of the internal waves is thus determined.
ZHENG Yinggang , ZHANG Hongsheng , LI Xiaolian , ZHANG Zhouhao . Detection algorithm of internal waves in the South China Sea based on boundary characteristics of remote sensing image[J]. Journal of Tropical Oceanography, 2020 , 39(6) : 41 -56 . DOI: 10.11978/2019120
表1 不同窗口下的列分离邻域参数表Tab. 1 Column separated neighborhood parameters under different windows |
| 均值 | 方差 | 等效 视数 | 运行时间/s | |
|---|---|---|---|---|
| 原始图像 | 57.81 | 376.75 | 8.87 | 10.61 |
| 窗口2×2 | 17.46 | 68.56 | 4.45 | 52.49 |
| 窗口5×5 | 44.75 | 359.10 | 5.58 | 18.15 |
| 窗口8×8 | 54.74 | 495.51 | 6.05 | 14.01 |
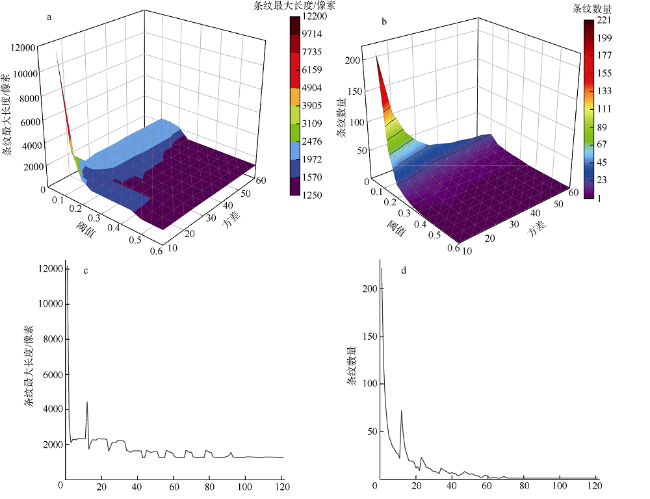
图7 不同阈值和方差下检测的条纹数量和长度对比图a. 条纹最大长度3D分布关系图; b. 条纹数量3D分布关系图; c. 条纹最大长度变化关系图; d. 条纹数量变化关系图; c、d横坐标为阈值与方差的组合, 共计121种 Fig. 7 Comparison of numbers and lengths of the detected stripes under different thresholds and variances: a) 3D distribution of maximum stripe length; b) 3D distribution of the number of stripes; c) variation of the maximum length of stripes; and d) variation of the number of stripes |
表2 直线拟合参数统计表Tab. 2 Statistical parameters of fitted lines |
| $k$ | ${{x}_{0}}$ | ${{y}_{0}}$ |
|---|---|---|
| 1.61 | 114.17 | 808.82 |
| 1.44 | 736.52 | 684.87 |
| -5.33 | 66.95 | 337.77 |
| 1.69 | 601.60 | 528.59 |
表3 皮尔逊系数及相关性Tab. 3 Pearson correlation coefficient |
| 皮尔逊系数 | 相关性 |
|---|---|
| 0.8~1.0 | 极强相关 |
| 0.6~0.8 | 强相关 |
| 0.4~0.6 | 中等程度相关 |
| 0.2~0.4 | 弱相关 |
| 0~0.2 | 极弱相关或无相关 |
表5 海洋SAR图像信息表Tab. 5 Information of SAR ocean images |
| 样本 | 像素 | 发生时间 | 中心经纬度 | 经纬度范围 |
|---|---|---|---|---|
| A | 8415×9558 | 2005-05-09, 02:16 | 21°45′N, 116°28′E | 21°06′—22°18′N, 115°52′—117°05′E |
| B | 7913×8647 | 2002-06-24, 02:45 | 20°57′N, 116°13′E | 20°21′—21°26′N, 115°40′—116°47′E |
| C | 8395×9813 | 2007-09-12, 02:13 | 21°16′N, 117°06′E | 20°37′—21°54′N, 116°29′—117°28′E |
| D | 4899×6121 | 2005-08-22, 02:45 | 21°21′N, 116°18′E | 20°43′—21°59′N, 115°45′—116°55′E |
| E | 6649×9830 | 2009-06-12, 02:31 | 20°28′N, 112°30′E | 19°51′—20°05′N, 112°01′—113°01′E |
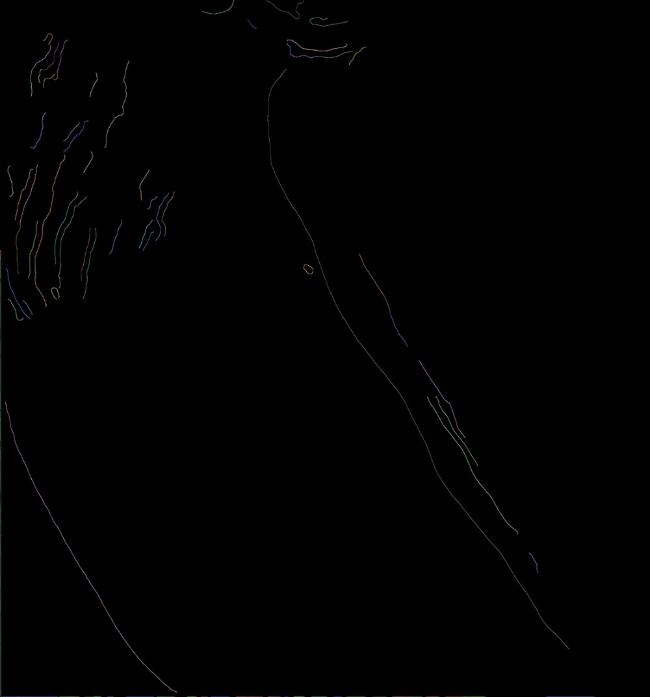
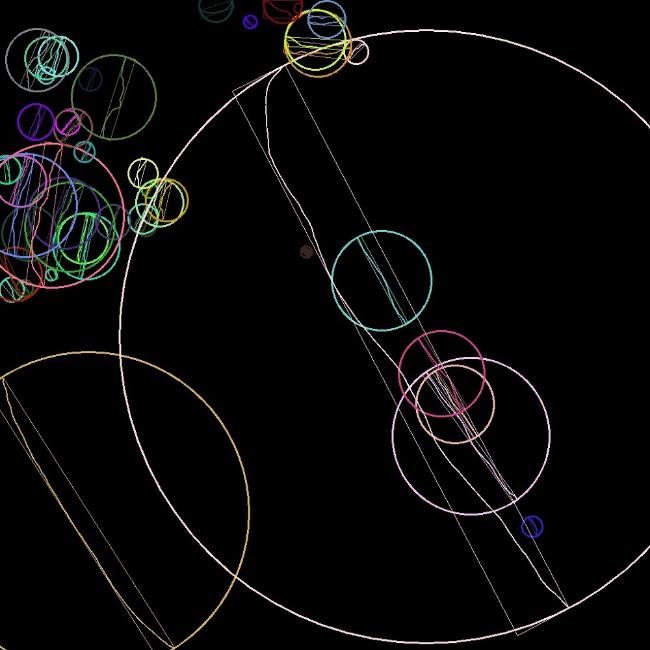
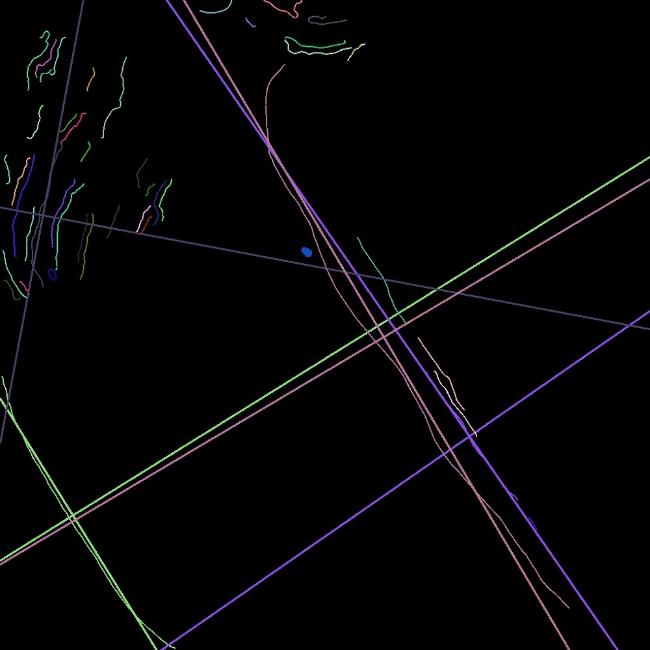
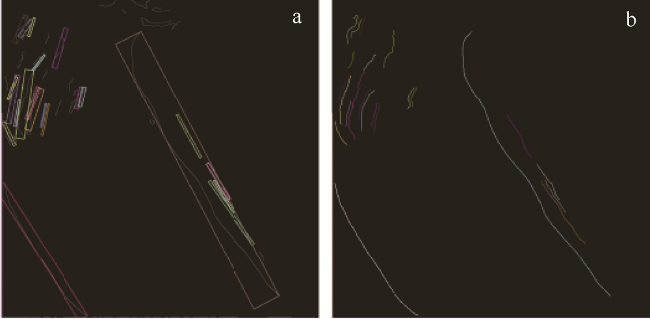
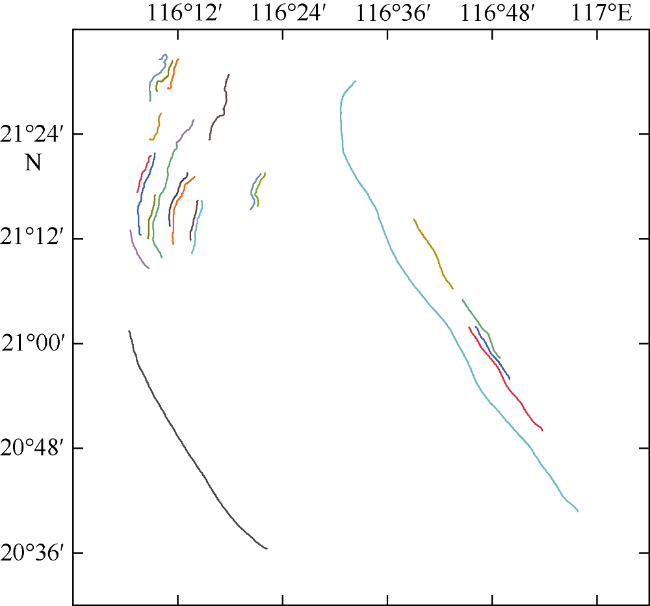
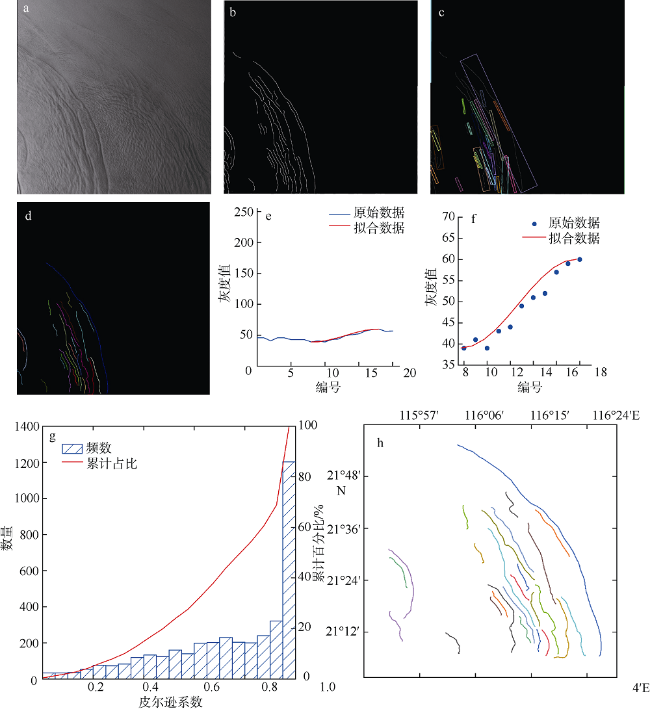
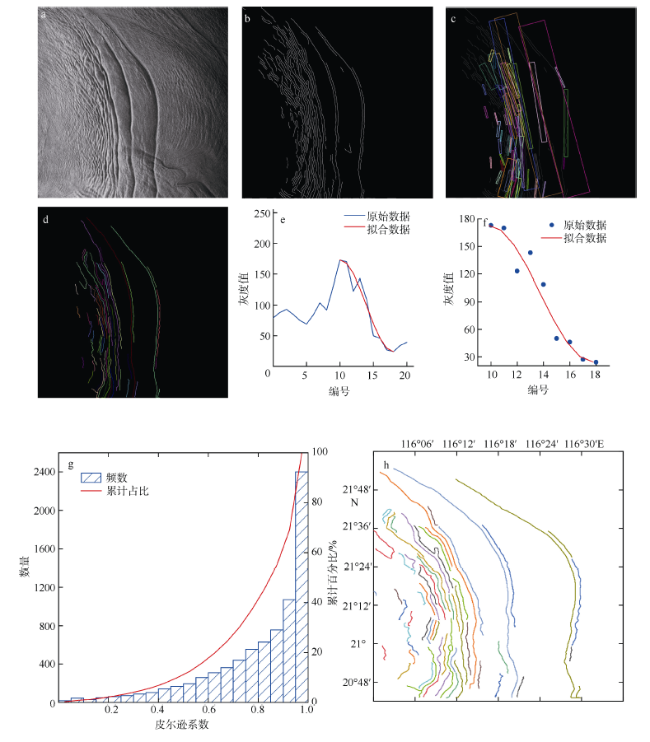
图18 内波A条纹识别图a. 列分离邻域处理图像; b. Canny处理图像; c. 条纹检测图; d. 条纹识别图; e. 明暗条纹拟合图; f. 明暗条纹提取图; g. 皮尔逊系数分布图; h. 条纹经纬度提取图 Fig. 18 Recognition of stripes in internal wave A. a) column separation neighborhood processing; b) Canny processing; C) stripe detection; d) stripe recognition; e) fitting of light and dark stripes; f) extraction of light and dark stripes; g) distribution of Pearson correlation coefficient; and h) extraction of longitude and latitude of each stripe |
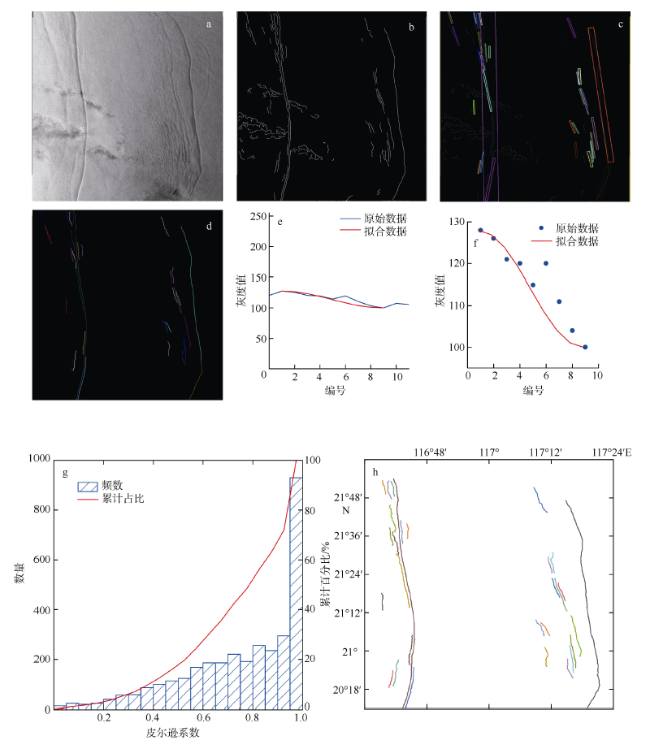
图19 内波B条纹识别图a. 列分离邻域处理图像; b. Canny处理图像; c. 条纹检测图; d. 条纹识别图; e. 明暗条纹拟合图; f. 明暗条纹提取图; g. 皮尔逊系数分布图; h. 条纹经纬度提取图 Fig. 19 Same as |
图20 内波C条纹识别图a. 列分离邻域处理图像; b. Canny处理图像; c. 条纹检测图; d. 条纹识别图; e. 明暗条纹拟合图; f. 明暗条纹提取图; g. 皮尔逊系数分布图; h. 条纹经纬度提取图 Fig. 20 Same as |
图21 内波D条纹识别图a. 列分离邻域处理图像; b. Canny处理图像; c. 条纹检测图; d. 条纹识别图; e. 明暗条纹拟合图; f. 明暗条纹提取图; g. 皮尔逊系数分布图; h.条纹经纬度提取图 Fig. 21 Same as |
图22 内波E条纹识别图a. 列分离邻域处理图像; b. Canny处理图像; c. 条纹检测图; d. 条纹识别图; e. 明暗条纹拟合图; f. 明暗条纹提取图; g. 皮尔逊系数分布图; h. 条纹经纬度提取图 Fig. 22 Same as |
表6 样本皮尔逊系数统计表Tab. 6 Statistics of Pearson correlation coefficient |
| 样本数 | >0.5 | >0.6 | >0.7 | >0.8 | >0.9 |
|---|---|---|---|---|---|
| 4858 | 80.2% | 72.4% | 62.1% | 50.8% | 39.4% |
| 8380 | 89.7% | 84.6% | 77.0% | 66.3% | 49.8% |
| 3966 | 84.1% | 75.3% | 64.1% | 51.7% | 36.9% |
| 9443 | 90.1% | 84.4% | 75.8% | 63.0% | 45.1% |
| 2862 | 78.5% | 68.7% | 58.4% | 48.2% | 38.7% |
| [1] |
曹锦涛, 2017. 星载合成孔径雷达对海内波检测与参数估计[D]. 哈尔滨: 哈尔滨工业大学.
|
| [2] |
陈捷, 陈标, 许素芹, 2009. 一种新的SAR图像内波检测与参数估计方法[J]. 中国图象图形学报, 14(1):40-44.
|
| [3] |
陈捷, 陈标, 许素芹, 2010. 基于二维连续小波变换的SAR图像海洋现象特征检测[J]. 电子学报, 38(9):2128-2133.
|
| [4] |
陈捷, 陈标, 陶荣华, 等, 2014. SAR图像海洋内波参数自动提取方法[J]. 海洋技术学报, 33(6):20-27.
|
| [5] |
丁灿, 张本涛, 高国兴, 等, 2012. 合成孔径雷达图像中海洋内波的特征检测[J]. 海洋测绘, 32(5):15-18.
|
| [6] |
段锁林, 殷聪聪, 李大伟, 2018. 改进的自适应Canny边缘检测算法[J]. 计算机工程与设计, 39(6):1645-1652.
|
| [7] |
范开国, 黄韦艮, 甘锡林, 等, 2010. SAR海洋内波表层流反演方法探讨[J]. 遥感学报, 14(1):122-130.
|
| [8] |
范开国, 周晓中, 徐青 , 等, 2017. 合成孔径雷达海洋内波遥感探测技术与应用[M]. 北京: 海洋出版社: 2-3.
|
| [9] |
甘锡林, 黄韦艮, 杨劲松, 等, 2007. 基于希尔伯特-黄变换的合成孔径雷达内波参数提取新方法[J]. 遥感学报, 11(1):39-47.
|
| [10] |
郎丰铠, 杨杰, 李德仁, 2014. 极化SAR图像自适应增强Lee滤波算法[J]. 测绘学报, 43(7):690-697.
|
| [11] |
李海艳, 杜涛, 2005. 两层模式下内波K-dv方程的频散关系[J]. 水动力学研究与进展, 20(5):673-679.
|
| [12] |
李海艳, 何宜军, 杜涛, 等, 2007. 从内波SAR图像中提取跃层深度和内波振幅的非线性方法[J]. 海洋环境科学, 26(6):583-586, 590.
|
| [13] |
郦苏丹, 李广侠, 2006. 结合多尺度边缘检测的SAR结构邻域滤波方法[J]. 电子与信息学报, 28(8):1480-1484.
|
| [14] |
林珲, 范开国, 申辉, 等, 2010. 星载SAR海洋内波遥感研究进展[J]. 地球物理学进展, 25(3):1081-1091.
|
| [15] |
刘冰清, 2015. 南海北部内波时空传播特征的遥感研究[D]. 上海: 上海海洋大学.
|
| [16] |
刘成龙, 2017. Matlab图像处理[M]. 北京: 清华大学出版社: 189-190.
|
| [17] |
申辉, 2005. 海洋内波的遥感与数值模拟研究[D]. 青岛: 中国科学院海洋研究所.
|
| [18] |
石爽, 曲仕茹, 何力, 2011. 一种新的边界跟踪算法[J]. 工程图学学报, 32(3):52-56.
|
| [19] |
汪雄良, 王春玲, 朱炬波, 等, 2012. 基于EEMD的SAR海洋内波参数反演[J]. 测试技术学报, 26(1):1-8.
|
| [20] |
张祥, 邓喀中, 范洪冬, 2011. 融合Canny边缘检测技术的SAR图像改进滤波方法[J]. 黑龙江工程学院学报(自然科学版), 25(2):6-9, 38.
|
| [21] |
|
| [22] |
|
| [23] |
|
| [24] |
|
| [25] |
|
| [26] |
|
| [27] |
|
/
| 〈 |
|
〉 |


