
Journal of Tropical Oceanography ›› 2023, Vol. 42 ›› Issue (3): 52-66.doi: 10.11978/2022141CSTR: 32234.14.2022141
Special Issue: 全球变化专题
• Marine Hydrology • Previous Articles Next Articles
The characteristics of eddy in western boundary current of South China Sea and its relationship with winter circulation
LIU Qinyan1,2( ), LI Wenlian1,3, SHI Rui1, CHEN Ju1, LI Chunhui4, XIE Qiang5
- 1. South China Sea Institute of Oceanology, Chinese Academy of Sciences, Guangzhou 510301, China
2. Southern Marine Science and Engineering Guangdong Laboratory (Guangzhou), Guangzhou 511458, China
3. University of Chinese Academy of Sciences, Beijing 100049, China
4. Guangzhou Institute of Tropical and Marine Meteorology, China Meteorological Administration, Guangzhou 510640
5. Institute of Deep-Sea Science and Engineering, Chinese Academy of Sciences, Sanya 572000, China
-
Received:2022-06-22Revised:2022-08-25Online:2023-05-10Published:2022-09-07 -
Supported by:Science and Technology Basic Resources Investigation Program of China(2017FY201402); National Natural Science Foundation of China(41576012); National Natural Science Foundation of China(41876017); National Natural Science Foundation of China(42176027)
Cite this article
LIU Qinyan, LI Wenlian, SHI Rui, CHEN Ju, LI Chunhui, XIE Qiang. The characteristics of eddy in western boundary current of South China Sea and its relationship with winter circulation[J].Journal of Tropical Oceanography, 2023, 42(3): 52-66.
share this article
Add to citation manager EndNote|Reference Manager|ProCite|BibTeX|RefWorks
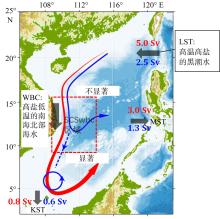
Fig. 1
Schematic diagram of two types of winter circulation in the SCS. The red line represents "U" pattern, the blue line represents "O" pattern, and the grey arrows indicate the transport of the Luzon Strait (LST), Mindoro Strait (MST), and Karimata Strait (KST). The red dotted box represents the research area. Modified from Zu et al (2019)"
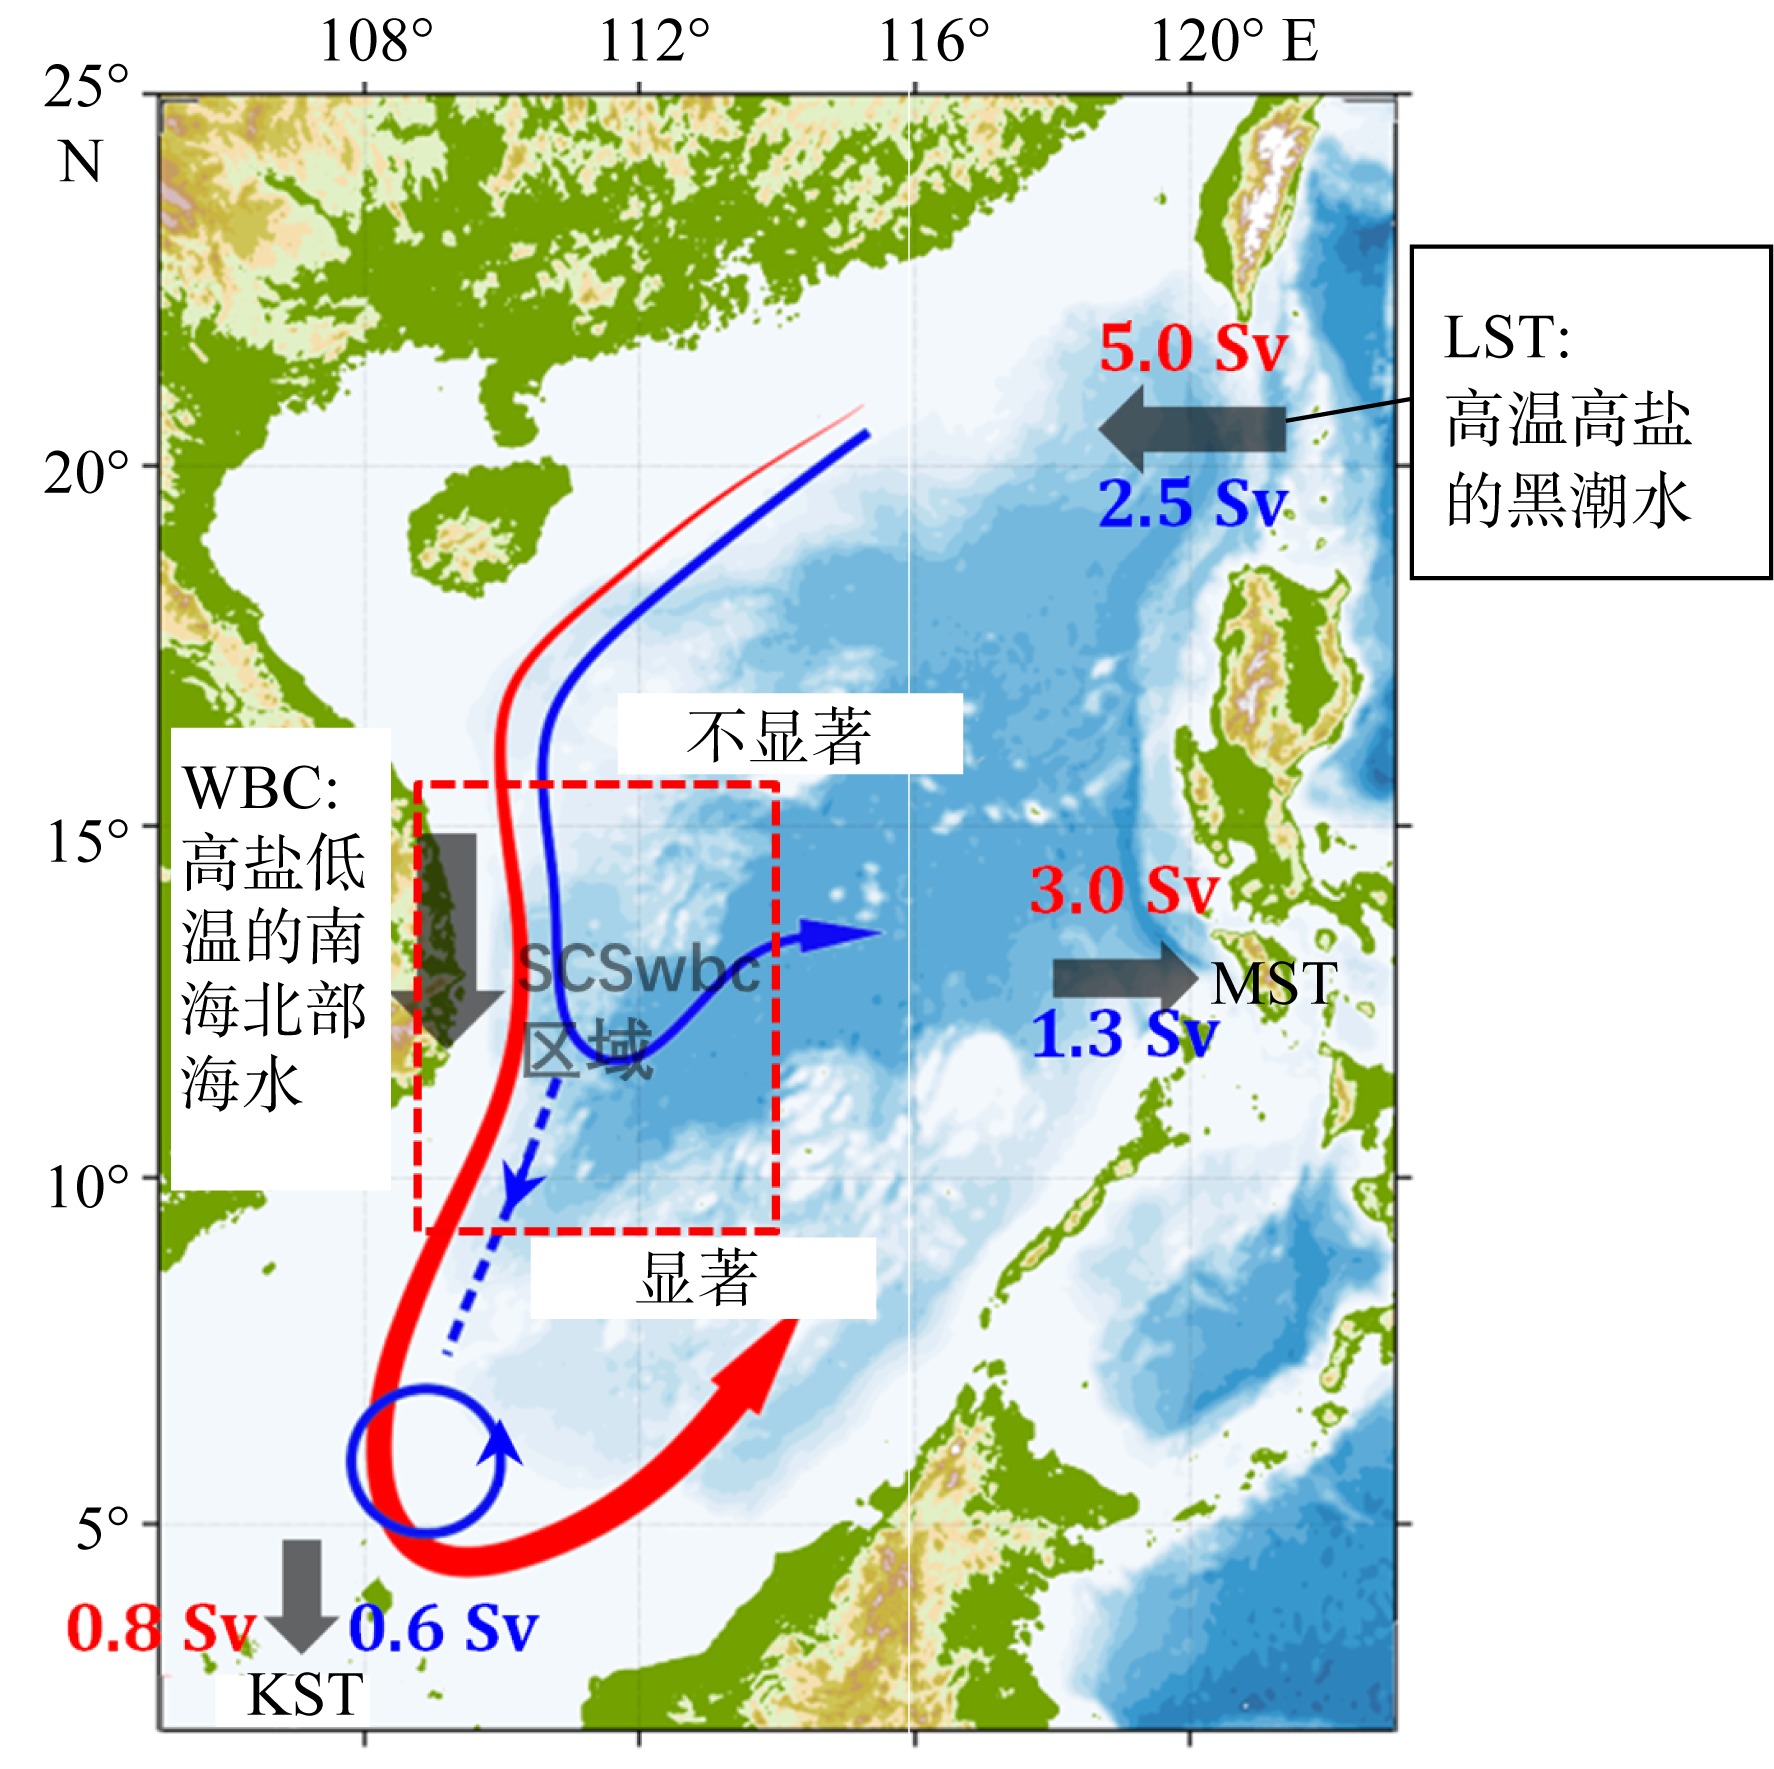
Fig. 1
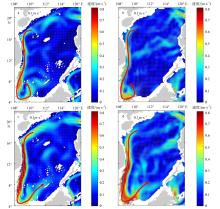
Fig. 2
The horizontal distribution of upper layer current from OFES outputs (a, c) and geostrophic current from AVISO data (b, d). (a) and (c) are the horizontal distribution of the upper layer calculated by OFES data(averaged in upper 241m), where (a)/(c) represents the distribution of "O"/"U" years. (b) and (d) are the same as (a) and (c) but for AVISO data. The gray arrow represents the velocity vector, the color shedding represents the absolute velocity, and the red bold arrow represents the movement of the western boundary current"

Fig. 2
Tab. 1
Statistical characteristics of eddy in SCS and the SCSwbc region"
| 涡旋特征 | CE | AE | All | |||
|---|---|---|---|---|---|---|
| WSCS | SCS | WSCS | SCS | WSCS | SCS | |
| 个数 | 16046 | 67156 | 12502 | 60861 | 28548 | 128017 |
| 生成 | 289 | 1217 | 202 | 1058 | 491 | 2275 |
| 消亡 | 319 | 1306 | 281 | 1204 | 600 | 2510 |
| 振幅/m | 0.039 | 0.028 | 0.032 | 0.027 | 0.036 | 0.028 |
| 半径/km | 84.87 | 68.90 | 80.81 | 70.01 | 82.84 | 69.46 |
| 旋转速度/(m·s-1) | 0.278 | 0.203 | 0.240 | 0.191 | 0.259 | 0.197 |
Tab. 1
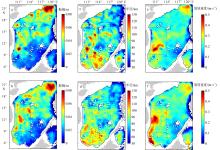
Fig. 3
Horizontal distribution of climatology statistic features of eddy in South China Sea. (a, c, e) AE; (b, d, f) CE. The red dotted box is the study area, and the solid black lines represent the isobath of 400m"

Fig. 3
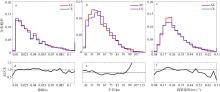
Fig. 4
Histogram distribution and the ratio of anticyclonic to cyclonic eddies of eddy amplitude (a, d), radius (b, e) and rotation speed (c, f) in the SCSwbc area"

Fig. 4
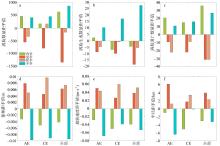
Fig. 5
The histogram distribution of the statistical features of eddy in four seasons. a. the number of eddy occurrence; b. the number of eddy genesis; c. the number of eddy dissipation; d. amplitude; e. rotation speed; f. radius. The green column represents spring (February to April), the orange column represents summer (May to July), the yellow column represents autumn (August to October), and the blue column represents winter (November to January)"
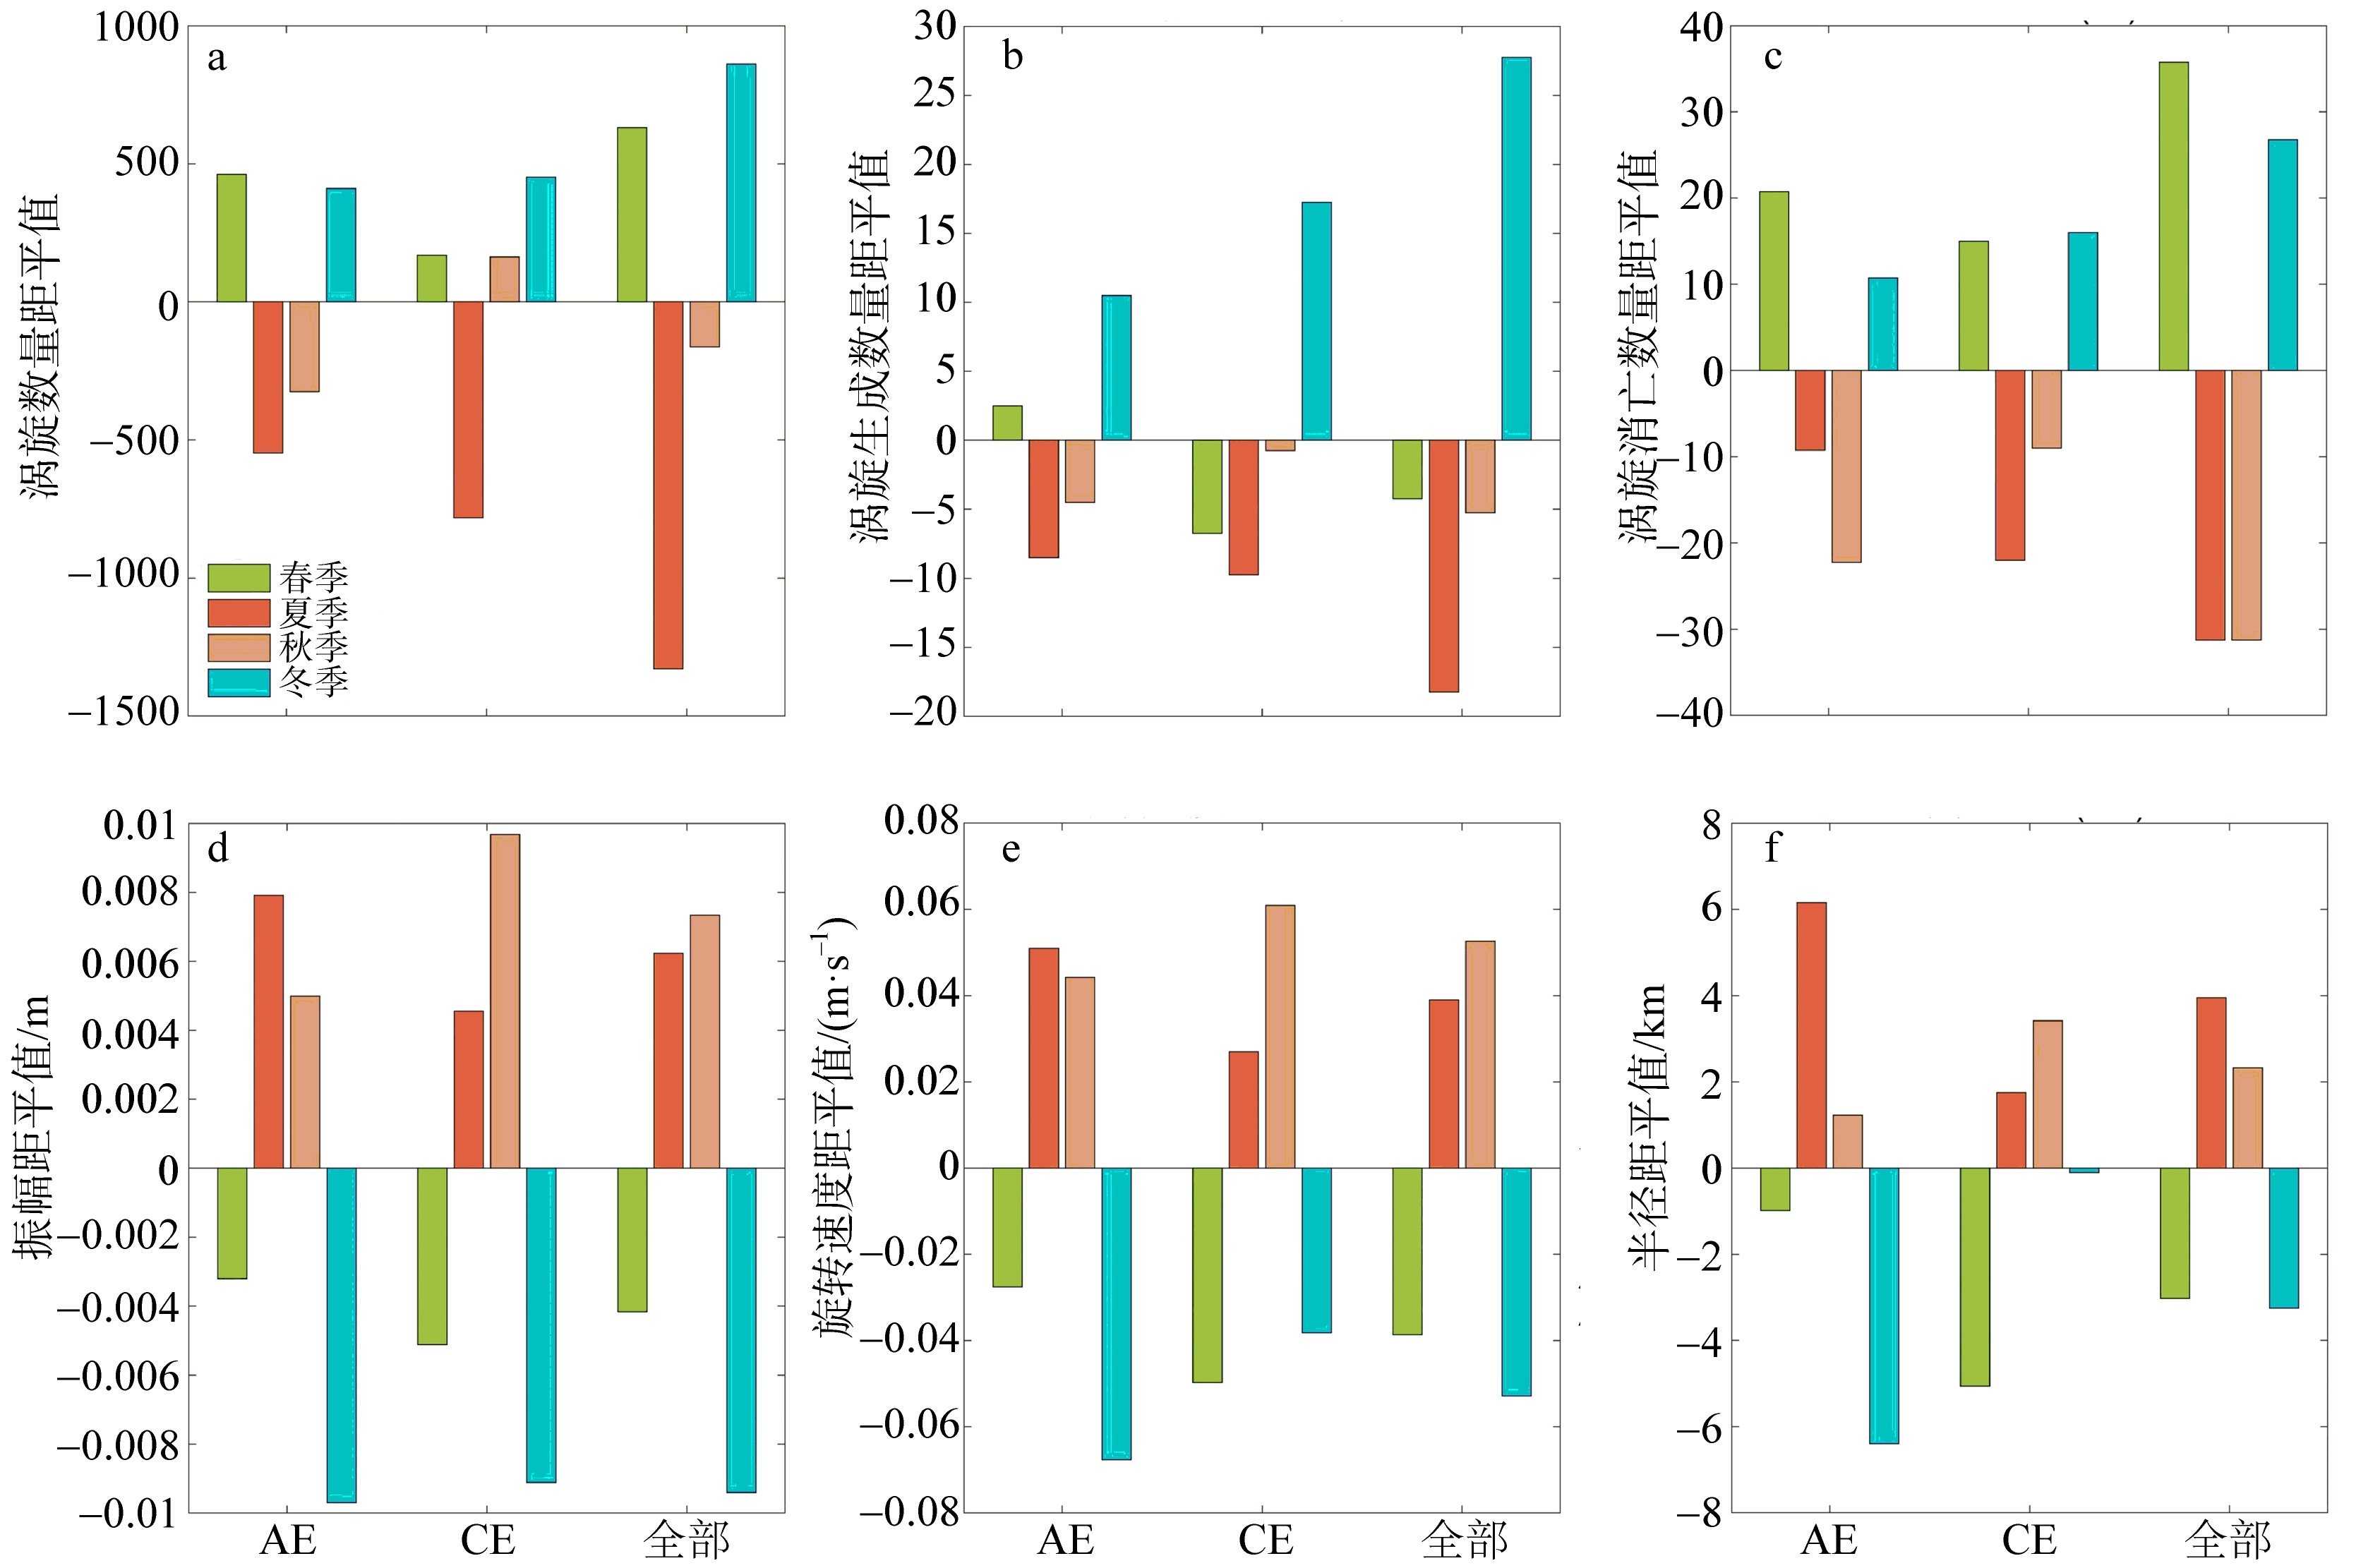
Fig. 5
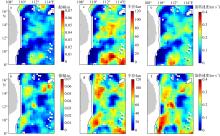
Fig. 6
Horizontal distribution of eddy’s statistical features in winter. (a) amplitude of AE; (c) radius; (e) rotation speed of AE; (b, d, f) are the same as (a, c, e) but for CE. The solid black lines represent the isobath of 400m"

Fig. 6
Tab. 2
Statistical characteristics of eddy in the SCSwbc area in “U”/“O” patterns"
| 涡旋统计特征 | CE | AE | 全部 | |||
|---|---|---|---|---|---|---|
| O | U | O | U | O | U | |
| 个数 | 875 | 874 | 686 | 912 | 781 | 893 |
| 生成 | 21 | 19 | 13 | 15 | 17 | 17 |
| 消亡 | 21 | 17 | 14 | 17 | 18 | 17 |
| 振幅/m | 0.028 | 0.029 | 0.026 | 0.025 | 0.027 | 0.027 |
| 半径/km | 75.26 | 74.00 | 75.03 | 72.32 | 75.14 | 73.16 |
| 旋转速度/(m·s-1) | 0.233 | 0.244 | 0.192 | 0.203 | 0.212 | 0.224 |
Tab. 2
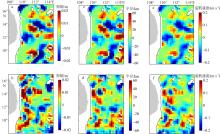
Fig. 7
The difference of statistic features of AE (a, c, e) and CE (b, d, f) between “O” and “U” pattern (“O” minus “U”)"
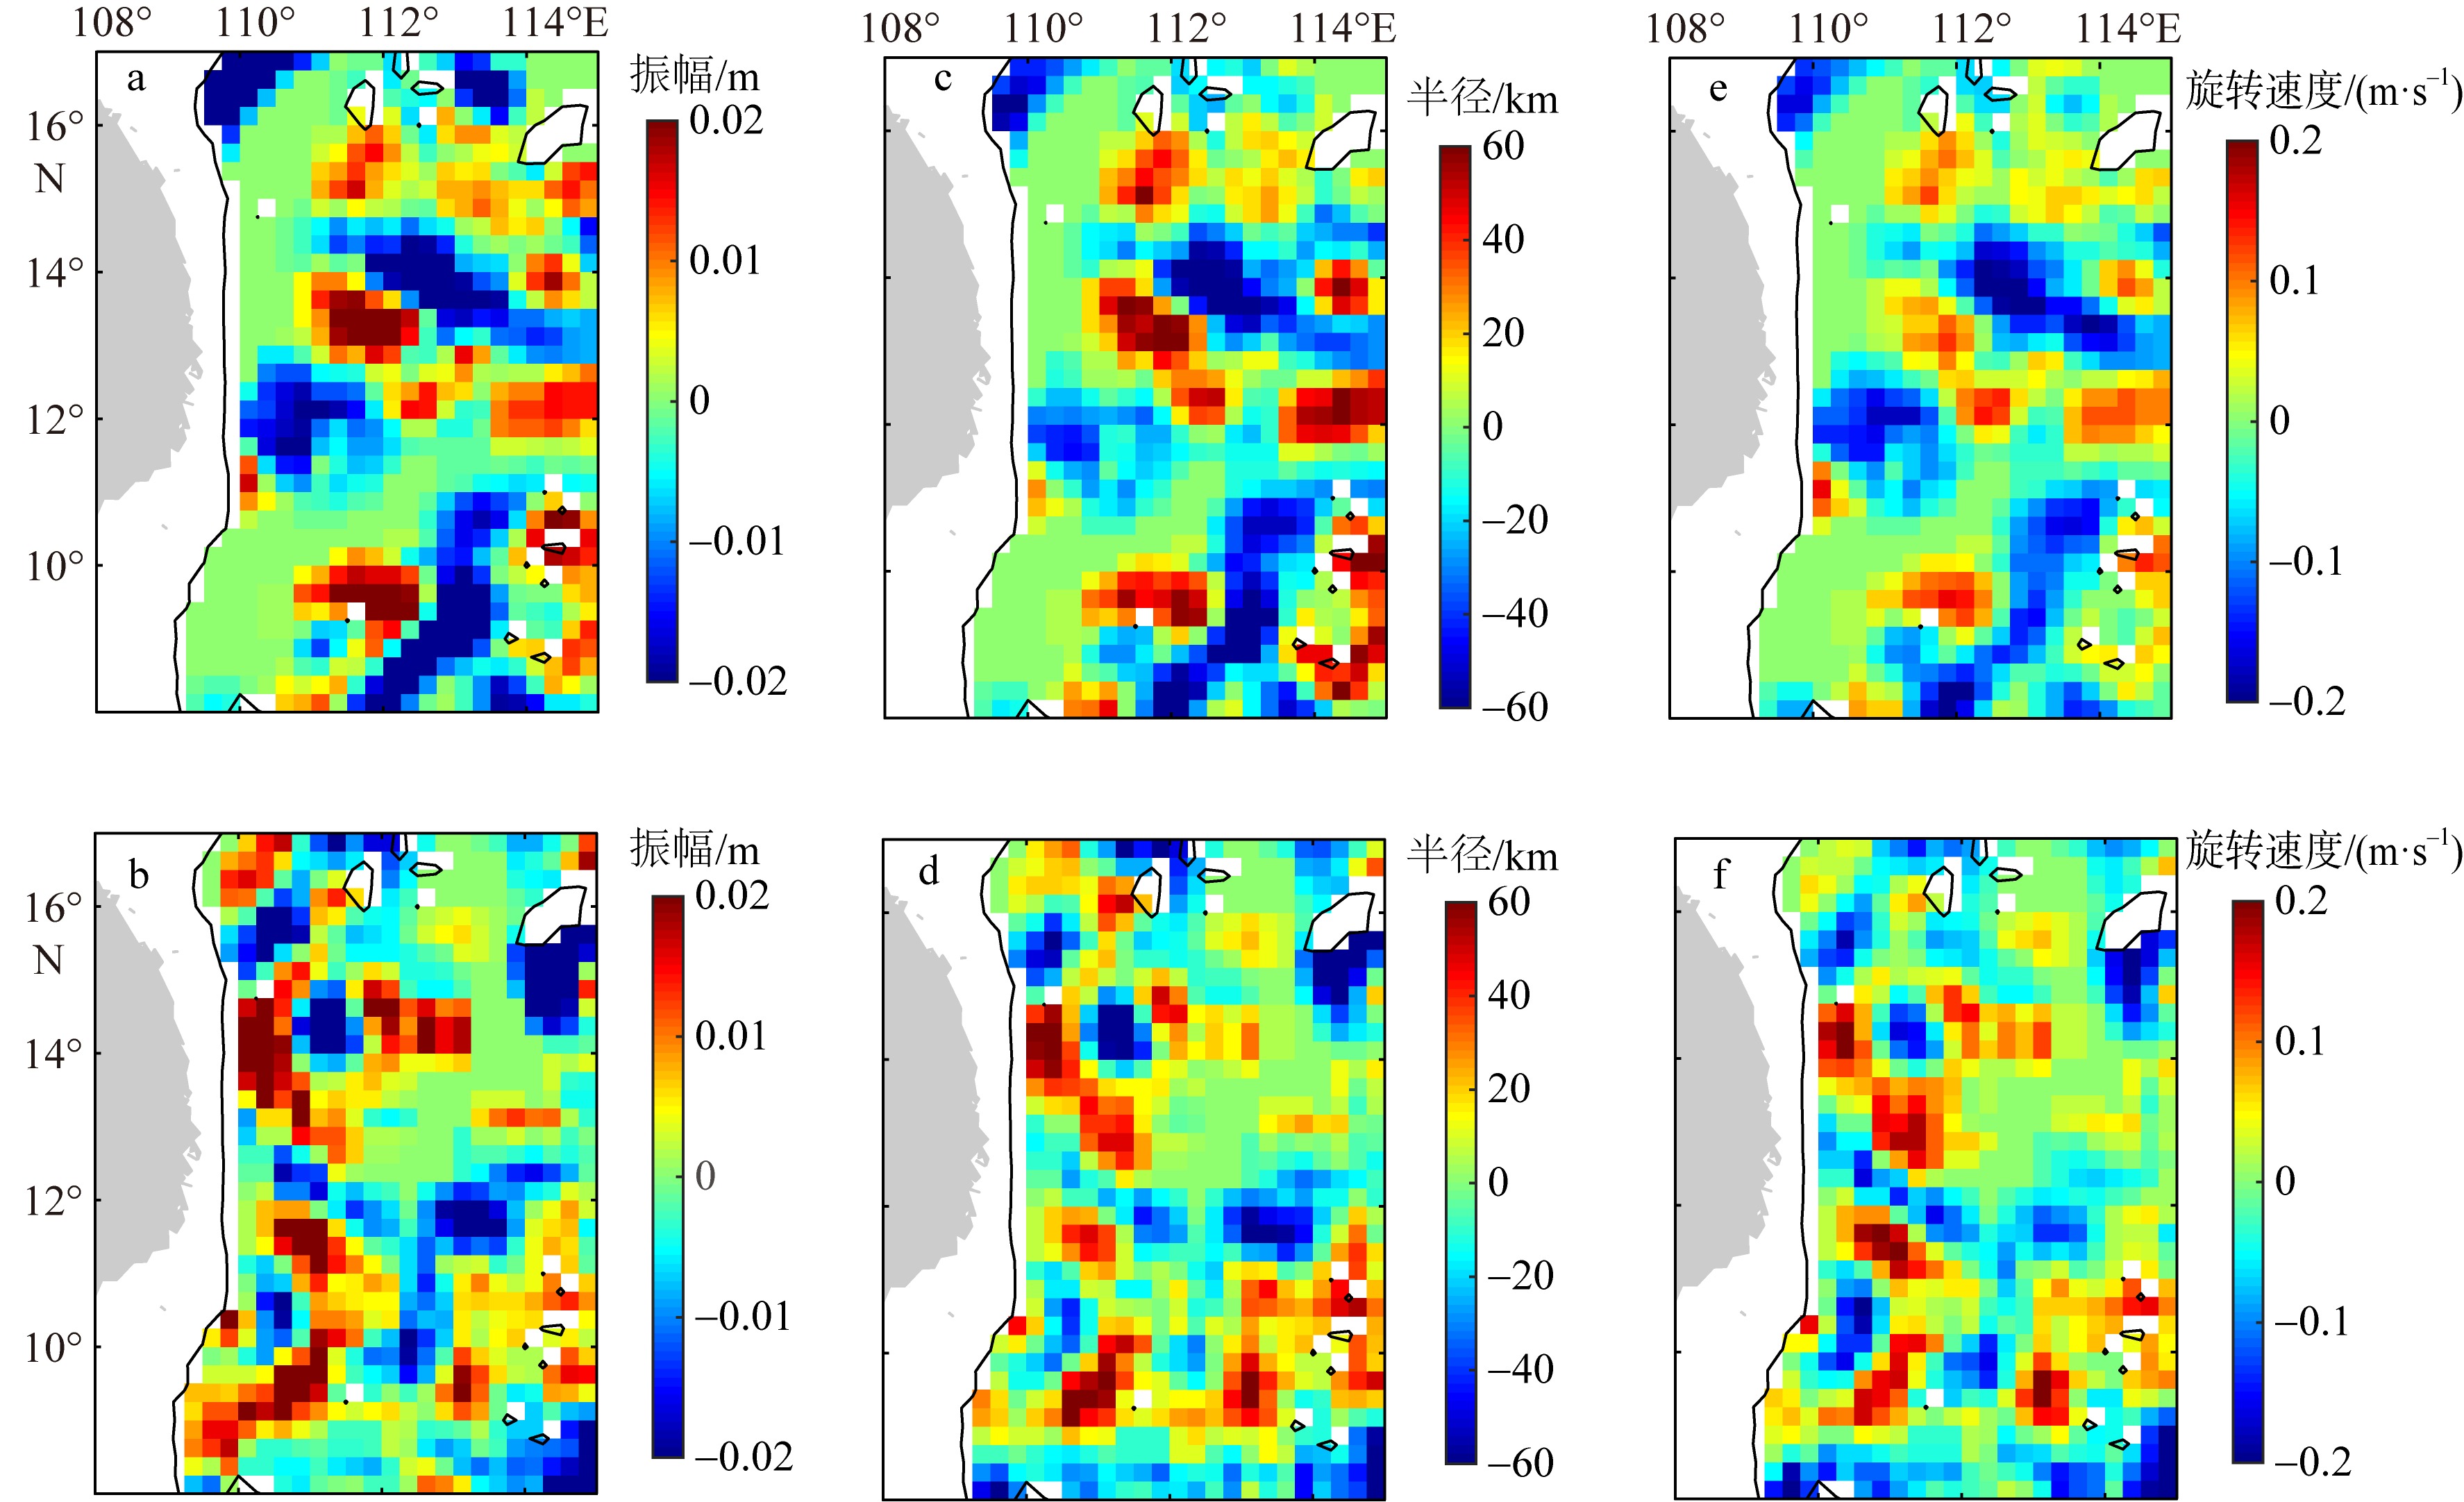
Fig. 7
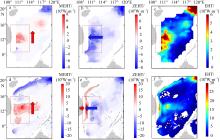
Fig. 8
The horizontal distribution of eddy induced heat transport based on two datasets. (a) MEHT(poleward is positive); (b) ZEHT(east is positive); (c) EHT calculated from monthly mean Argo data (2004-2017); (d-f) are the same as (a-c) but calculated from the monthly average data (1993-2017) provided by OFES products. The red dotted box is the study area"

Fig. 8
Fig. 9
Horizontal distribution and differences of MEHT/ZEHT in “O” and “U” pattern based on two datasets. (a-f) are results calculated by Argo data: (a) distribution of ZEHT(poleward is positive) in “O” years; (b) distribution of MEHT in “U” years; (c) difference between “O” and “U” pattern (“O” minus “U”); (d-f) are the same as (a-c) but for MEHT; (g-l) are the same as (a-f) but calculated from the monthly average data (1993-2017) provided by OFES products"

Fig. 9
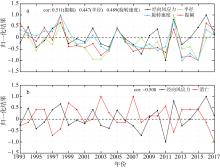
Fig. 10
The normalized time series of the meridional wind stress and statistical features of AE in the SCSwbc region. (a) amplitude, radius and rotation speed; (b) dissipation"

Fig. 10
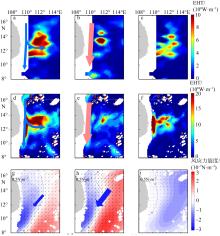
Fig. 11
The horizontal distribution of EHT based on Argo (a-c) and OFES outputs (d-f). The third rows show horizontal distributions of the wind stress and wind stress curl in two patterns based on OFES outputs. (a, d, g) Distribution of “O” pattern; (b, e, h) distribution of “U” pattern; (c) the difference between “O” and “U” pattern (“O” minus “U”). The blue/red arrows in (a, b, d, e) represent the western boundary current of South China Sea in “O”/“U” pattern. The blue arrows in (g) and (h) represent the intensity of wind field in two patterns"

Fig. 11
| [1] |
林鹏飞, 王凡, 陈永利, 等, 2007. 南海中尺度涡的时空变化规律Ⅰ. 统计特征分析[J]. 海洋学报(中文版), 2007(3): 14-22.
|
|
|
|
| [2] |
王东晓, 王强, 蔡树群, 等, 2019. 南海中深层动力格局与演变机制研究进展[J]. 中国科学: 地球科学, 49(12): 1919-1932. (in Chinese)
|
| [3] |
doi: 10.1016/S0278-4343(02)00073-0 |
| [4] |
doi: 10.1175/2009JCLI2848.1 |
| [5] |
doi: 10.1016/j.pocean.2011.01.002 |
| [6] |
doi: 10.1002/2014JC010309 |
| [7] |
|
| [8] |
|
| [9] |
doi: 10.1016/j.csr.2009.11.013 |
| [10] |
doi: 10.1007/s10236-014-0691-z |
| [11] |
doi: 10.1175/1520-0485(1999)029<2971:DMFTSC>2.0.CO;2 |
| [12] |
doi: 10.1002/2016JC012642 |
| [13] |
doi: 10.1002/2013JC009314 |
| [14] |
doi: 10.1016/j.jmarsys.2016.01.013 |
| [15] |
|
| [16] |
|
| [17] |
|
| [18] |
doi: 10.1016/j.dsr.2007.09.008 |
| [19] |
doi: 10.1007/s00382-021-05719-7 |
| [20] |
doi: 10.1029/2018JC014054 |
| [21] |
doi: 10.1023/A:1011117531252 |
| [22] |
|
| [23] |
doi: 10.1002/2016JC012285 |
| [24] |
|
| [25] |
doi: 10.1175/JTECH-D-14-00019.1 |
| [26] |
|
| [27] |
|
| [28] |
doi: 10.1175/1520-0485(2000)030<1450:ULCITS>2.0.CO;2 |
| [29] |
doi: 10.1007/s10236-016-0951-1 |
| [30] |
doi: 10.1175/1520-0485(1997)027<1743:GCOOVE>2.0.CO;2 |
| [31] |
doi: 10.1175/JCLI4142.1 |
| [32] |
|
| [33] |
doi: 10.1175/2007JPO3868.1 |
| [34] |
|
| [35] |
doi: 10.1002/2017JC012711 |
| [36] |
doi: 10.1175/JPO-D-18-0247.1 |
| [37] |
doi: 10.1007/s00382-019-05050-2 |
| [38] |
doi: 10.1016/j.dsr.2011.11.006 |
| [39] |
|
| [40] |
|
| [41] |
doi: 10.1007/BF02742620 |
| [42] |
doi: 10.1029/1999JC900260 |
| [43] |
|
| [44] |
doi: 10.1038/ncomms10505 pmid: 26829888 |
| [45] |
|
| [46] |
doi: 10.1175/JPO-D-18-0201.1 |
| [47] |
doi: 10.1002/jgrc.20343 |
| [48] |
|
| [49] |
doi: 10.1002/2017JC013562 |
| [50] |
|
| [51] |
doi: 10.1007/s00382-018-4230-3 |
| [52] |
doi: 10.1007/s00382-019-05007-5 |
| No related articles found! |
|
||