
Journal of Tropical Oceanography ›› 2024, Vol. 43 ›› Issue (1): 1-15.doi: 10.11978/2023020CSTR: 32234.14.2023020
• Marine Hydrology • Next Articles
Fractal lengths of tracer contours in the ocean and its relationship with mixing efficiency
QIAN Yukun1,2( ), LIU Tongya3,4, ZHANG Hua1,5, PENG Shiqiu1,2,5()
- 1. State Key Laboratory of Tropical Oceanography, South China Sea Institute of Oceanology, Chinese Academy of Sciences, Guangzhou 511458, China
2. Key Laboratory of Science and Technology on Operational Oceanography, South China Sea Institute of Oceanology, Chinese Academy of Sciences, Guangzhou 511458, China
3. State Key Laboratory of Satellite Ocean Environment Dynamics, Second Institute of Oceanography, Ministry of Natural Resources, Hangzhou 310012, China
4. Southern Marine Science and Engineering Guangdong Laboratory (Zhuhai), Zhuhai 519000, China
5. University of Chinese Academy of Sciences, Beijing 100049, China
-
Received:2023-05-12Revised:2023-06-08Online:2024-01-10Published:2024-01-19 -
Supported by:National Key Research and Development Program of China(2022YFC3105004); National Natural Science Foundation of China(41976023); National Natural Science Foundation of China(41931182); National Natural Science Foundation of China(42106008); National Natural Science Foundation of China(42376028); Independent Research Project Program of State Key Laboratory of Tropical Oceanography(LTOZZ2102); Open Project of the State Key Laboratory of Tropical Oceanography(LTO2107)
Cite this article
QIAN Yukun, LIU Tongya, ZHANG Hua, PENG Shiqiu. Fractal lengths of tracer contours in the ocean and its relationship with mixing efficiency[J].Journal of Tropical Oceanography, 2024, 43(1): 1-15.
share this article
Add to citation manager EndNote|Reference Manager|ProCite|BibTeX|RefWorks
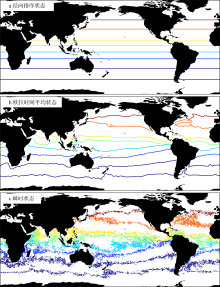
Fig.1
Schematic illustration of the relation between contour length of a tracer and mixing efficiency. (a) Minimum possible contour length on a sphere (latitude circles) which is at the lowest mixing efficiency; (b) smooth climatological contour through a Eulerian time mean; (c) instantaneous wavy contour distribution in which mixing efficiency is greatly enhanced. Note that the areas between any two contours are the same for each panel"

Fig.1
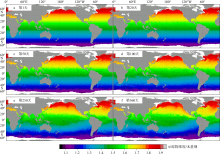
Fig. 2
Evolution of a passive tracer driven by surface geostrophic flows. The tracer is initially aligned with latitudes and normalized between 1 and 2"

Fig. 2
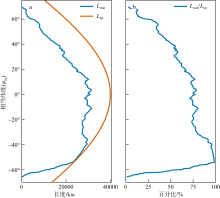
Fig. 3
(a) Minimum possible length ${{L}_{\text{min}}}$ (km, blue) and total length of latitudinal circle (km, orange), and (b) the ratio of ${{L}_{\text{min}}}$ to the total length of latitudinal circle"
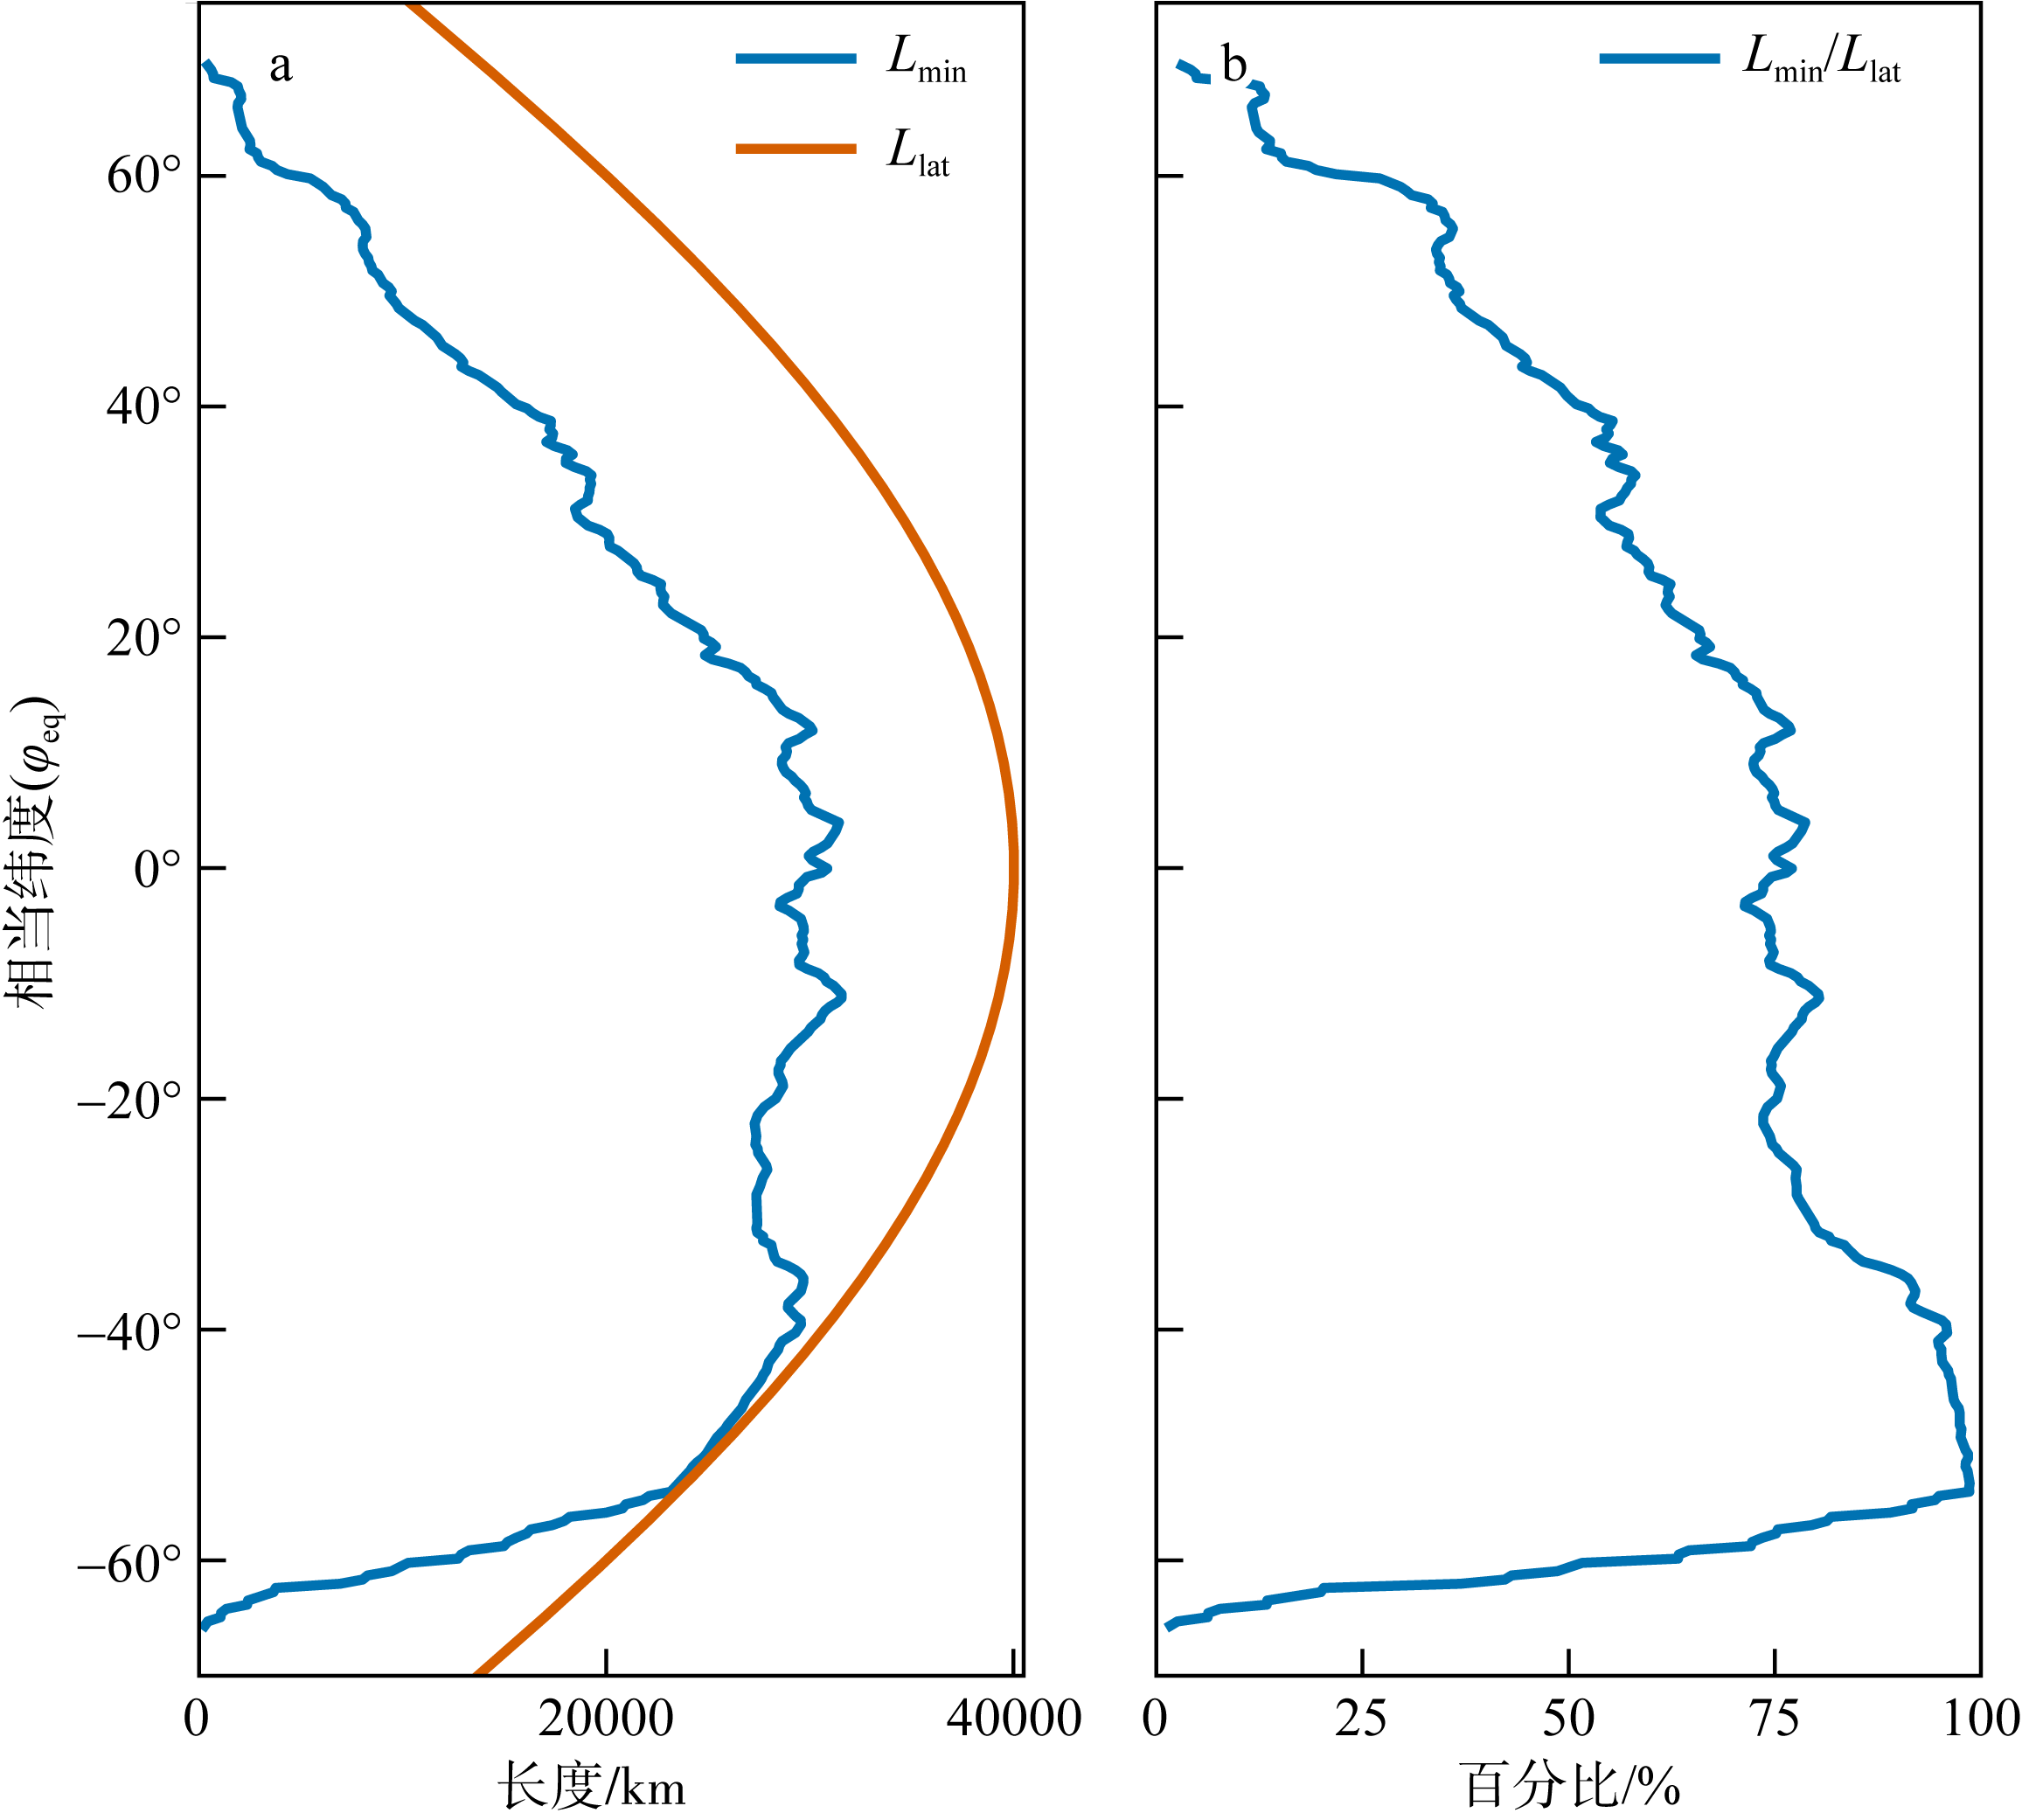
Fig. 3

Fig. 4
Tracer horizontal distribution and its contour length L and equivalent length ${{L}_{\text{eq}}}$. Left columns are tracer distributions with several contours highlighted. Right columns are contour lengths normalized by ${{L}_{\text{min}}}$(b, d, f, h). The first row is the results at first day (a) and the last three rows are results after 1-yr integration with small-scale diffusivity ${{\kappa }_{\text{m}}}=$ 5(c), 20(e), 50 m2·s-1(g)"
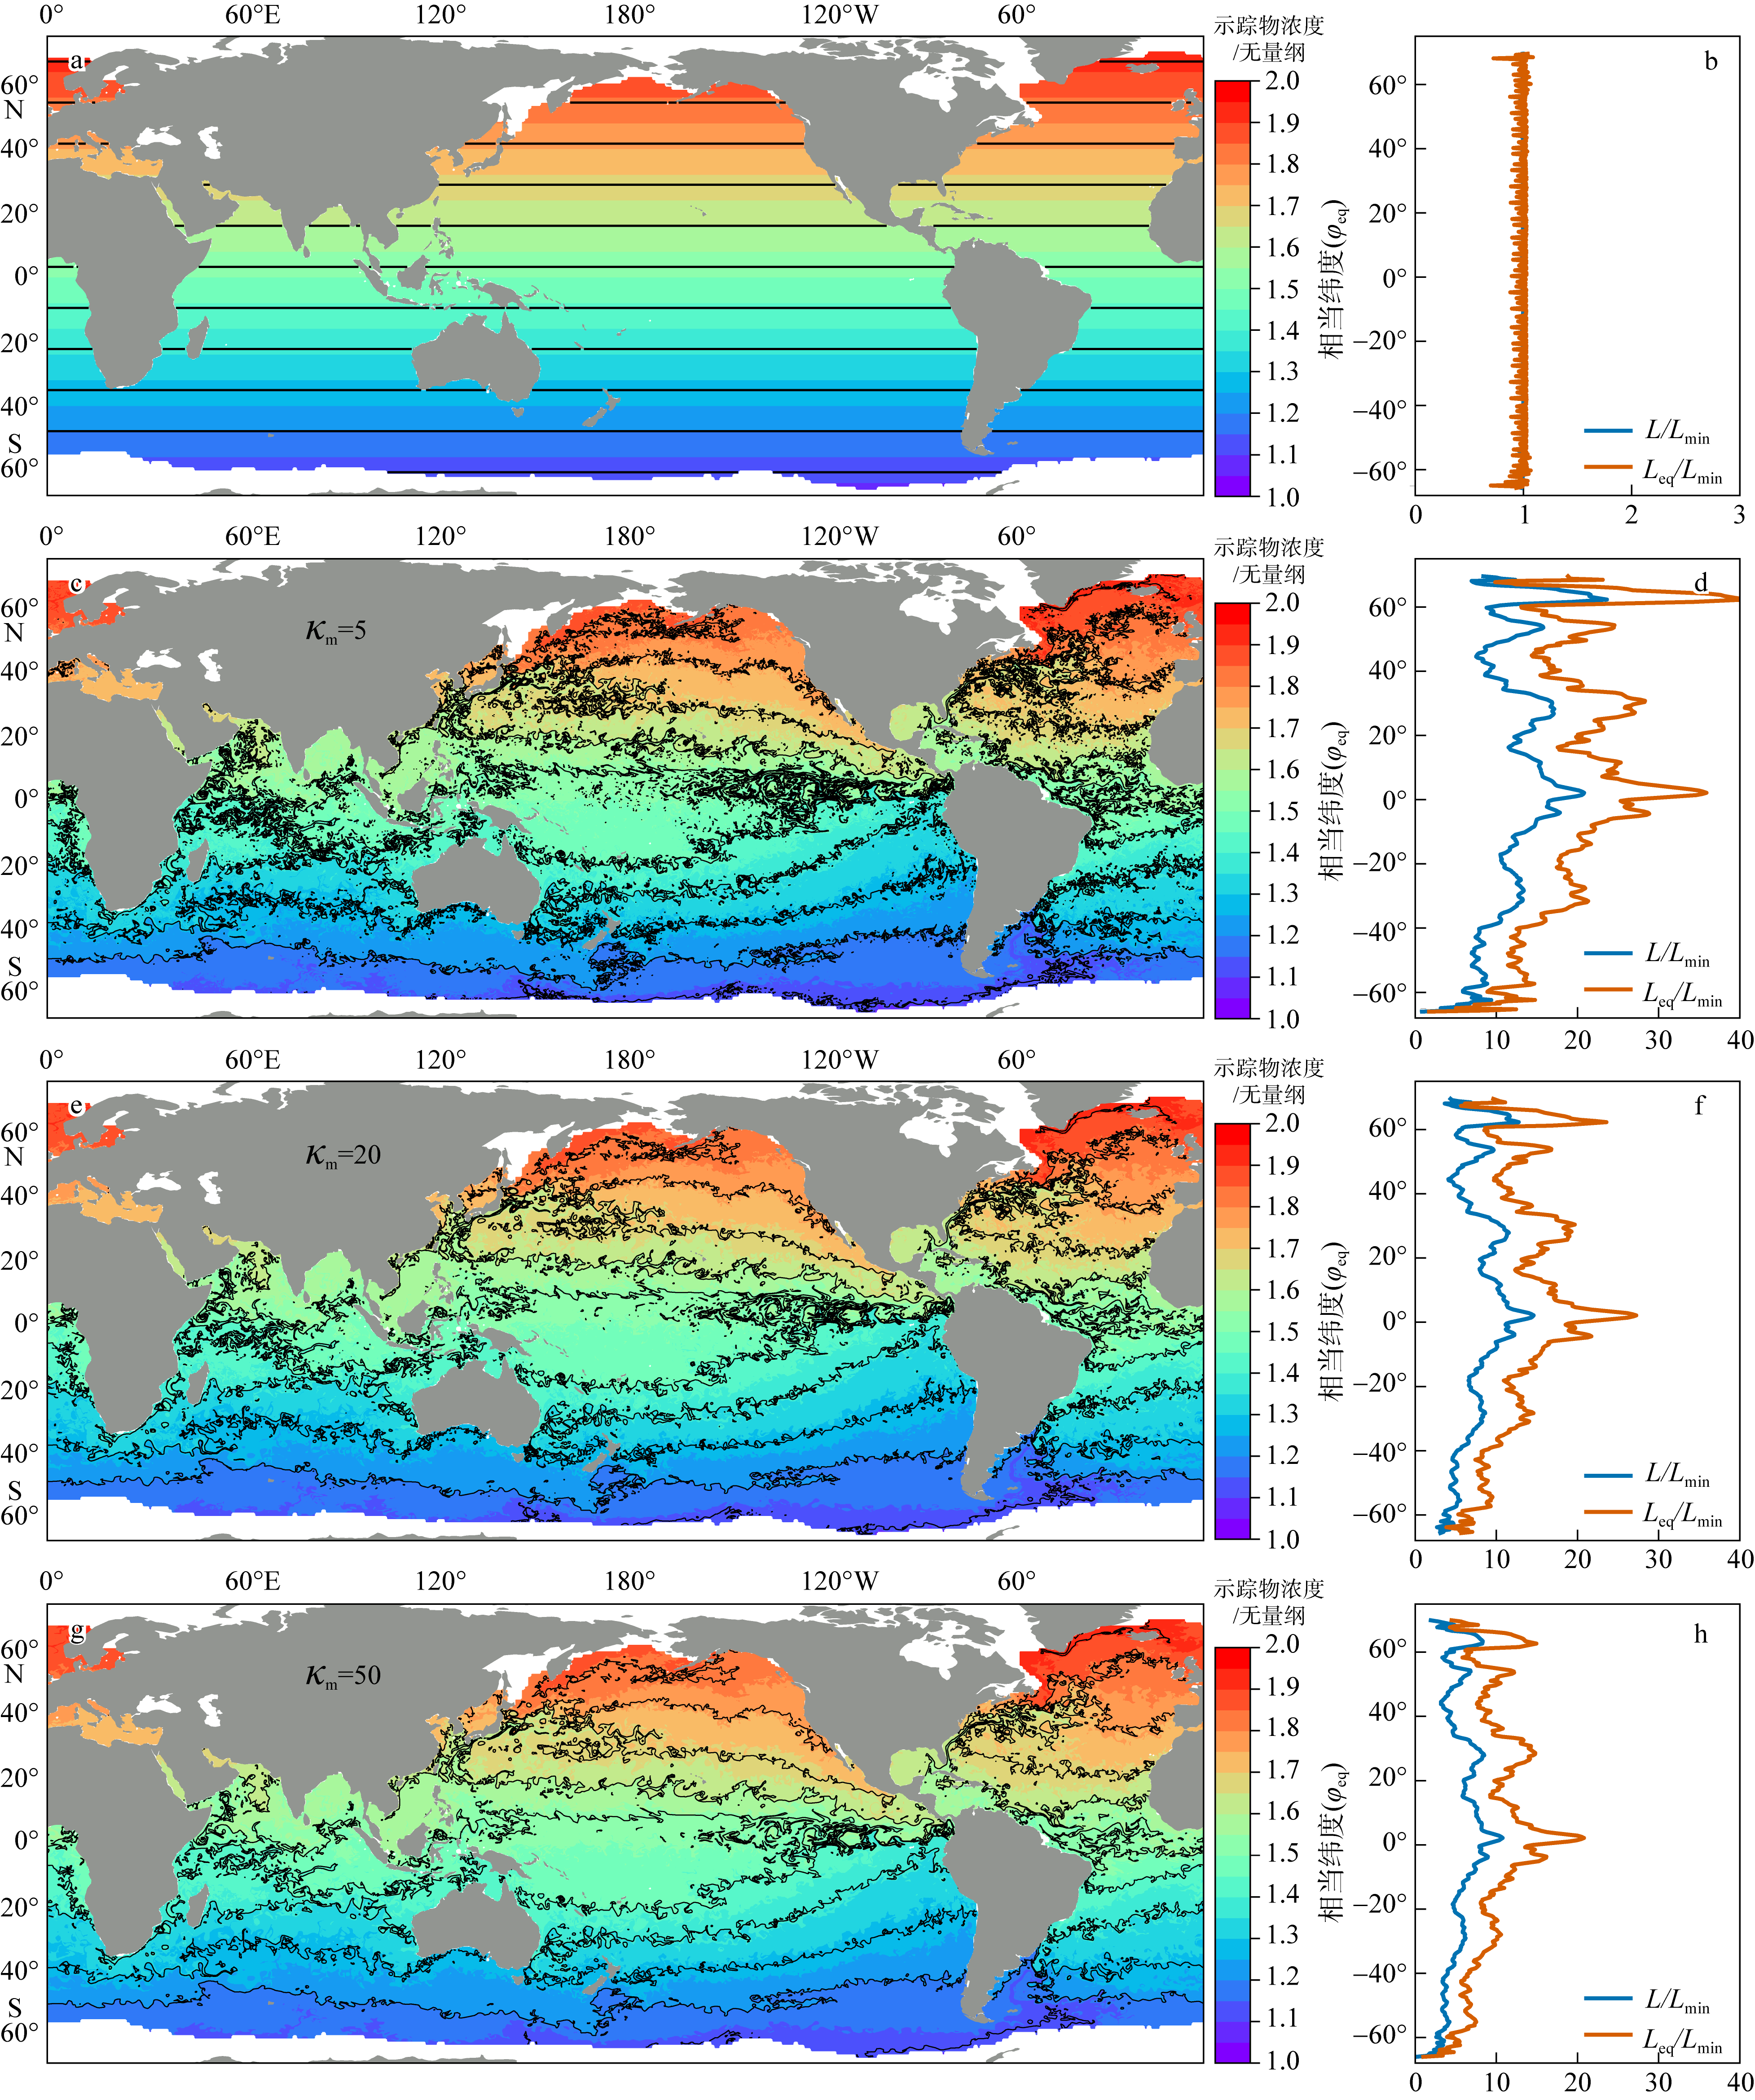
Fig. 4
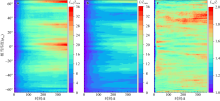
Fig. 5
Temporal evolution of (a) equivalent length ${{L}_{\text{eq}}}$ normalized by ${{L}_{\text{min}}}$, (b) perimeter length L normalized by ${{L}_{min}}$, and (c) ratio of ${{L}_{\text{eq}}}$ to L"

Fig. 5
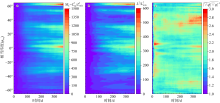
Fig. 6
Temporal evolutions of (a) mixing efficiency ${{M}_{\text{E}}}$ (b) perimeter length factor ${{L}^{2}}/L_{\text{min}}^{2}$, and (c) gradient factor $\overline{\left| \nabla q \right|}\overline{{{\left| \nabla q \right|}^{-1}}}$"

Fig. 6
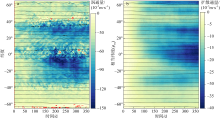
Fig. 7
Comparison of Eulerian zonal mean eddy flux and along-contour mean diffusive flux. (a) Eddy tracer flux ${{\overline{v'q'}}^{X}}$ (10-5 color shadings) and ${{\bar{q}}^{X}}$ (contours) based on Eulerian zonal mean ${{\overline{\left( \text{ }\!\!\cdot\!\!\text{ } \right)}}^{X}}$; (b) diffusive flux ${{K}_{\text{eff}}}\partial q/\partial {{\varphi }_{\text{eq}}}/a$ (10-5) and $q\left( t,{{\varphi }_{\text{eq}}} \right)$ based on the along-contour mean. Red lines indicate zero-flux contour"
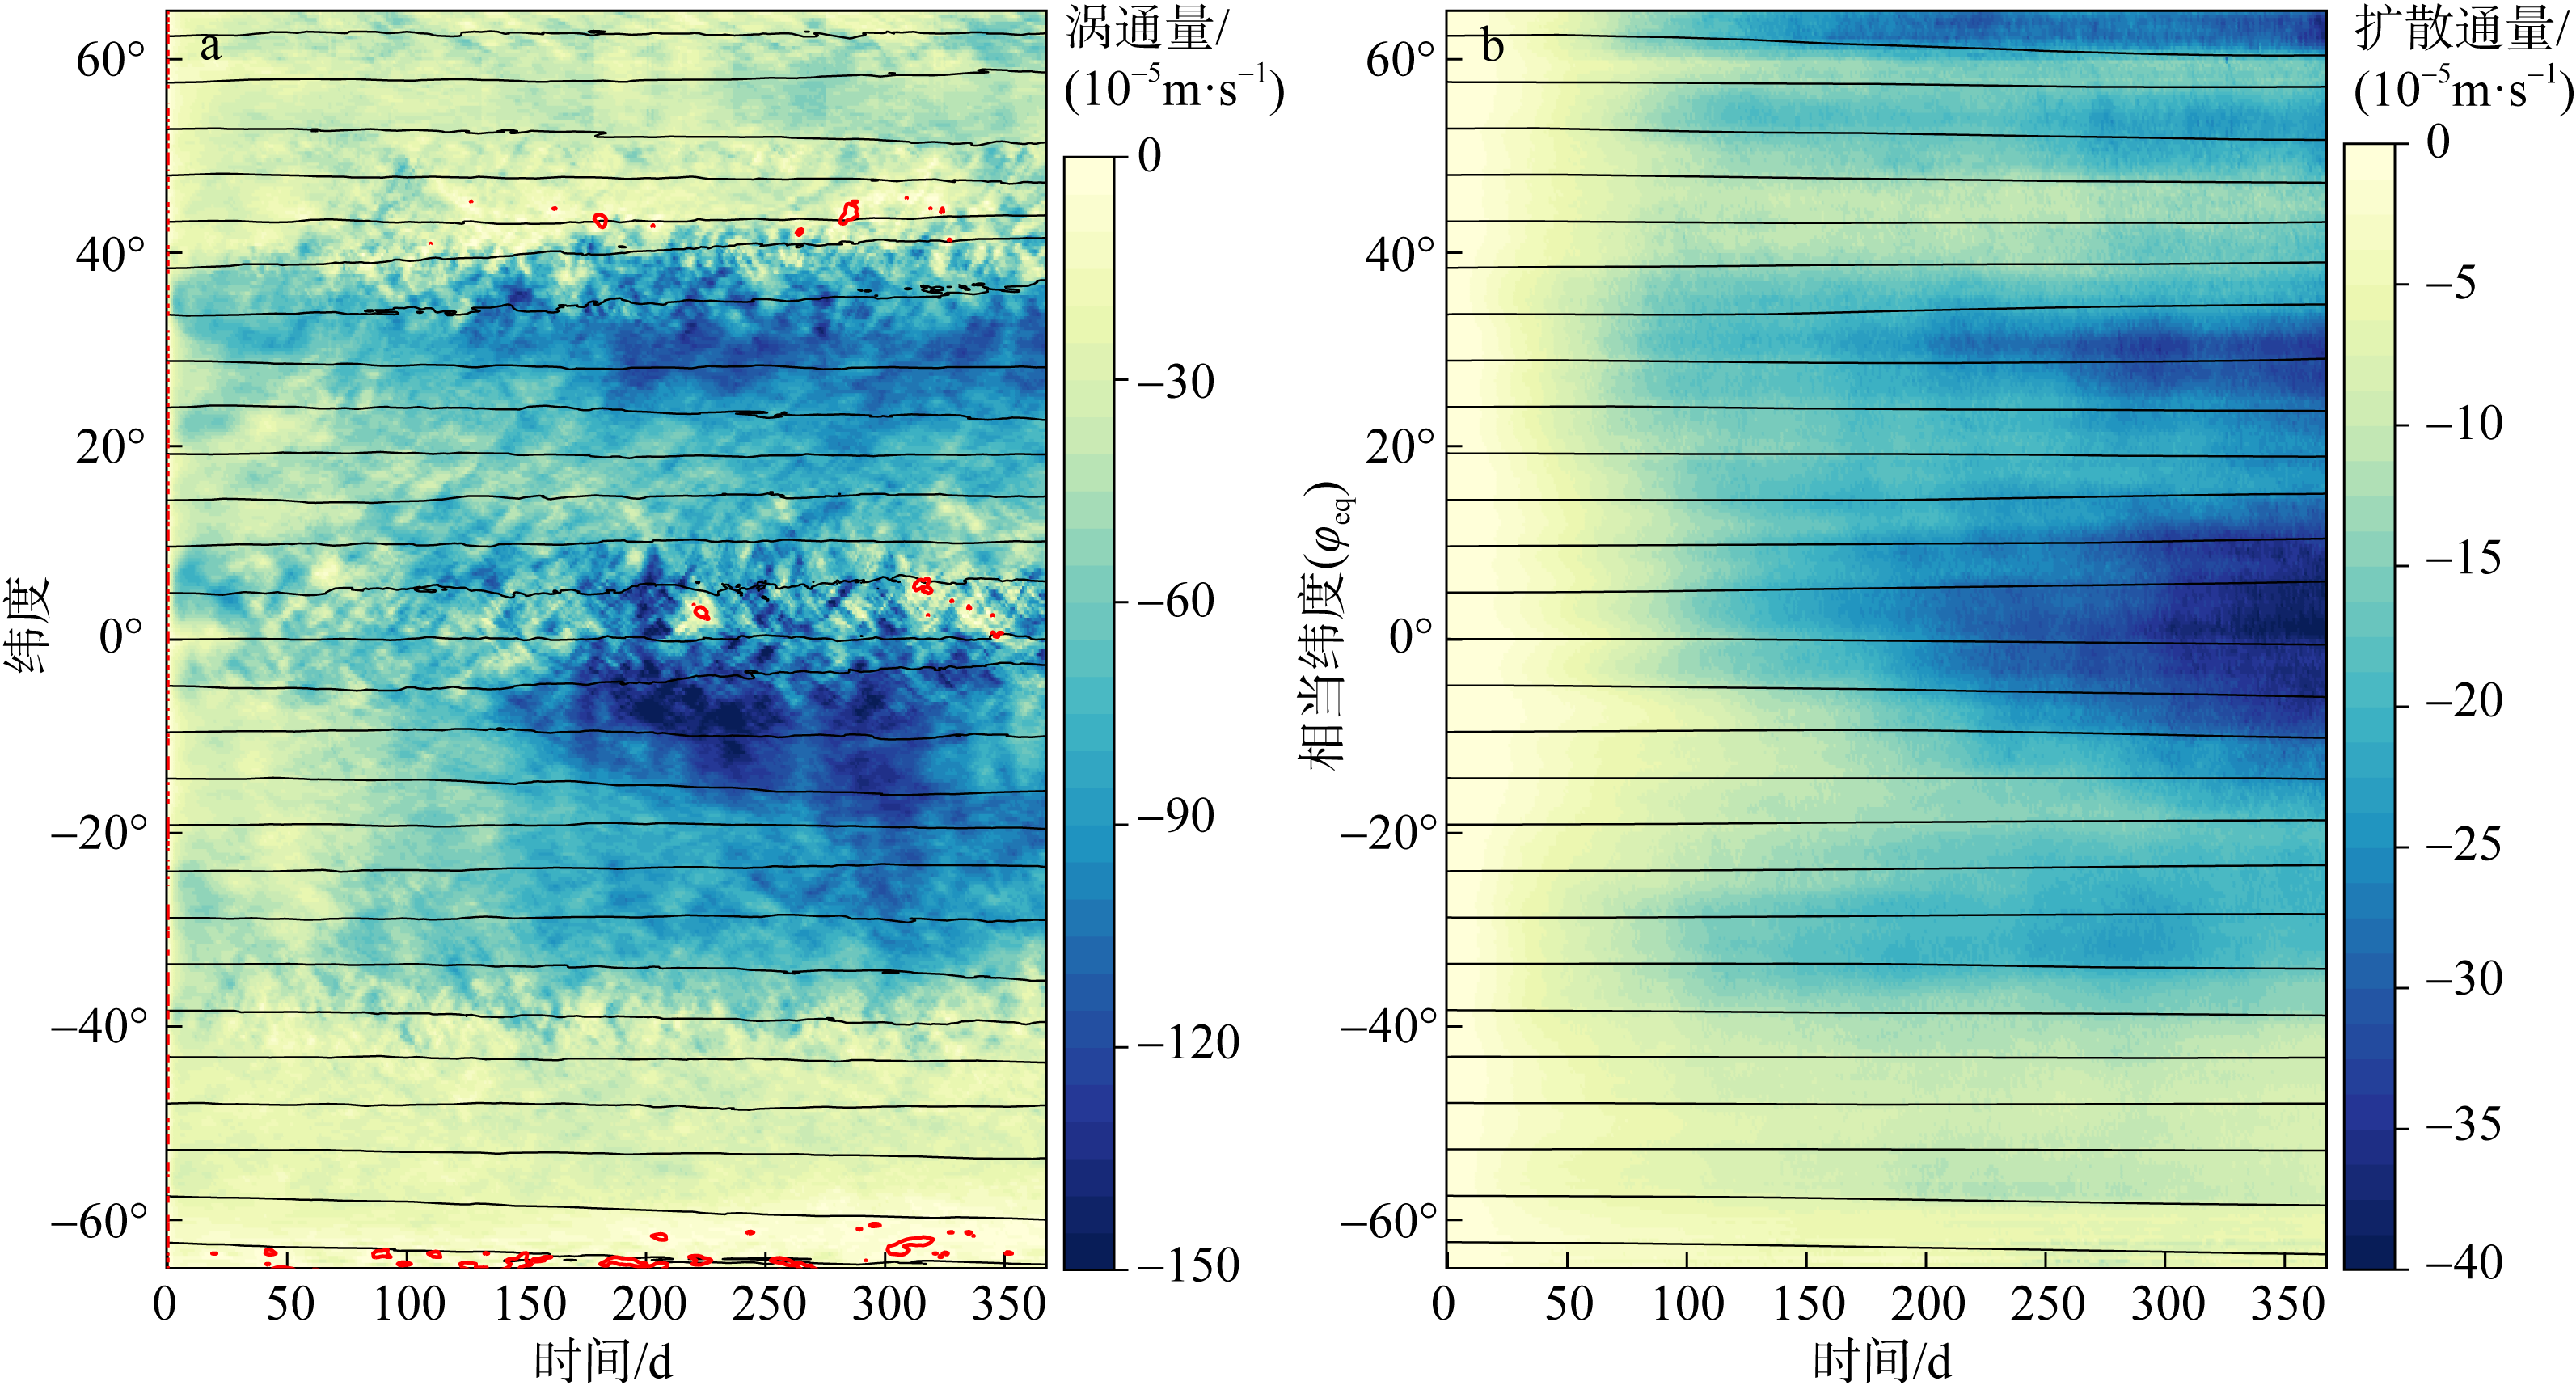
Fig. 7
Fig. 8
Tracer distributions at different timesteps (a, c, e, g) and contour lengths normalized by ${{L}_{\text{min}}}$(b, d, f, h). Row one to row four show the results of integration after 1, 20, 100, and 365 days. Contour lengths are calculated using ‘box-counting’ method with 8 grid boxes"
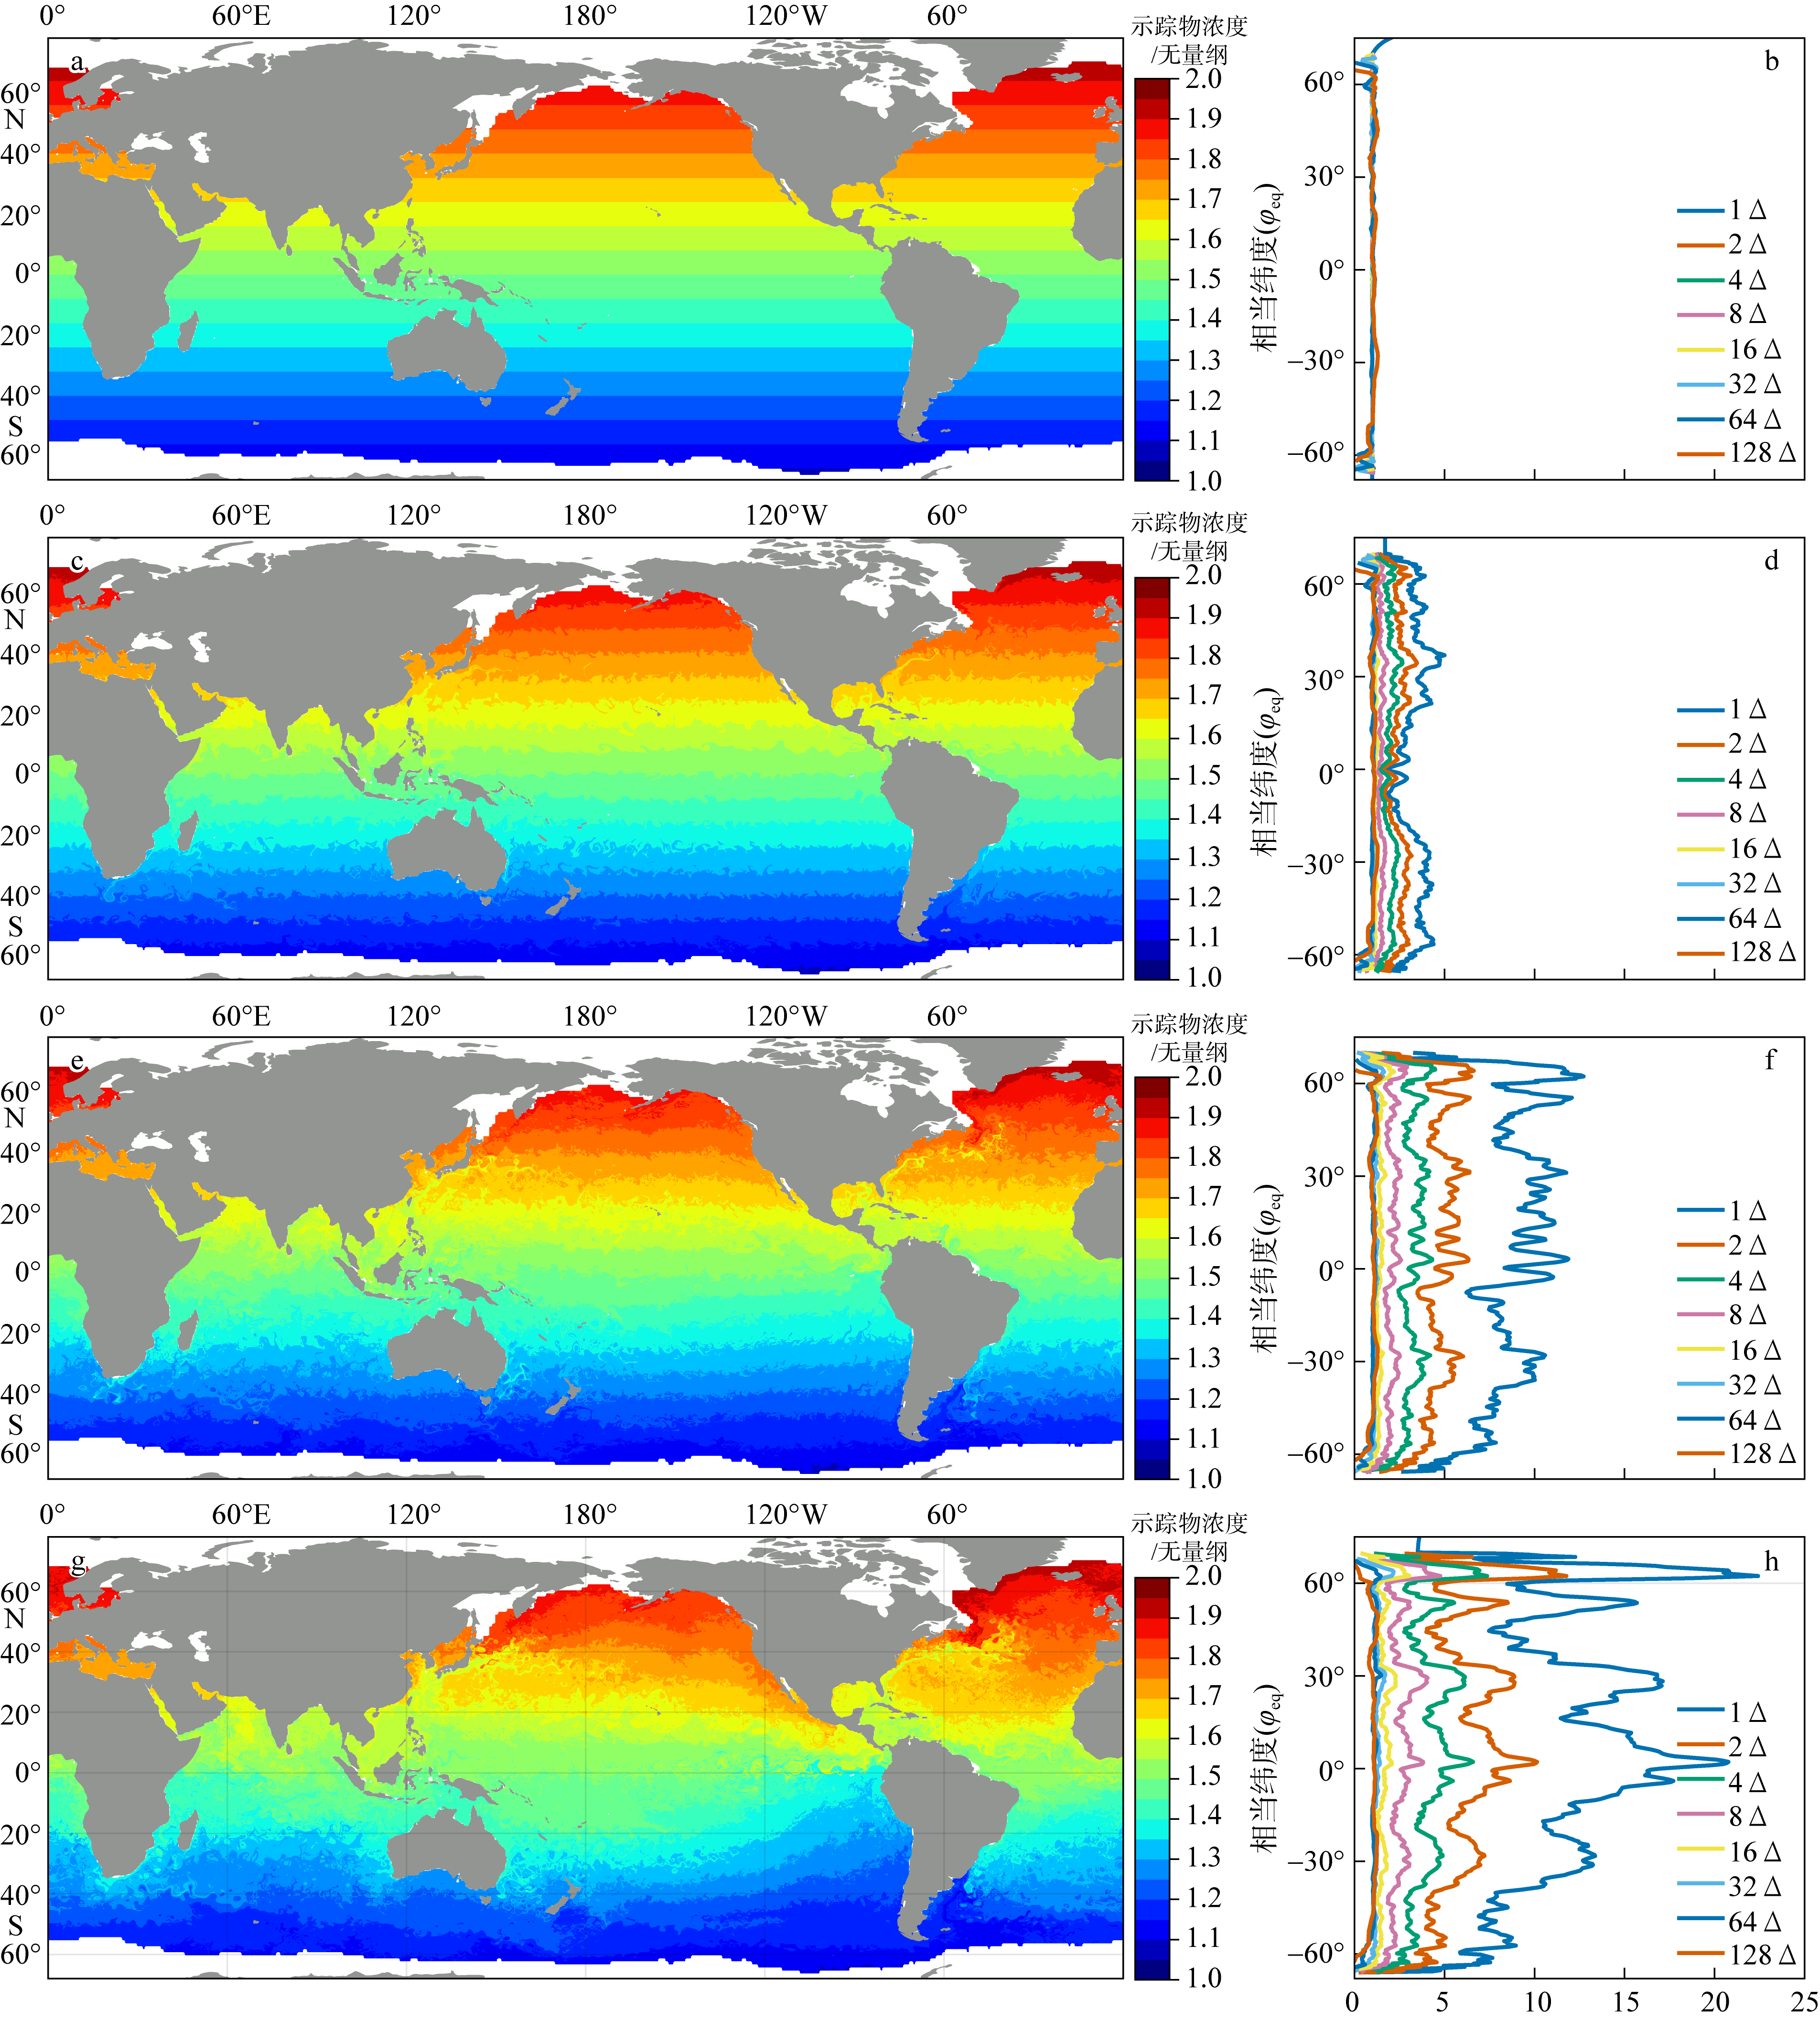
Fig. 8
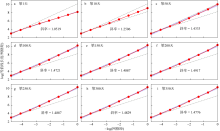
Fig. 9
Contour length (m) against grid resolution (m) on a log-log plot for the equivalent latitude of 53.3°S. Panels (a) to (i) are results at 0, 10, 50, 100, 150, 200, 250, 300, and 350 days, respectively. Linear-fit slopes are indicated in each panel. Purple shadings indicate 95% confidence intervals for the linear fit. Two dash lines are the fitted lines with maximum and minimum slopes during the time range of interest"
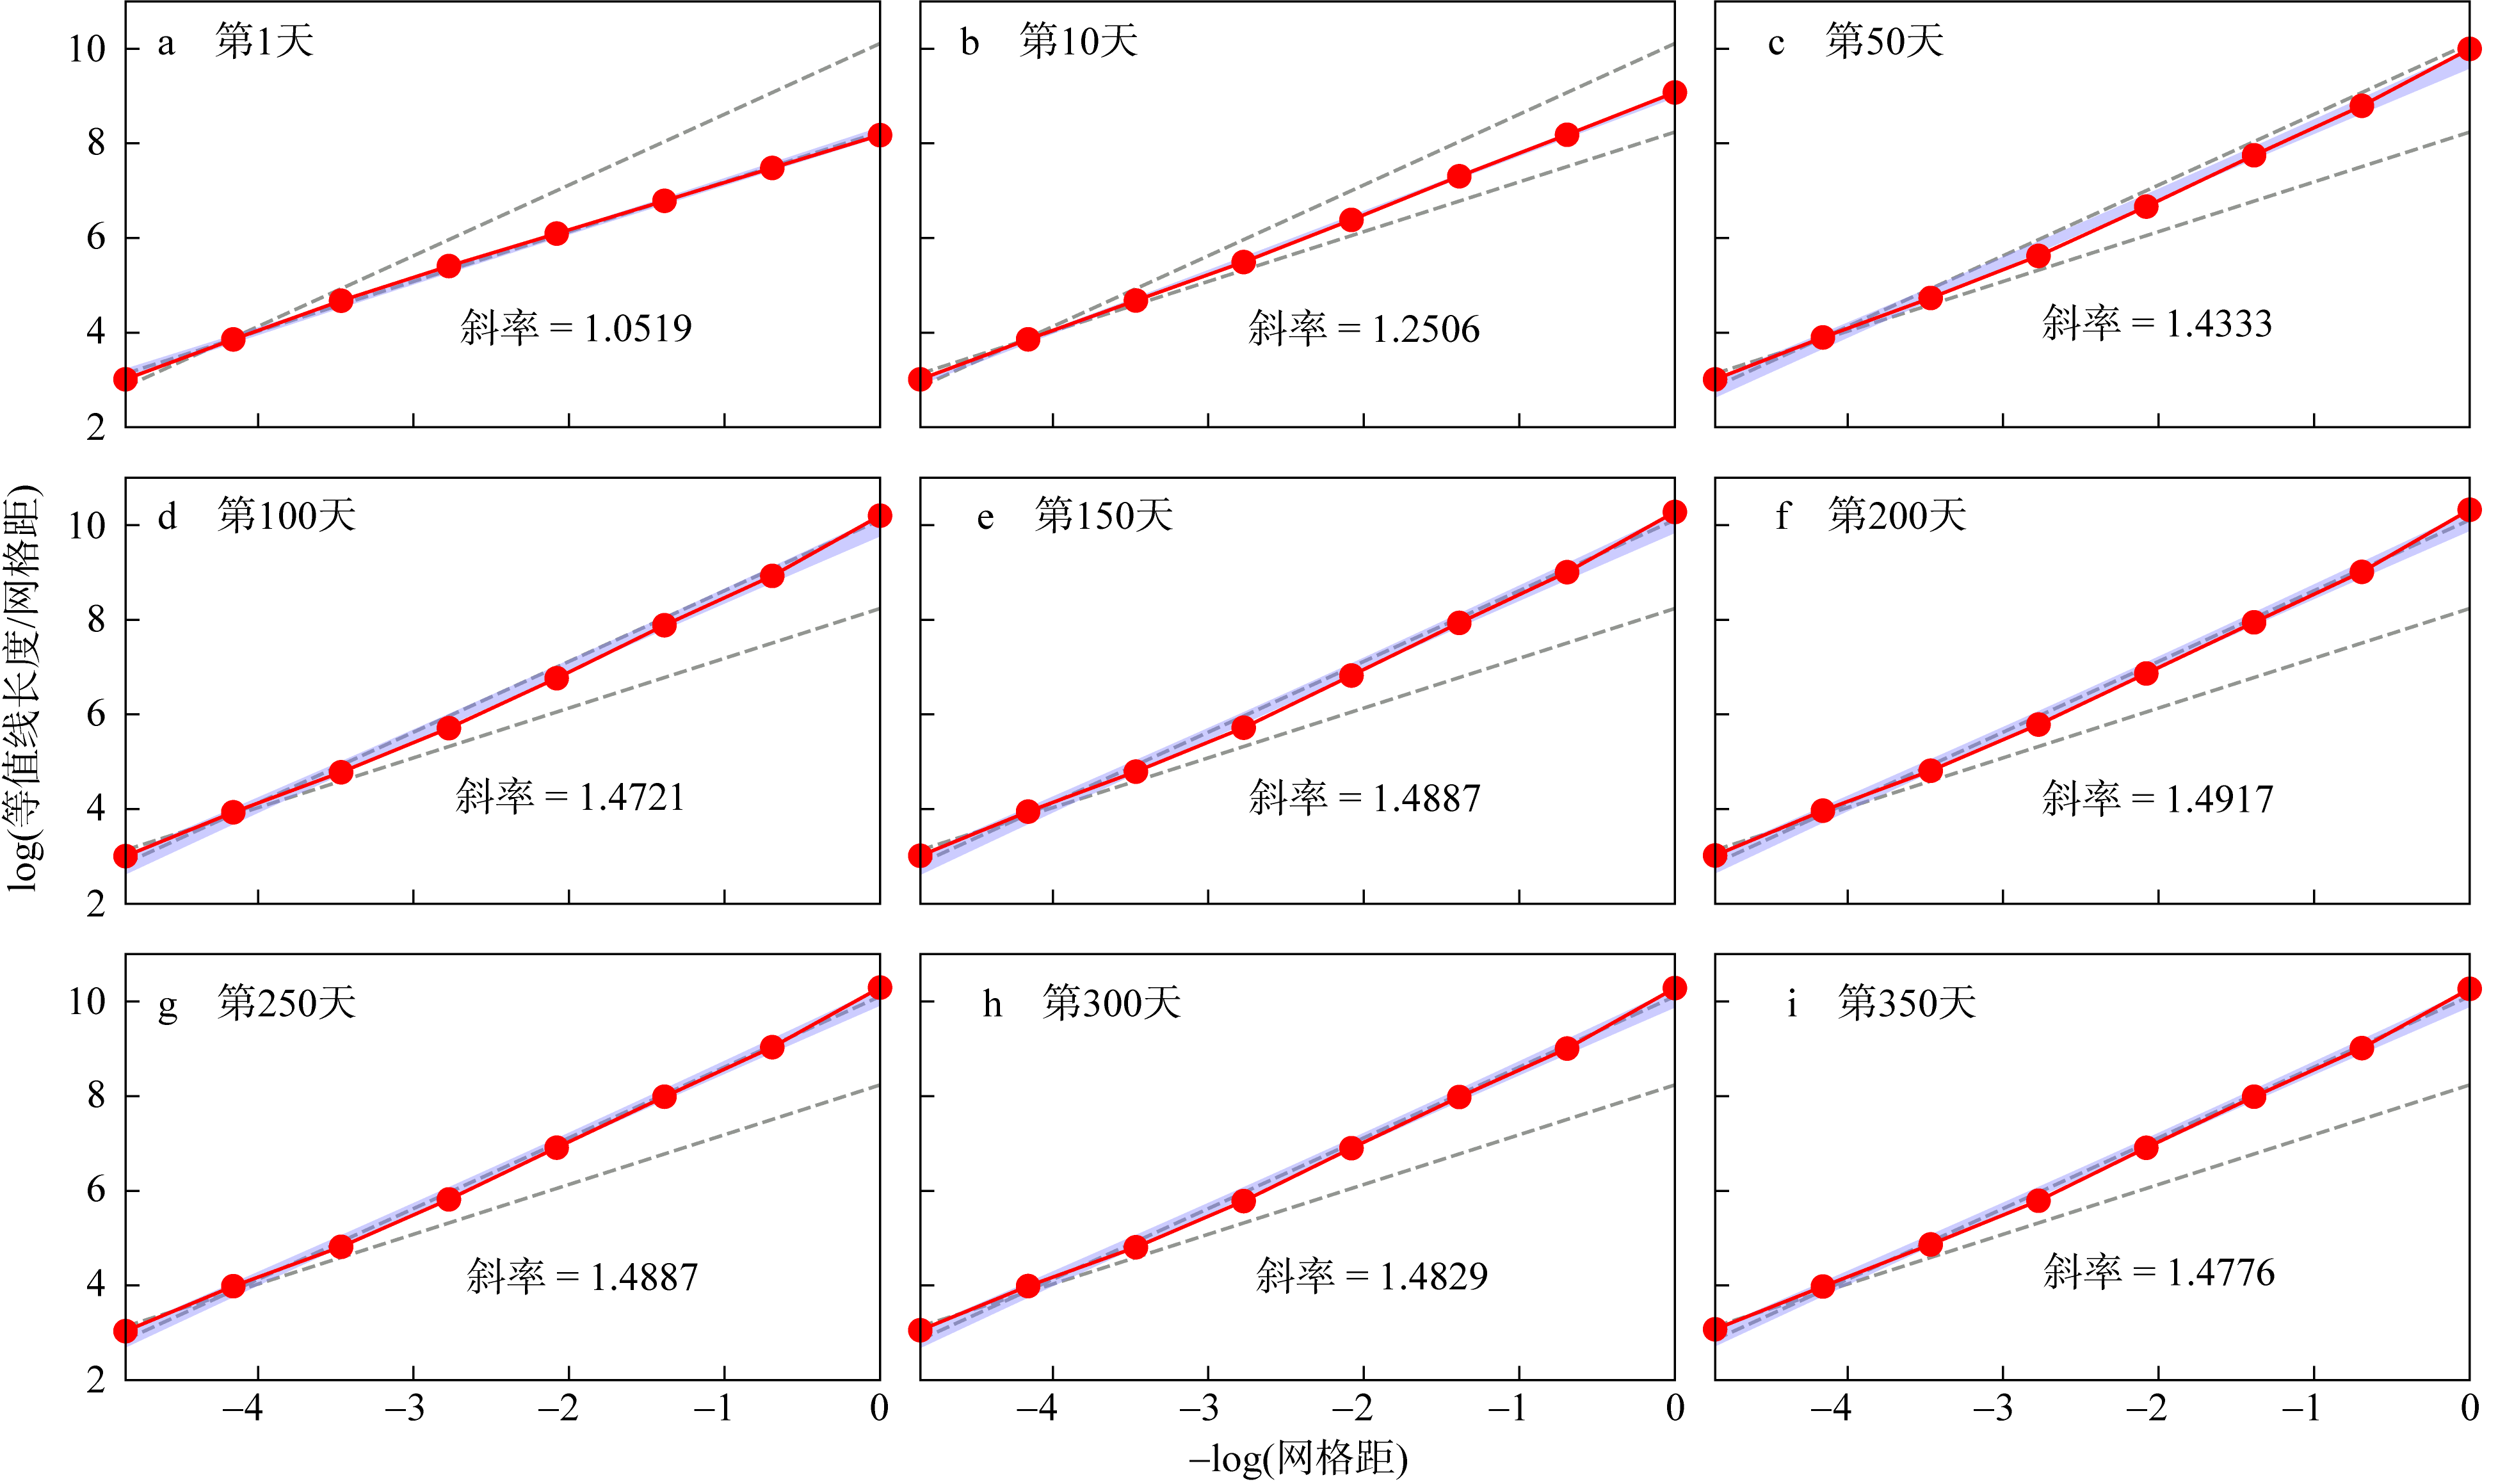
Fig. 9
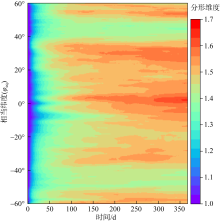
Fig. 10
Spatio-temporal variations of the “box-counting” fractal dimension"
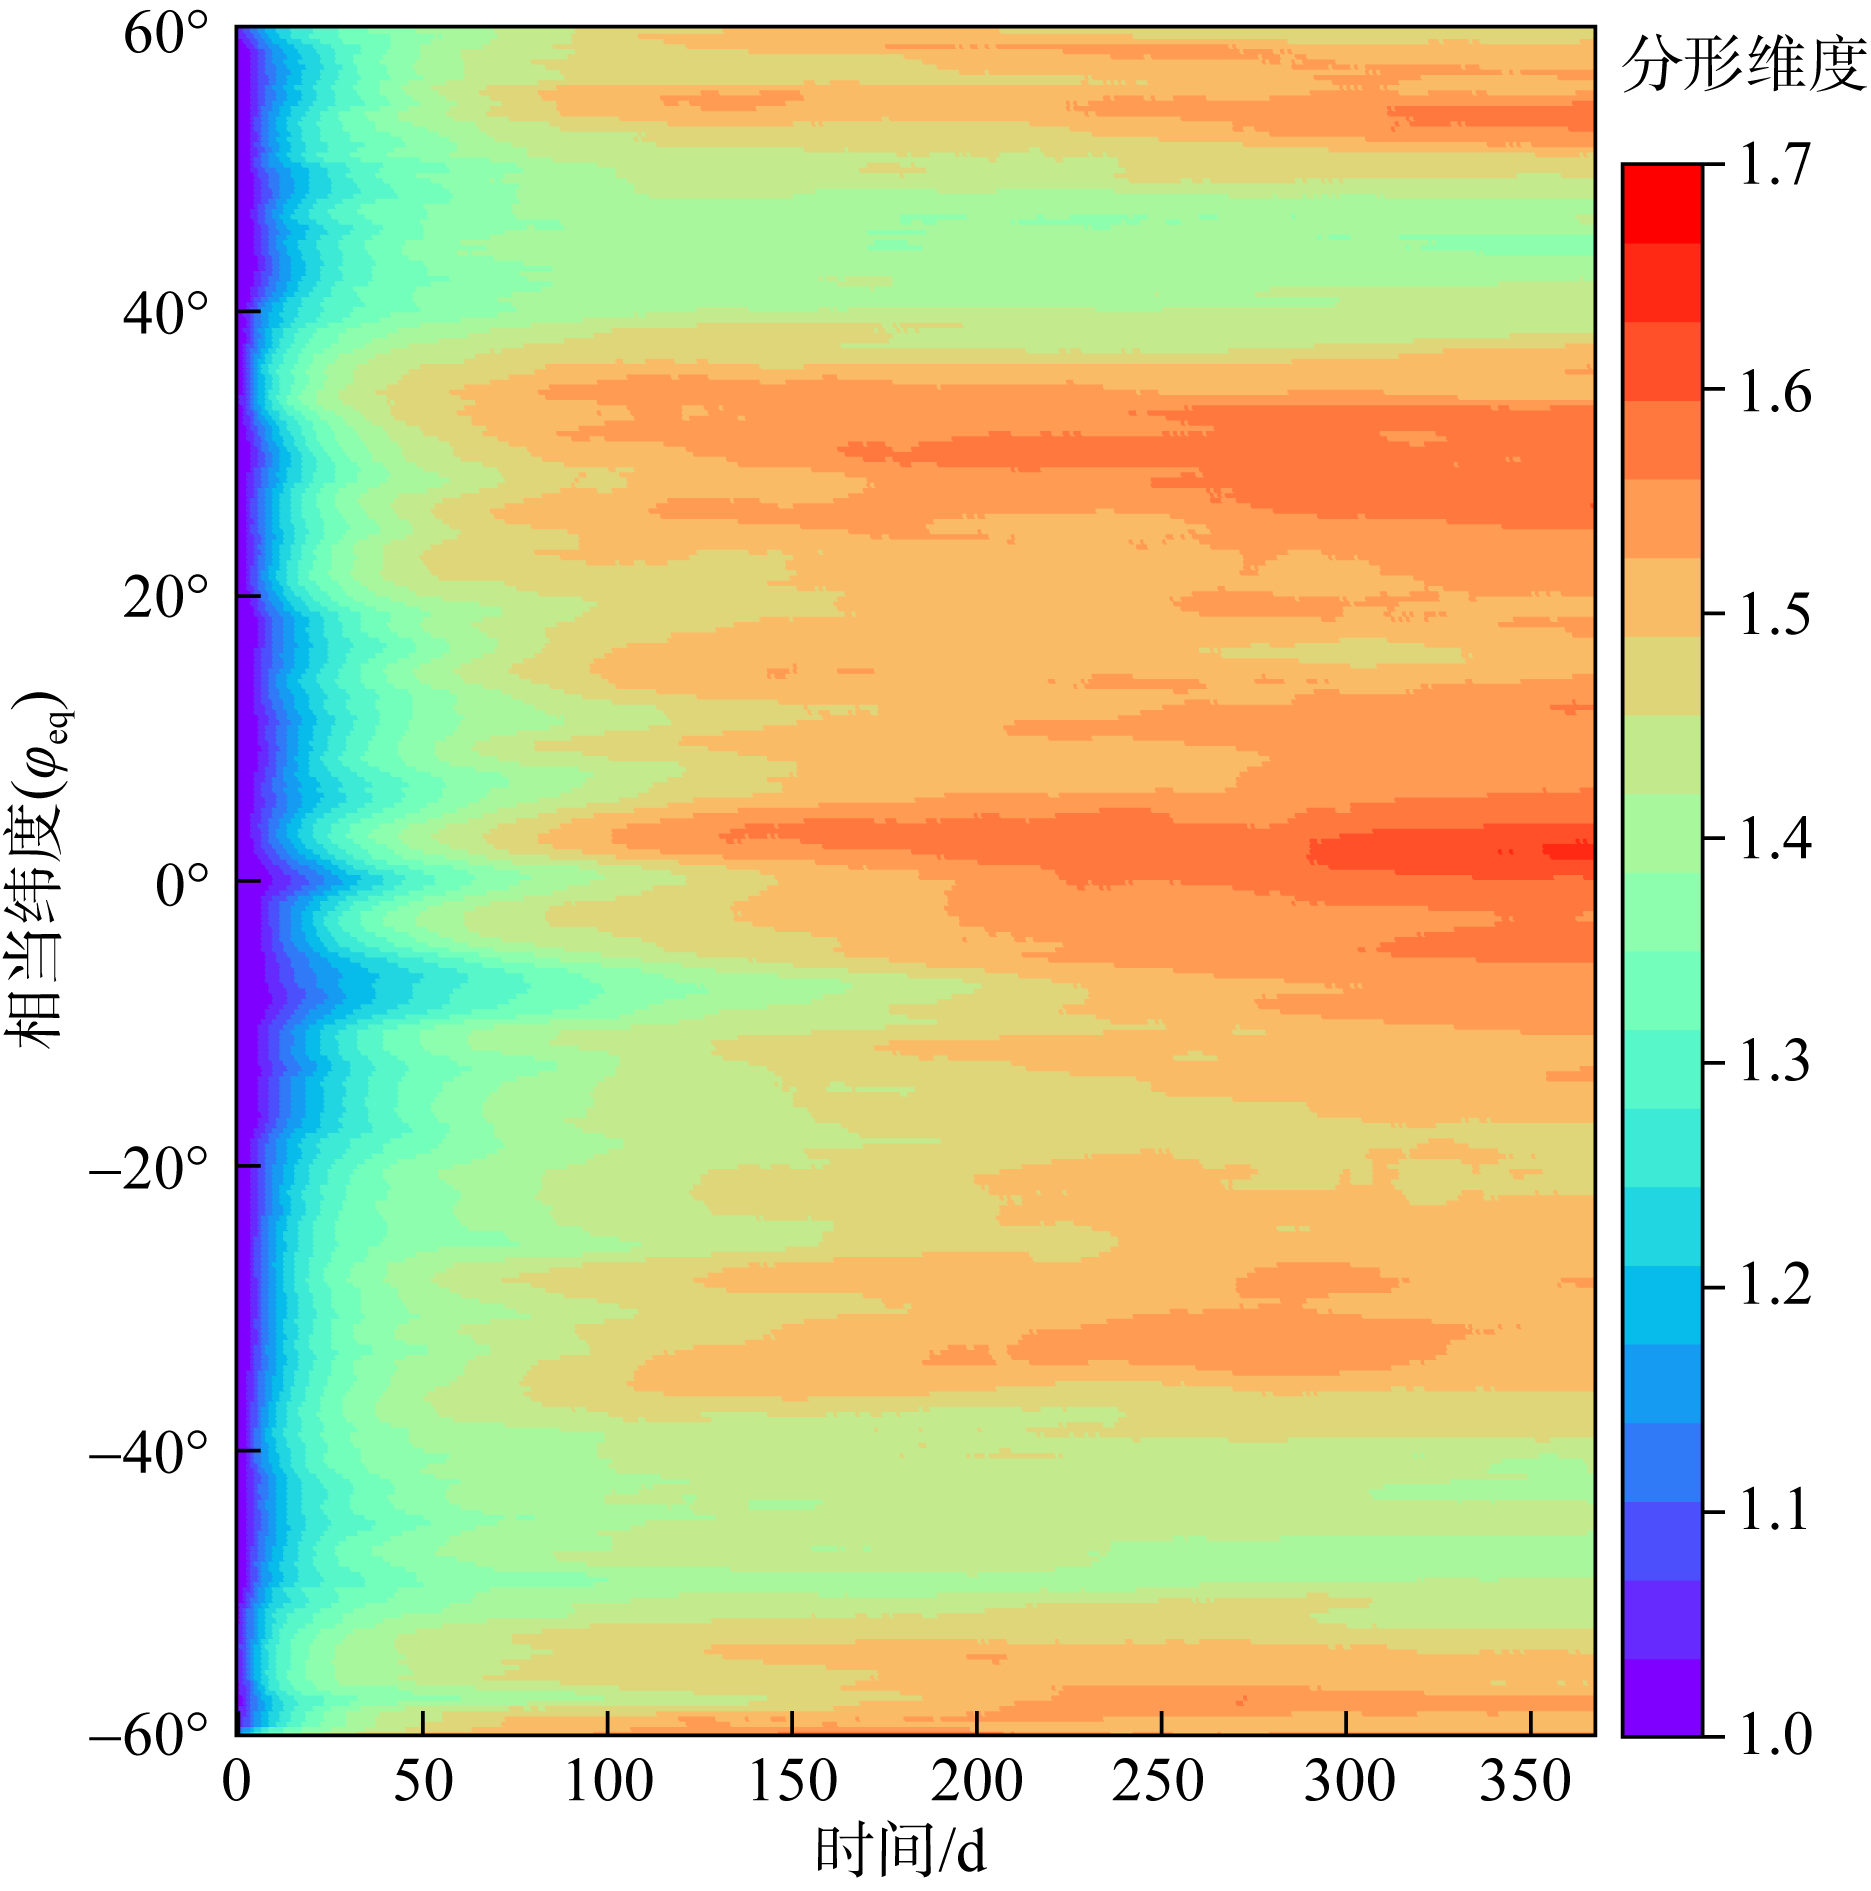
Fig. 10

Fig. 11
Scatter plot of fractal dimension ${{D}_{\text{min}}}$ and mixing efficiency ${{M}_{\text{E}}}$. Panels (a) to (i) are results over different latitude bands. Colors indicates the time (day) relative to the first day. The black lines indicate a least-square linear fit, with residual R and the fitted equation labeled in each panel"
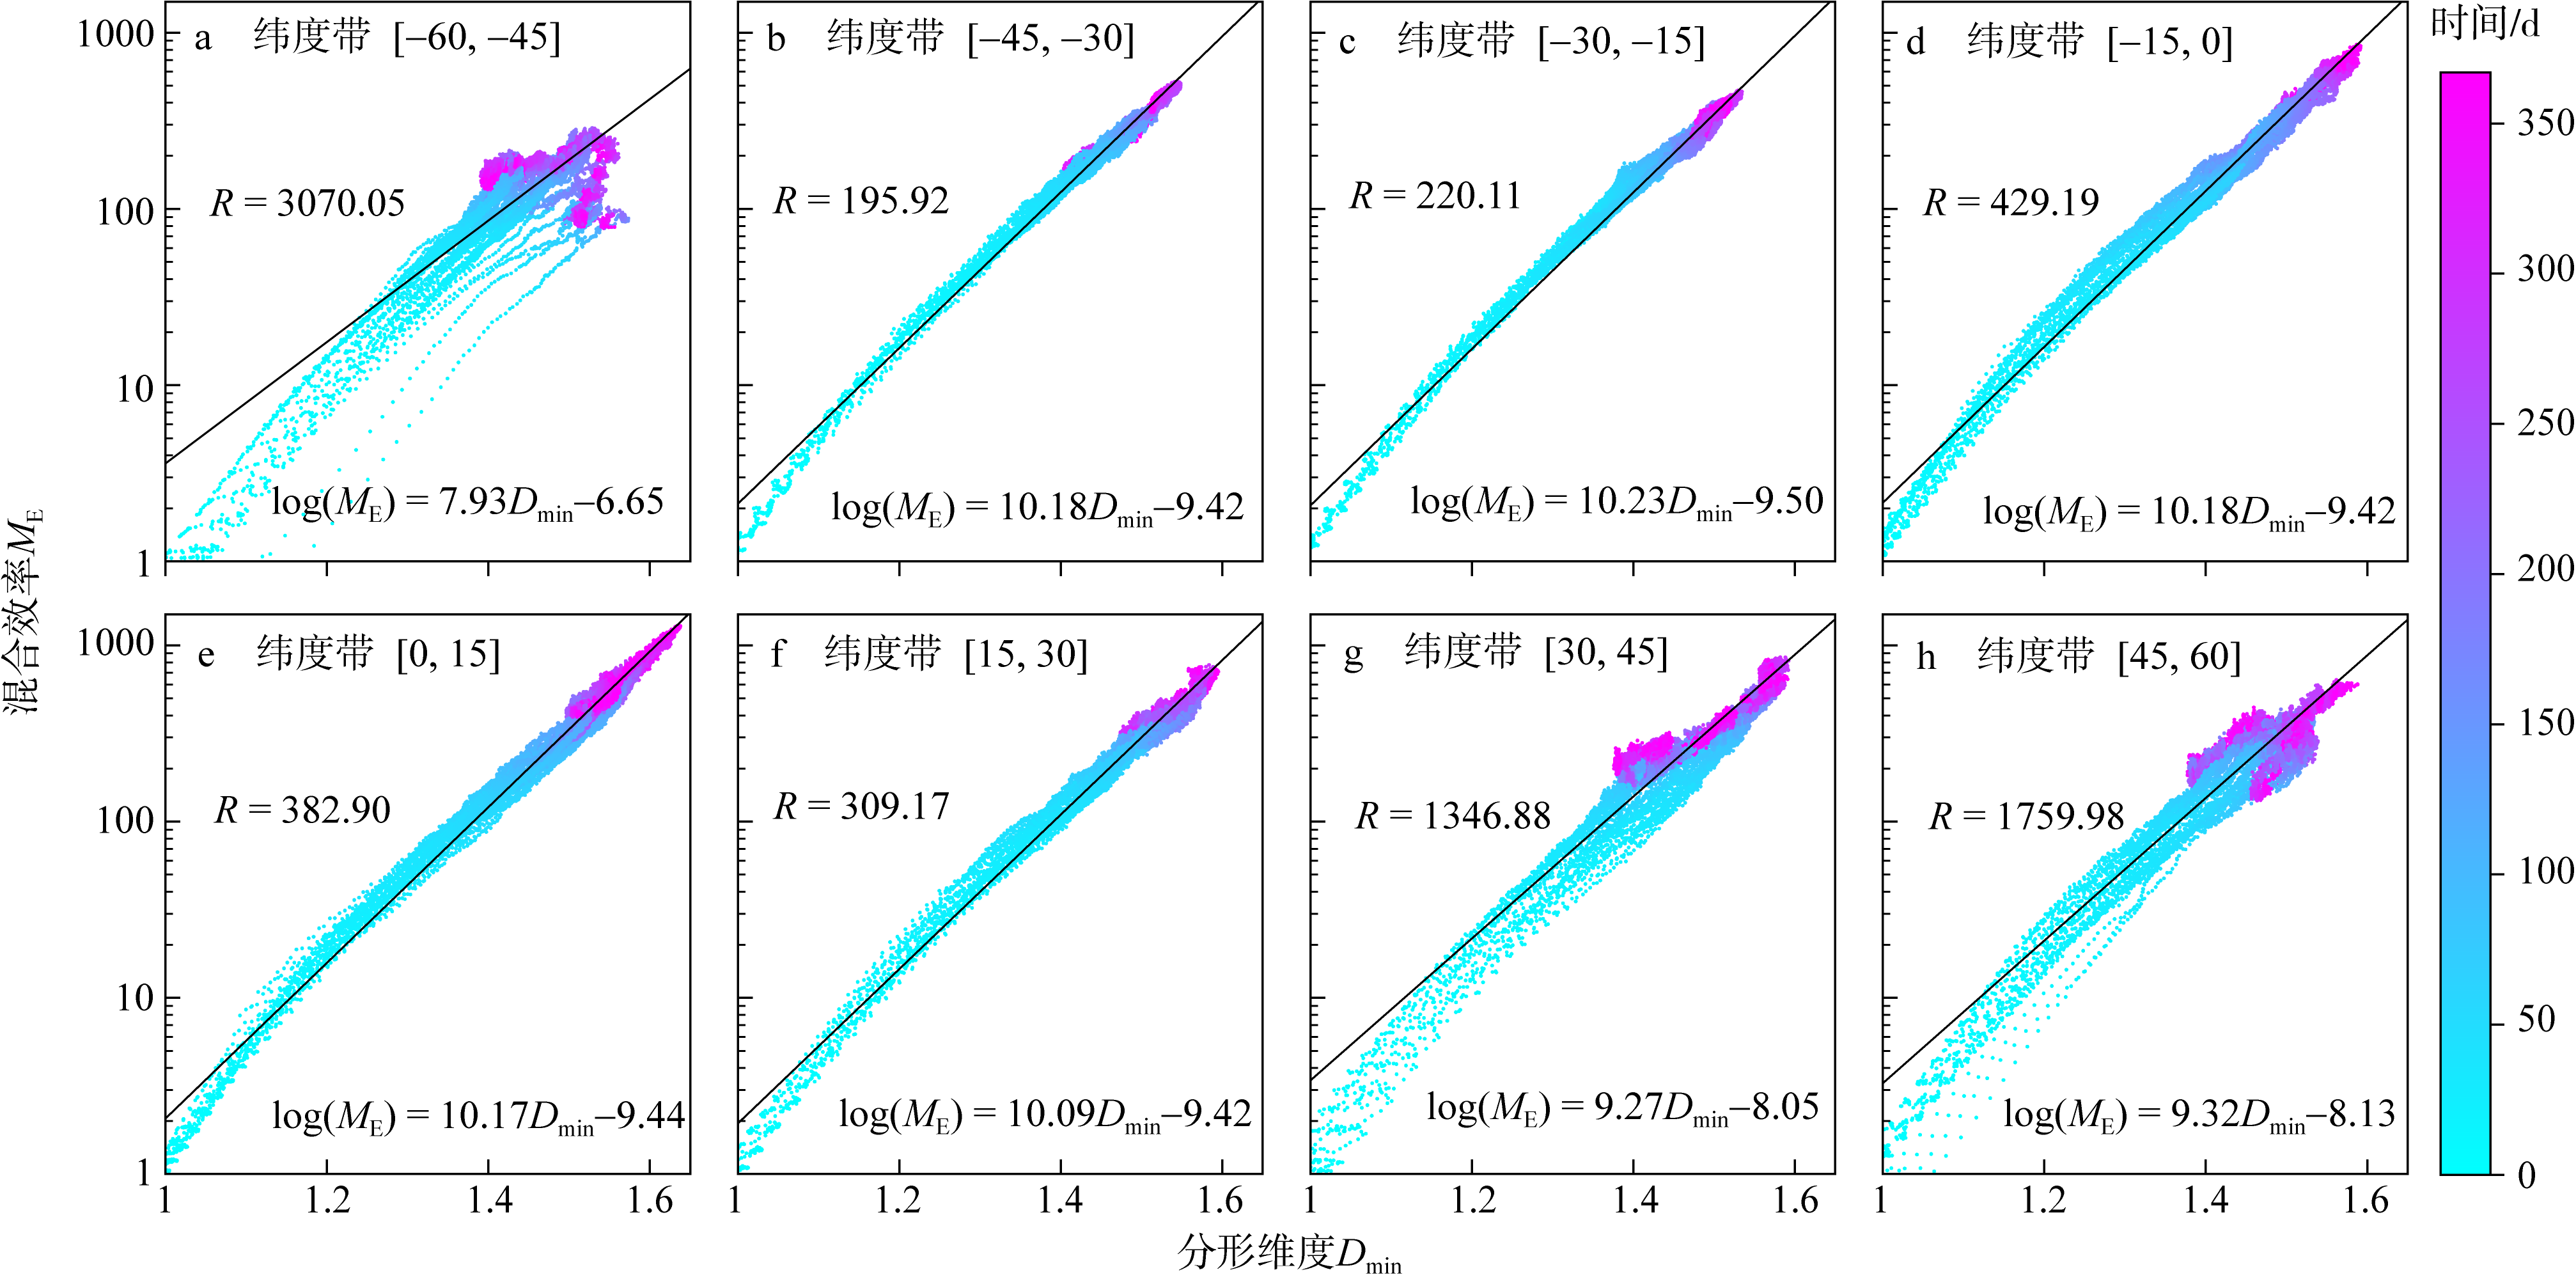
Fig. 11
Tab. 1
Linear fitted coefficients and their standard errors in figure 11 for different latitude bands"
| 纬度范围 | a±stderr | b±stderr | R |
|---|---|---|---|
| 60°S—45°S | 7.93±0.05 | −6.65±0.07 | 3070.05 |
| 45°S—30°S | 10.18±0.01 | −9.42±0.01 | 195.92 |
| 30°S—15°S | 10.23±0.01 | −9.50±0.01 | 220.11 |
| 15°S—0° | 10.18±0.01 | −9.42±0.02 | 429.19 |
| 0°—15°N | 10.17±0.01 | −9.44±0.02 | 382.90 |
| 15°N—30°N | 10.09±0.01 | −9.42±0.02 | 309.17 |
| 30°N—45°N | 9.27±0.02 | −8.05±0.04 | 1346.88 |
| 45°N—60°N | 9.32±0.03 | −8.13±0.04 | 1759.98 |
Tab. 1
| [1] |
付昱华, 2000. 变换形成的分形与海洋环境数据分析预测[J]. 海洋通报, 19(1): 79-88.
|
|
|
|
| [2] |
黄真理, 2000. 湍流的分形特征[J]. 力学进展, 30(4): 581-596.
|
|
|
|
| [3] |
雷玺, 2015. 多重分形在海洋波高数据分析中的应用[D]. 青岛: 中国海洋大学.
|
|
|
|
| [4] |
刘式达, 付遵涛, 刘式适, 2014. 间歇湍流的分形特征——分数维及分数阶导数的应用[J]. 地球物理学报, 57(9): 2751-2755.
doi: 10.6038/cjg20140902 |
|
|
|
| [5] |
沈学会, 陈举华, 2005. 分形与混沌理论在湍流研究中的应用[J]. 河南科技大学学报(自然科学版), 26(1): 27-30.
|
|
|
|
| [6] |
田纪伟, 曹露洁, 楼顺里, 1996. 二维表面波破碎面分形结构[J]. 海洋学报, 18(3): 1-4 (in Chinese).
|
| [7] |
邢元明, 杨磊, 管玉平, 2013. 海表扩散层中气体行为的分子动力学模拟[J]. 热带海洋学报, 32(2): 82-87.
doi: 10.11978/j.issn.1009-5470.2013.02.009 |
|
|
|
| [8] |
|
| [9] |
doi: 10.1029/97GL02954 |
| [10] |
doi: 10.1175/2010JPO4278.1 |
| [11] |
|
| [12] |
|
| [13] |
doi: 10.1029/2000JD900093 |
| [14] |
doi: 10.1016/j.ocemod.2011.11.005 |
| [15] |
|
| [16] |
doi: 10.1103/PhysRevFluids.5.044501 |
| [17] |
|
| [18] |
doi: 10.1029/1999JC900197 |
| [19] |
doi: 10.1007/BF03403502 |
| [20] |
doi: 10.1145/37402.37422 |
| [21] |
doi: 10.1002/grl.v43.2 |
| [22] |
pmid: 17837158 |
| [23] |
doi: 10.1017/S0022112075003047 |
| [24] |
doi: 10.1029/96JC02775 |
| [25] |
doi: 10.1016/j.ocemod.2017.01.001 |
| [26] |
doi: 10.1175/JPO2949.1 |
| [27] |
doi: 10.1007/s10652-010-9184-x |
| [28] |
doi: 10.1175/1520-0469(1996)053<1524:TDMEFA>2.0.CO;2 |
| [29] |
doi: 10.1175/1520-0469(2001)058<3685:ANLAED>2.0.CO;2 |
| [30] |
|
| [31] |
|
| [32] |
doi: 10.1029/1999JC000041 |
| [33] |
|
| [34] |
doi: 10.1357/002224008787157458 |
| [35] |
|
| [36] |
doi: 10.1175/2009JPO4122.1 |
| [37] |
doi: 10.1017/S0022112086001209 |
| [38] |
doi: 10.1175/JPO-D-11-0135.1 |
| [1] | ZHENG Yinggang, ZHANG Hongsheng, LI Xiaolian, ZHANG Zhouhao. Detection algorithm of internal waves in the South China Sea based on boundary characteristics of remote sensing image [J]. Journal of Tropical Oceanography, 2020, 39(6): 41-56. |
| [2] | CHEN Hong-wen, ZENG Fan-cai, WANG Gang-long, LIANG Jian. An improved contour plotting method based on Delaunay Triangulation Network [J]. Journal of Tropical Oceanography, 2013, 32(4): 92-96. |
|
||