
Journal of Tropical Oceanography >
Distribution characteristics and influencing factors of phytoplankton in waters around typical islands in the Pearl River Estuary*
Copy editor: YIN Bo
Received date: 2020-01-15
Request revised date: 2020-04-01
Online published: 2020-04-01
Supported by
Strategic Priority Research Program of the Chinese Academy of Sciences(XDA13020102)
National Key Research and Development Program of China(2017YFC0506302)
National Key Research and Development Program of China(2016YFC0502805)
National Science and Technology Fundamental Resources Investigation Program of China(2018FY100105)
National Natural Science Foundation(41890853)
Key Special Project for Introduced Talents Team of Southern Marine Science and Engineering Guangdong Laboratory (Guangzhou)(GML2019ZD0404)
Copyright
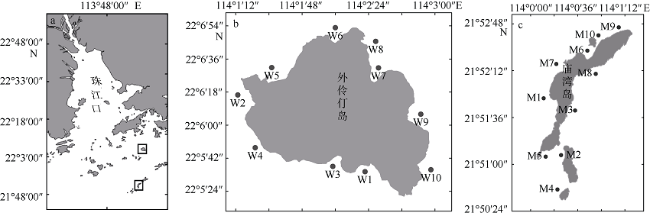
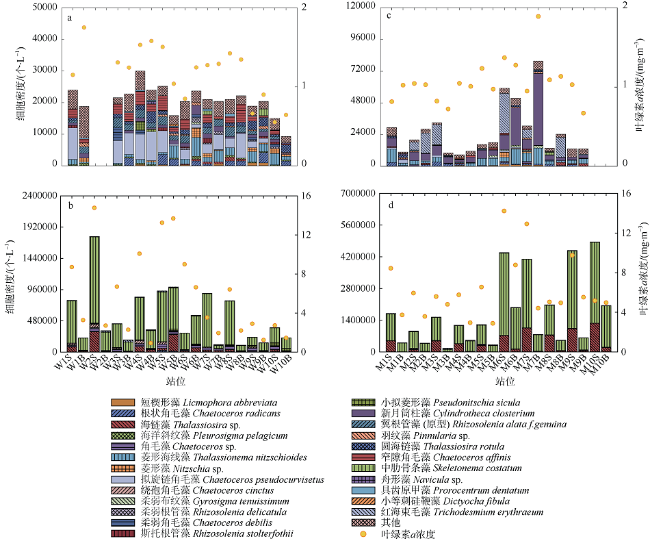
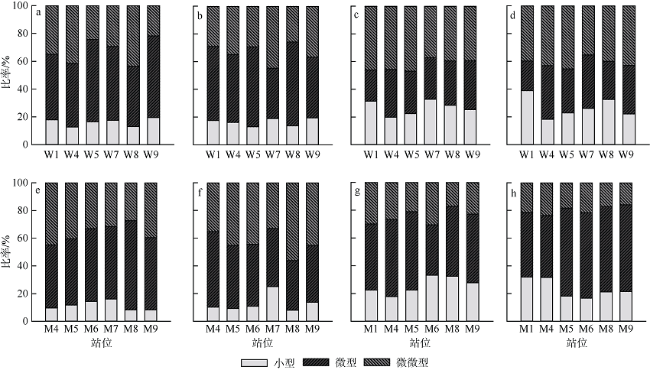
Human activities around the islands are having growing impacts on aquatic ecosystems in the region, with increasing eutrophication and algal bloom events, despite the fact that the development of island tourism has brought considerable economic benefits to the locals. In this paper, we discuss the potential impacts of the Pearl River discharges and human activities on the aquatic ecological status around the natural estuarine islands, based on comparative study of environmental characteristics and phytoplankton distribution in the adjacent waters of representative islands (Miaowan Island, MI; and Wailingding Island, WI) in the Pear River Estuary during the wet season and dry season. In the dry season, 76 and 74 phytoplankton species were found in the waters around WI and MI, with average abundance values of 2.62 × 10 4 and 2.08 × 10 4 cells·L-1, respectively. In the wet season, the numbers of species were 38 and 47, and the average abundance values were 52.91 × 10 4 and 170.57 × 10 4 cells·L-1, respectively. In the wet season, Skeletonema coatatum was the predominated species around both islands, while in the dry season, the dominant species were Chaetoceros affinis in WI and Cylindrotheca closterium in MI. The phytoplankton species diversity indexes of both islands in the dry season were higher than those in the dry season. Nano-phytoplankton was always the most predominated group among three size-fractionated phytoplankton groups, although in the wet season, the contribution of micro-phytoplankton increased from 16.32 % to 26.75 % and from 12.12 % to 24.78 % in MI and WI, respectively. Among the pico-phytoplankton groups, Synechococcus (Syn, ~107 cells·L-1) and eukaryotic pico-phytoplankton (Euk, ~108 cells·L-1) were detected during our investigation. The comparative analysis results with environmental variables showed that the spatial distribution patterns and seasonal variation of phytoplankton were affected by several factors. The seasonal variation was regulated by the intensity and affecting area of Pearl River discharge, the relative salinity and nutrient input. In the wet season, the island shielding effect (ISE) showed significant influences on spatial distribution of phytoplankton abundance around each island, with higher biomass often found in the area facing the Pearl River flow direction; however, the phytoplankton community structure was not significantly affected by the ISE. In the dry season, the horizontal and vertical distributions of phytoplankton showed much smaller variation, and were probably impacted by human activities and intensified vertical mixing.
SU Xinying , ZHONG Yu , LI Yao , TAN Meiting , HUANG Yadong , LIU Shan , XU Xiangrong , SONG Xingyu . Distribution characteristics and influencing factors of phytoplankton in waters around typical islands in the Pearl River Estuary*[J]. Journal of Tropical Oceanography, 2020 , 39(5) : 30 -42 . DOI: 10.11978/2020008
表1 外伶仃岛海域基本环境特征Tab. 1 Environmental characteristics of Wailingding Island |
| 参数平均值 | 枯水期 | 丰水期 | ||||||
|---|---|---|---|---|---|---|---|---|
| 表层 | 底层 | 表层 | 底层 | |||||
| 迎流面 | 背流面 | 迎流面 | 背流面 | 迎流面 | 背流面 | 迎流面 | 背流面 | |
| 温度/℃ | 26.17±0.12 | 26.07±0.05 | 26.13±0.15 | 26.08±0.07 | 28.55±0.13 | 28.56±0.12 | 28.73±0.15 | 28.71±0.10 |
| 26.1±0.09 | 26.1±0.1 | 28.56±0.12 | 28.72±0.11 | |||||
| pH | 8.25±0.15 | 8.25±0.98 | 8.30±0.11 | 8.29±0.65 | 8.51±0.05 | 8.41±0.20 | 8.41±0.41 | 8.37±0.07 |
| 8.25±0.08 | 8.3±0.05 | 8.45±0.16 | 8.39±0.06 | |||||
| 盐度/‰ | 33.44±0.02 | 33.44±0.01 | 33.45±0.15 | 33.45±0.11 | 19.38±0.57 | 24.97±1.60 | 26.86±5.26 | 30.30±1.42 |
| 33.44±0.02 | 33.45±0.01 | 22.73±3.14* | 28.89±3.70 | |||||
| 溶解无机氮浓度/(μmol·L-1) | 22.07±5.20 | 33.45±0.01 | 30.93±7.32 | 17.88±5.84 | 26.27±3.44 | 17.56±5.76 | 17.85±9.57 | 11.11±2.61 |
| 17.02±6.77 | 22.23±8.79* | 21.04±6.53* | 13.81±6.81 | |||||
| 溶解无机磷浓度/(μmol·L-1) | 1.73±0.36 | 0.89±0.33 | 1.86±0.46 | 1.01±0.29 | 0.47±0.15 | 0.46±0.23 | 0.46±0.26 | 0.31±0.03 |
| 1.23±0.51* | 1.29±0.53* | 0.46±0.20 | 0.37±0.17 | |||||
| 硅酸盐浓度/(μmol·L-1) | 159.22±16.93 | 122.82±39.56 | 172.29±21.73 | 127.17±47.03 | 96.15±4.26 | 80.19±27.42 | 56.39±34.90 | 34.37±8.06 |
| 134.96±37.16 | 142.2±44.83 | 86.58±22.18 | 43.18±13.48 | |||||
注: *表示0.01<p<0.05, 迎流面与背流面营养盐分布存在显著性差异 |
表2 珠江口庙湾岛海域基本环境特征Tab. 2 Environmental characteristics of Miaowan Island |
| 参数 平均值 | 枯水期 | 丰水期 | ||||||
|---|---|---|---|---|---|---|---|---|
| 表层 | 底层 | 表层 | 底层 | |||||
| 迎流面 | 背流面 | 迎流面 | 背流面 | 迎流面 | 背流面 | 迎流面 | 背流面 | |
| 温度/°C | 26.45±0.10 | 26.5±0.07 | 26.45±0.10 | 26.48±0.08 | 28.70±0.00 | 28.78±0.16 | 28.56±0.30 | 28.96±0.22 |
| 26.48±0.08 | 26.47±0.09 | 28.76±0.33 | 28.74±0.12* | |||||
| pH | 8.35±0.03 | 8.23±0.03 | 8.37±0.02 | 8.31±0.04 | 8.71±0.54 | 8.69±0.50 | 8.49±0.07 | 8.55±0.48 |
| 8.28±0.07** | 8.34±0.05* | 8.7±0.06 | 8.52±0.05 | |||||
| 盐度‰ | 33.93±0.05 | 33.93±0.11 | 33.94±0.05 | 33.94±0.08 | 21.84±2.59 | 28.21±1.29 | 31.50±1.60 | 32.32±1.20 |
| 33.93±0.01 | 33.94±0.01 | 25.03±1.41** | 31.91±3.88 | |||||
| 溶解无机氮浓度/(μmol·L-1) | 8.25±1.64 | 8.74±2.89 | 10.05±2.18 | 8.56±3.32 | 12.30±3.32 | 4.67±0.77 | 4.12±1.27 | 11.48±2.74 |
| 8.52±2.29 | 9.22±2.81 | 8.46±4.65** | 3.54±1.07 | |||||
| 溶解无机磷浓度/(μmol·L-1) | 0.70±0.16 | 0.59±0.15 | 0.59±0.21 | 0.55±0.18 | 0.17±0.02 | 0.18±0.02 | 0.18±0.02 | 0.31±0.03 |
| 0.64±0.16 | 0.57±0.18 | 0.18±0.02 | 0.17±0.02 | |||||
| 硅酸盐浓度/(μmol·L-1) | 50.47±9.16 | 56.16±2.85 | 57.13±6.37 | 45.75±12.21 | 40.60±8.64 | 17.93±3.60 | 15.90±5.64 | 10.92±2.57 |
| 53.63±6.67 | 50.81±12.91 | 29.27±13.48** | 13.41±4.90 | |||||
注: **表示p<0.01, 表示迎流面与背流面营养盐分布存在极显著差异; *表示0.01<p<0.05, 迎流面与背流面营养盐分布存在显著性差异 |
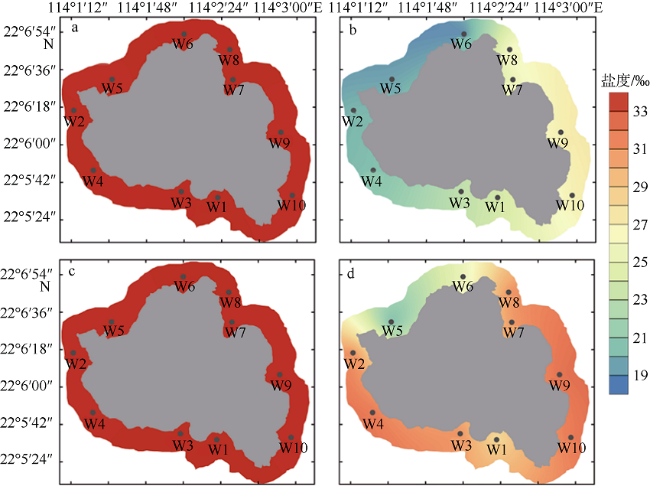
图2 外伶仃岛枯水期(a、c)及丰水期(b、d)盐度平面分布图a、b: 表层; c、d: 底层 Fig. 2 Horizontal distributions of salinity of Wailingding Island during the dry season (a, c) and wet season (b, d). Surface (a, b); and bottom (c, d) |
表3 小型浮游植物优势种Tab. 3 Micro-phytoplankton dominant species |
| 采样点 | 枯水期优势种 | 丰水期优势种 |
|---|---|---|
| 外伶仃岛 | 窄隙角毛藻、拟旋链角毛藻、根状角毛藻、新月筒柱藻、翼根管藻(原型)、菱形海线藻、圆海链藻 | 中肋骨条藻、海链藻、角毛藻、绕孢角毛藻 |
| 庙湾岛 | 新月筒柱藻、根状角毛藻、菱形海线藻、红海束毛藻 | 中肋骨条藻、海链藻 |
表4 微微型浮游植物与环境因子Pearson检验结果Tab. 4 Pearson test results of picophytoplankton and environmental factors |
| 溶解无机氮 | 溶解无机磷 | 硅酸盐 | 温度 | 溶解氧 | pH | 盐度 | N:P | ||
|---|---|---|---|---|---|---|---|---|---|
| 枯水期 | 真核藻 | -0.40* | -0.43 | 0.53** | 0.75** | 0.25 | 0.06 | 0.76** | 0.04 |
| 聚球藻 | 0.04 | -0.01 | -0.04 | 0.37 | -0.29 | -0.23 | 0.28 | 0.09 | |
| 丰水期 | 真核藻 | 0.80** | 0.34* | 0.68** | -0.33* | -0.20 | -0.22 | -0.66** | 0.60** |
| 聚球藻 | 0.86** | 0.37* | 0.72** | -0.47** | 0.15** | 0.15 | -0.86** | 0.80** |
注: **表示在0.01水平(双侧)上显著相关; *表示在0.05水平(双侧)上显著相关。N:P表示溶解无机氮和溶解无机磷的浓度比 |
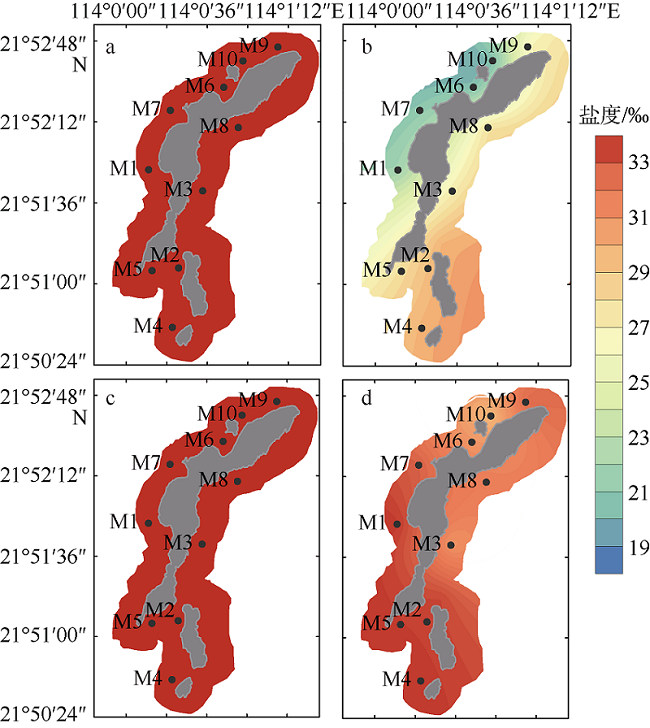
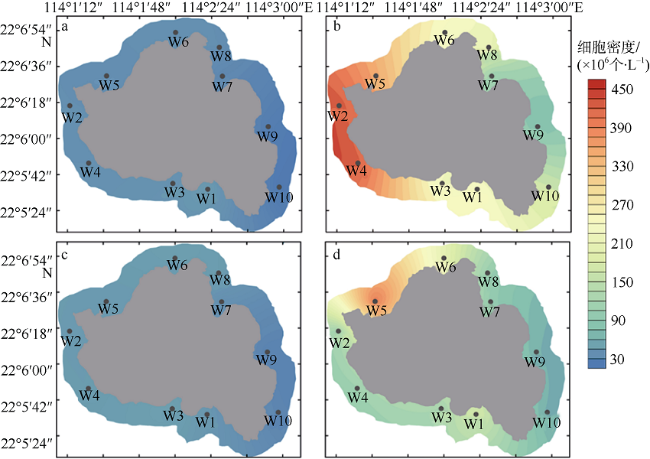
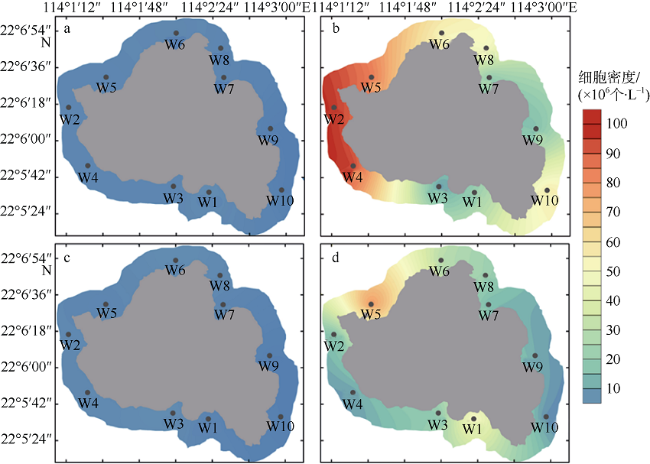
图5 外伶仃岛周边水域枯水期(a、c)及丰水期(b、d)真核藻细胞密度空间分布a、b: 表层; c、d: 底层 Fig. 5 Horizontal distributions of eukaryotic abundance in Wailingding Island during the dry season (a, c) and wet season (b, d). Surface (a, b); bottom (c, d) |
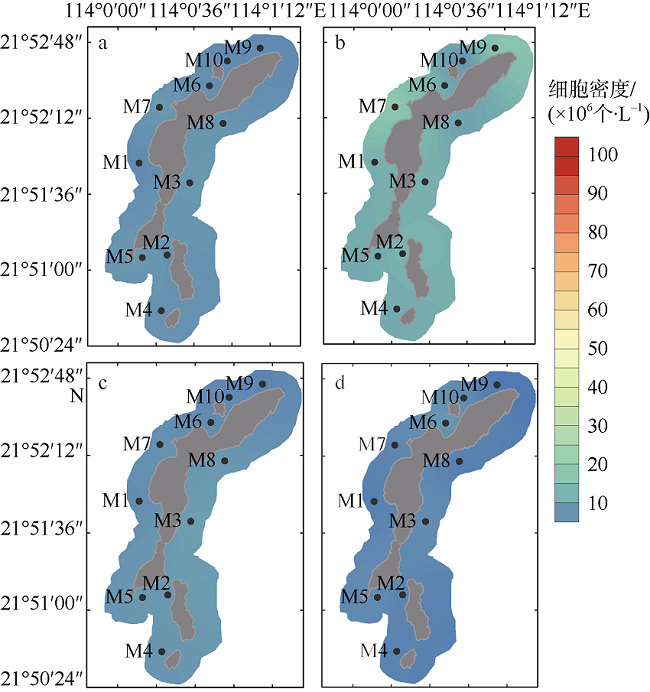
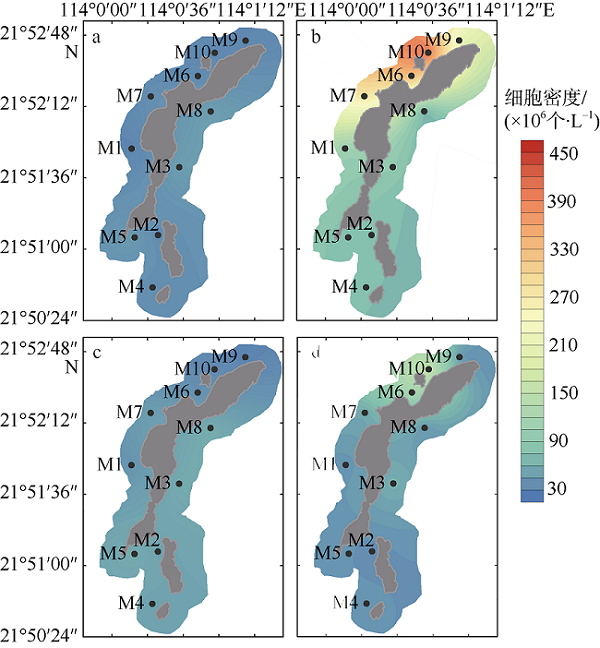
图6 庙湾岛周边水域枯水期(a、c)及丰水期(b、d)真核藻细胞密度空间分布a、b: 表层; c、d: 底层 Fig. 6 Horizontal distributions of eukaryotic abundance of Miaowan Island during the dry season(a, c) and wet season(b, d). Surface (a, b); bottom (c, d) |
图7 外伶仃岛周边水域枯水期(a、c)及丰水期(b、d)聚球藻细胞密度空间分布a、b: 表层; c、d: 底层 Fig. 7 Spatial distribution of Synechococcus abundance of Wailingding Island during the dry season (a, c) and wet season (b, d). Surface (a, b); bottom (c, d) |
| [1] |
蔡昱明, 宁修仁, 刘子琳, 2002. 珠江口初级生产力和新生产力研究[J]. 海洋学报, 24(3):101-111.
|
| [2] |
陈纪新, 2006. 中国亚热带海域超微型浮游生物多样性研究[D]. 厦门: 厦门大学.
|
| [3] |
董燕红, 蔡建东, 钱宏林, 2009. 珠江口海域营养盐比及与浮游植物的关系[J]. 海洋通报, 28(1):3-10.
|
| [4] |
国家海洋局, 2007. GB/T 12763.1-2007 海洋调查规范[S]. 北京: 国家标准出版社(in Chinese).
|
| [5] |
黄良民, 沈萍萍, 刘春杉, 等, 2017. 广东省近海海洋综合调查与评价总报告[M]. 北京: 海洋出版社(in Chinese).
|
| [6] |
黄日辉, 刘韫, 王为, 2016. 广东庙湾岛风化坑的地貌特征及成因[J]. 热带地理, 36(2):284-295.
|
| [7] |
黄少辉, 王伟臣, 2000. 珠海万山群岛海上生态公园建设规划构想[J]. 热带地理, 20(3):228-232.
|
| [8] |
黄晖, 尤丰, 练健生, 等, 2012. 珠江口万山群岛海域造礁石珊瑚群落分布与保护[J]. 海洋通报, 31(2):189-197.
|
| [9] |
李京, 2017. 珠海市外伶仃岛旅游业的可持续发展问题研究[D]. 成都: 西南交通大学.
|
| [10] |
林卫强, 李适宇, 2002. 夏季伶仃洋COD、DO的垂向分布及其影响因素[J]. 中山大学学报(自然科学版), 41(4):82-86.
|
| [11] |
刘华健, 黄良民, 谭烨辉, 等, 2017. 珠江口浮游植物叶绿素a和初级生产力的季节变化及其影响因素[J]. 热带海洋学报, 36(1):81-91.
|
| [12] |
刘胜, 简伟军, 黄良民, 等, 2002. 香港水域浮游植物生物多样性季节演替初探[C]// 第五届全国生物多样性保护与持续利用研讨会论文摘要集. 杭州: 中国生物多样性保护基金会(in Chinese).
|
| [13] |
罗琳, 李适宇, 厉红梅, 2005. 夏季珠江口水域溶解氧的特征及影响因素[J]. 中山大学学报(自然科学版), 44(6):118-122.
|
| [14] |
王东晓, 杜岩, 施平, 2001. 冬季南海温跃层通风的证据[J]. 科学通报, 46(9):758-761 (in Chinese).
|
| [15] |
徐闯, 许永基, 胡嘉镗, 等, 2019. 基于高精度海洋动力模型的珠江口羽状流季节和年际变化规律研究[J]. 热带海洋学报, 38(3):43-52.
|
| [16] |
杨阳, 李锐祥, 朱鹏利, 等, 2014. 珠江冲淡水季节变化及动力成因[J]. 海洋通报, 33(1):36-44.
|
| [17] |
张霞, 黄小平, 施震, 等, 2013. 珠江口超微型浮游植物时空分布及其与环境因子的关系[J]. 生态学报, 33(7):2200-2211.
|
| [18] |
张燕, 夏华永, 钱立兵, 等, 2011. 2006年夏、冬季珠江口附近海域水文特征调查分析[J]. 热带海洋学报, 30(1):20-28.
|
| [19] |
赵春宇, 谭烨辉, 柯志新, 等, 2016. 珠江口赤潮爆发过程中水体及表层沉积物间隙水中营养盐与叶绿素的变化特征[J]. 海洋通报, 35(4):457-466.
|
| [20] |
珠海市人民政府, 2018. 珠海市海洋功能区划(2015—2020年)[EB/OL]. (2018-05-28). http://sswj.zhuhai.gov.cn/zwgk/zcfgjjd/swzcfg/content/post_2032572.html.
|
| [21] |
朱嘉, 刘建辉, 蔡晓琼, 2014. 珠江口外伶仃岛海滩修复研究[J]. 海洋开发与管理, 31(11):36-40 (in Chinese).
|
| [22] |
朱小山, 蔡建东, 董燕红, 等, 2004. 珠江口营养盐比例及其与浮游藻类的关系[C]// 中国赤潮研究与防治(一)-中国海洋学会赤潮研究与防治学术研讨会论文集. 广州: 中国海洋学会, 24 (in Chinese).
|
| [23] |
|
| [24] |
|
| [25] |
|
| [26] |
|
| [27] |
|
| [28] |
|
| [29] |
|
| [30] |
|
| [31] |
|
| [32] |
|
| [33] |
|
| [34] |
|
| [35] |
|
| [36] |
|
/
| 〈 |
|
〉 |
