
Journal of Tropical Oceanography >
Estimating the spatial distribution of heterotrophic bacteria abundance in the Northern South China Sea using remote sensing*
Copy editor: YIN Bo
Received date: 2020-10-30
Request revised date: 2020-12-21
Online published: 2020-12-24
Supported by
National Key Research and Development Projects(2018YFC1406604)
National Natural Science Foundation of China(U1901215)
Key Special Project for Introduced Talents Team of Southern Marine Science and Engineering Guangdong, Laboratory(Guangzhou)(GML2019ZD0305)
Science and Technology Planning Project of Guangdong Province, China(2017B0202017002)
Copyright
Heterotrophic bacteria play an important role in using organic matter, and their abundance indicates eutrophication of water. The conventional methods of monitoring heterotrophic bacteria abundance are highly accurate but time-consuming and laborious; measurements are discrete. Satellite remote sensing technology, characterized by low-cost, large-area synchronization, and long-term repeated observations, is complement with conventional methods. In this study, we use the abundance of heterotrophic bacteria observed during 10 cruises in the northern South China Sea and satellite remote sensing reflectance data to develop an algorithm to estimate heterotrophic bacteria abundance using statistical regression methods. The coefficient of determination of this model is 0.81, the root-mean-square error is 2.44×10⁸ cells·L-1, and the average relative error is 21%. The established model is used for retrieving the abundance of heterotrophic bacteria on the surface of the northern South China Sea. The abundance of heterotrophic bacteria gradually decrease from the Pearl River Estuary to the open sea. The average abundance of heterotrophic bacteria in the estuary area reaches the highest in summer and the lowest in spring. The average bacterial abundance in the coastal waters near the Pearl River Estuary is higher on the west side than on the east side. Bacterial abundance in the shelf area is the highest in winter and lowest in summer; bacterial abundance in the open sea has little variation from season to season.
WANG Jian , CHEN Chuqun , ZHOU Weihua , LI Xiangfu , WU Jie , YE Haibin , TANG Shilin . Estimating the spatial distribution of heterotrophic bacteria abundance in the Northern South China Sea using remote sensing*[J]. Journal of Tropical Oceanography, 2021 , 40(5) : 53 -62 . DOI: 10.11978/2020125
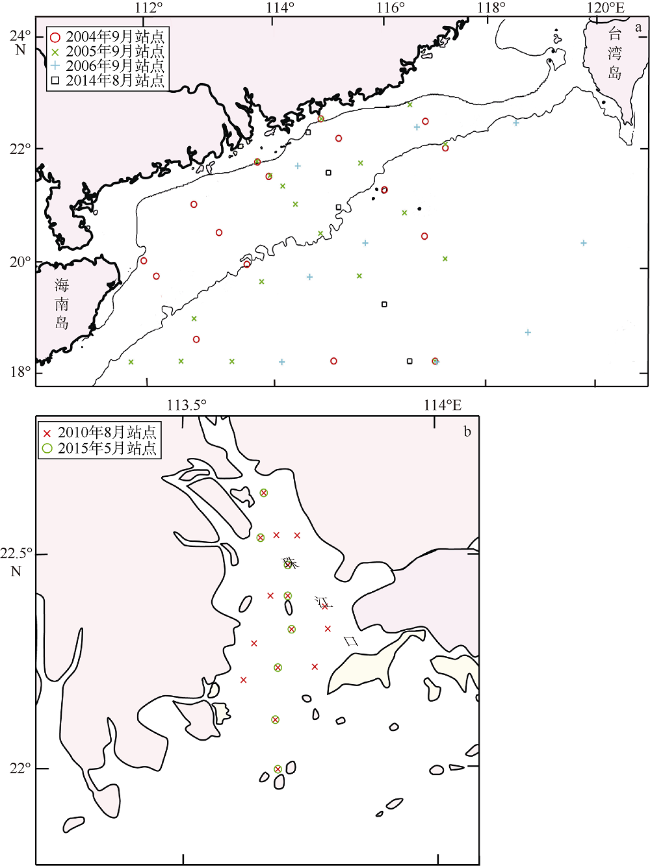
表1 南海北部现场观测数据集Tab. 1 Field observation data in the Northern South China Sea |
| 观测时间 | 站点个数 | 观测量 |
|---|---|---|
| 2010年8月3—8日, 2011年1月6—10日 | 航次观测位置一致, 各16组数据 | HBA, POC, Chl a |
| 2015年5月10—12日, 2015年8月7—11日, 2016年1月10—14日, 2017年6月10—15日 | 航次观测位置一致, 各8组数据 | HBA, Chl a |
| 2004年9月18日—10月3日 | 16组数据 | HBA, POC, Chl a |
| 2005年9月6—22日 | 17组数据 | HBA, Chl a |
| 2006年9月15—27日 | 10组数据 | HBA, Chl a |
| 2014年8月20日 | 5组数据 | HBA |
注: HBA表示异养细菌丰度; POC表示颗粒有机碳浓度; Chl a表示叶绿素a质量浓度 |
表2 较好表现的7种异养细菌丰度与遥感反射率模型Tab. 2 Seven well-performing models of heterotrophic bacteria abundance and remote sensing reflectance |
| 序号 | 模型 | 模型评估 | |||
|---|---|---|---|---|---|
| R2 | RMSE /(×108个·L-1) | MAPD /% | |||
| 1 | $\text{HBA}=8.12\times {{\text{e}}^{({{R}_{\text{rs}}}(551)-{{R}_{\text{rs}}}(412))/({{R}_{\text{rs}}}(551)+{{R}_{\text{rs}}}(412))}}-1.58$ | 0.72 | 3.02 | 30 | |
| 2 | $\text{HBA}=11.75\times {{\text{e}}^{({{R}_{\text{rs}}}(551)-{{R}_{\text{rs}}}(443))/({{R}_{\text{rs}}}(551)+{{R}_{\text{rs}}}(443))}}-3.34$ | 0.71 | 3.16 | 32 | |
| 3 | $\text{HBA}=8.95\times {{\text{e}}^{({{R}_{\text{rs}}}(551)-{{R}_{\text{rs}}}(412))/({{R}_{\text{rs}}}(551)+{{R}_{\text{rs}}}(412))}}-154.4\times {{\text{e}}^{({{R}_{\text{rs}}}(551)-{{R}_{\text{rs}}}(412))}}+151.8$ | 0.76 | 2.83 | 25 | |
| 4 | $\text{HBA}=5.81\times {{\text{e}}^{\text{(}{{R}_{\text{rs}}}(551)-{{R}_{\text{rs}}}(412)\text{)/(}{{R}_{\text{rs}}}(551)+{{R}_{\text{rs}}}(412)\text{)}}}\text{+0}\text{.41}\times {{\text{e}}^{{{R}_{\text{rs}}}(667)/{{R}_{\text{rs}}}(443)}}-0.35$ | 0.81 | 2.44 | 21 | |
| 5 | $\begin{align} & \text{HBA}=11.52\times {{\left[ ({{R}_{\text{rs}}}(531)-{{R}_{\text{rs}}}(443))/({{R}_{\text{rs}}}(531)+{{R}_{\text{rs}}}(443)) \right]}^{2}}+ \\& \ \ \ \ \ \ \ \ \ \ 16.38\times ({{R}_{\text{rs}}}(531)-{{R}_{\text{rs}}}(5443))/({{R}_{\text{rs}}}(531)+{{R}_{\text{rs}}}(443))+5.86 \\\end{align}$ | 0.71 | 3.35 | 35 | |
| 6 | $\begin{align}& \text{HBA}=6.11\times {{\left[ ({{R}_{\text{rs}}}(551)-{{R}_{\text{rs}}}(412))/({{R}_{\text{rs}}}(551)+{{R}_{\text{rs}}}(412)) \right]}^{2}}+ \\& \ \ \ \ \ \ \ \ \ \ 4.18\times ({{R}_{\text{rs}}}(551)-{{R}_{\text{rs}}}(412))/({{R}_{\text{rs}}}(551)+{{R}_{\text{rs}}}(412))+5.89 \\\end{align}$ | 0.75 | 2.95 | 28 | |
| 7 | $\begin{align}& \text{HBA}=11.68\times {{\left[ ({{R}_{\text{rs}}}(551)-{{R}_{\text{rs}}}(443))/({{R}_{\text{rs}}}(551)+{{R}_{\text{rs}}}(443)) \right]}^{2}}+ \\& \ \ \ \ \ \ \ \ \ \ 14.58\times ({{R}_{\text{rs}}}(551)-{{R}_{\text{rs}}}(443))/({{R}_{\text{rs}}}(551)+{{R}_{\text{rs}}}(443))+5.92 \\\end{align}$ | 0.74 | 2.98 | 29 | |
注: HBA表示异养细菌丰度; Rrs(412)、Rrs(443)、Rrs(531)、Rrs(551)、Rrs(667)表示中心波长分别为412nm、443nm、531nm、551nm、667nm的遥感反射率; R2表示确定系数, RMSE表示均方根误差, MAPD表示平均相对误差 |
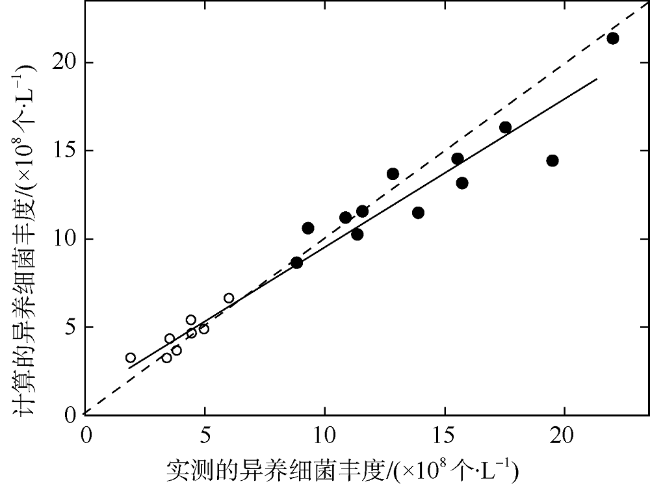
图4 实测异养细菌丰度与计算的异养细菌丰度验证结果图空心圆为陆架和开阔海域的验证点, 实心圆为河口和近岸海域的验证点, 黑色虚线为1:1线, 黑色实线为实测异养细菌丰度与模型计算异养细菌丰度的线性拟合线 Fig. 4 Comparison between measured bacterial abundance and estimated heterotrophic bacterial abundance verification results. The hollow circle are the verification points of the continental shelf and the open sea area, the filled circle are the verification points of the estuary and coastal waters. The black dotted line is the 1:1 line, and the purple solid line is the fitting line |
表3 较好表现的异养细菌丰度与颗粒有机碳浓度、叶绿素a质量浓度模型Tab. 3 Well-performing model of combining heterotrophic bacteria abundance with particle organic carbon concentration, chlorophyll a concentration model |
| 序号 | 模型 | R2 | RMSE/(×108个·L-1) | MAPD / % |
|---|---|---|---|---|
| 1 | lg(HBA)=0.37×lg(POC)+6.07 | 0.78 | 2.66 | 28 |
| 2 | lg(HBA)=0.28×lg(Chl a)+5.88 | 0.76 | 2.43 | 25 |
注: HBA表示异养细菌丰度; POC表示颗粒有机碳浓度; Chl a表示叶绿素a质量浓度。 R2表示确定系数, RMSE表示均方根误差, MAPD表示平均相对误差 |
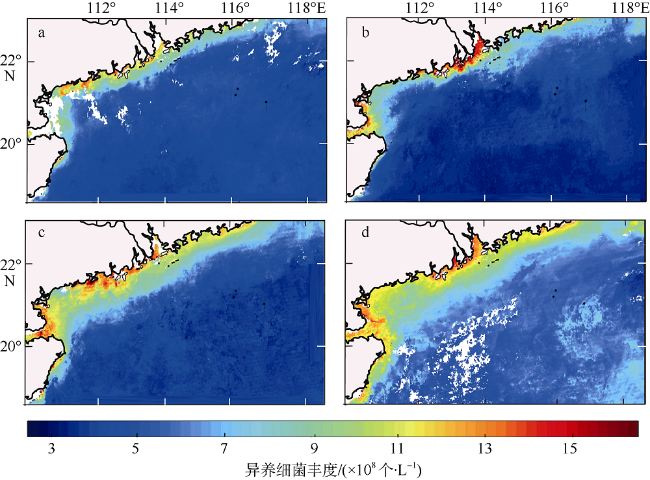
图5 2017年4个季节异养细菌丰度空间分布图a. 春季; b. 夏季; c. 秋季; d. 冬季。基于国家测绘地理信息局标准地图服务网站下载审图号为GS(2016)2924标准地图制作。图中的白色区域为无值区域, 由该地区云对卫星影像遮挡造成 Fig. 5 Spatial distribution of heterotrophic bacteria abundance in four seasons in 2017. (a) spring, (b) summer, (c) autumn, and (d) winter. The white areas appearing in the figure are non-valued areas, which are caused by the cloud blocking the satellite image in the area |
| [1] |
陈楚群, 施平, 毛庆文, 1996. 应用TM数据估算沿岸海水表层叶绿素浓度模型研究[J]. 环境遥感, 11(3):168-176.
|
| [2] |
杜成功, 李云梅, 王桥, 等, 2016. 面向GOCI数据的太湖总磷浓度反演及其日内变化研究[J]. 环境科学, 37(3):862-872.
|
| [3] |
季凤云, 郭立梅, 李洪波, 等, 2017. 南海北部细菌丰度和细菌生产力分布及其与环境因子相关性[J]. 海洋环境科学, 36(3):354-359.
|
| [4] |
荆红梅, 韦誉, 郑丽平, 等, 2018. 三亚海域浮游病毒与细菌丰度的时空变化规律以及相关环境因子[J]. 热带海洋学报, 37(2):36-46.
|
| [5] |
李祥付, 徐杰, 施震, 等, 2018. 珠江口异养细菌时空分布特征及其调控机制[J]. 热带海洋学报, 37(1):27-36.
|
| [6] |
逄淑娜, 朱渭宁, 陈江, 等, 2019. Landsat-8的舟山近岸海域总悬浮物遥感反演与时空变异研究[J]. 光谱学与光谱分析, 39(12):3826-3832.
|
| [7] |
王生福, 宋星宇, 黄良民, 等, 2013. 南海北部夏季浮游细菌生长效率初步研究[J]. 热带海洋学报, 32(6):73-79.
|
| [8] |
张霞, 黄小平, 施震, 等, 2012. 珠江口异养细菌丰度与环境因子的耦合关系[J]. 海洋学报, 34(6):228-237.
|
| [9] |
|
| [10] |
|
| [11] |
|
| [12] |
|
| [13] |
|
| [14] |
|
| [15] |
|
| [16] |
|
| [17] |
|
| [18] |
|
| [19] |
|
| [20] |
|
| [21] |
|
| [22] |
|
| [23] |
|
| [24] |
|
| [25] |
|
| [26] |
|
| [27] |
|
| [28] |
|
| [29] |
|
| [30] |
|
| [31] |
|
| [32] |
|
| [33] |
|
| [34] |
|
/
| 〈 |
|
〉 |
