Marine Biology

Study on stable isotopes of carbon and nitrogen of main fishery organisms in the southwestern waters of Daya Bay, South China Sea in winter 2020

  • ZHANG Wanru , 1, 2 ,
  • LIU Qingxia 2, 3 ,
  • HUANG Honghui , 1, 2, 3 ,
  • QIN Xiaoqing 2 ,
  • LI Jiajun 2 ,
  • CHEN Jianhua , 1
Expand
  • 1. Jiangsu Ocean University, School of Marine Science and Fisheries, Lianyungang 222005, China
  • 2. South China Sea Fisheries Research Institute, Chinese Academy of Fishery Sciences, Guangdong Provincial Key Laboratory of Fishery Ecology and Environment, Guangzhou 510300, China
  • 3. Southern Marine Science and Engineering Guangdong Laboratory (Guangzhou), Guangzhou 511485, China
HUANG Honghui, email: ; CHEN Jianhua, email:

Copy editor: LIN Qiang

Received date: 2021-08-25

  Revised date: 2021-12-02

  Online published: 2021-12-13

Supported by

National Key Research and Development Program of China(2018YFC1407501)

Key Special Project for Introduced Talents Team of Southern Marine Science and Engineering Guangdong Laboratory (Guangzhou)(GML2019ZD0402)

Guangdong Provincial Science and technology plan project(2020B1212060001)

Central Public-interest Scientific Institution Basal Research Fund, CAFS(2020TD15)

Central Public-interest Scientific Institution Basal Research Fund, South China Sea Fisheries Research Institute, CAFS(2021SD03)

Financial Fund of the Ministry of Agriculture and Rural Affairs, P.R. China(NFZX2021)

Abstract

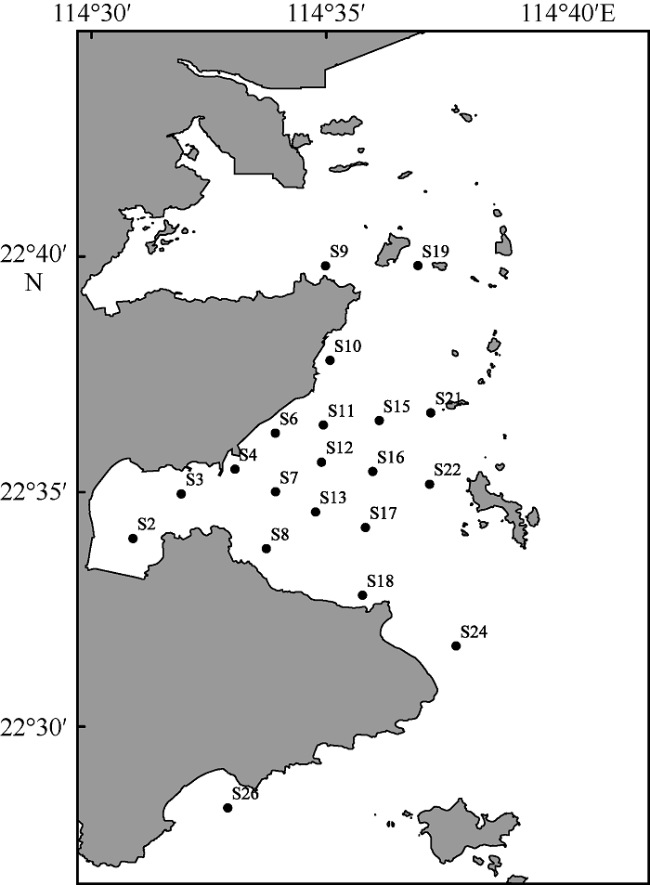
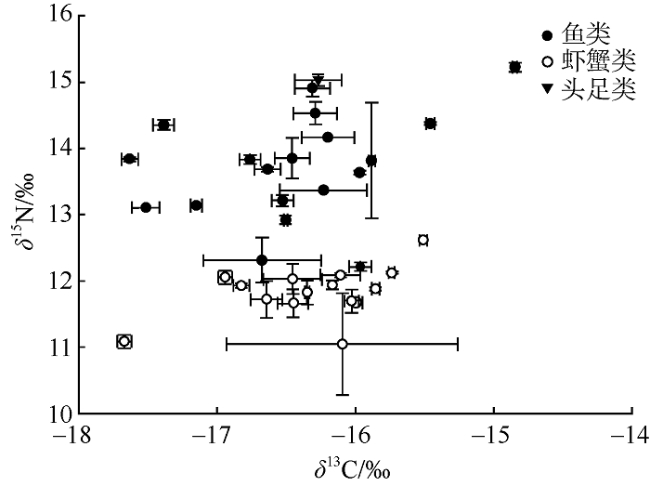
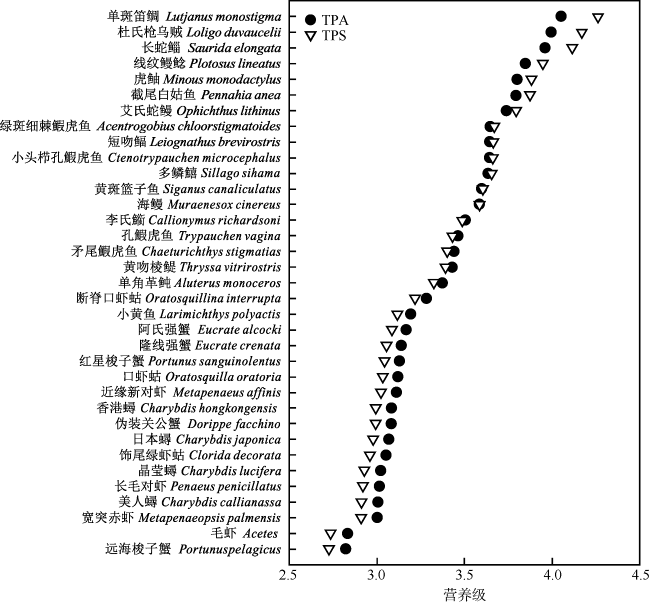
To understand the trophic structure of food webs in the southwestern waters of Daya Bay, 35 fishery organisms were collected by bottom trawl in January 2020, and the stable isotopes of carbon and nitrogen (δ13C and δ15N) of the fishery organisms were analyzed. Based on the stable isotopes of carbon and nitrogen, six quantitative ecological indicators for nutritional structure of the food web and the trophic levels of the main fishery organisms were calculated; and a continuous nutrition spectrum was made. Most of the fishery organisms captured were fish, crabs and shrimp. The δ13C and δ15N values were -17.63‰ to -14.85‰ and 12.92‰ to 15.46‰ for fishes, respectively, with average values being -16.47‰ and 13.80‰. They were -17.67‰ to -15.51‰ and 11.05‰ to 12.62‰ for shrimp and crabs, with average values of -16.30‰ and 11.85‰, respectively. According to the value of δ15N, the trophic levels of the main fishery organisms were calculated using the additive model (trophic position by the additive model, TPA) and the scaled model (trophic position by the scaled model, TPS). The result showed that there was no significant differences between the results calculated by the two models (P > 0.1), and the average trophic level of fish was higher than that of shrimp and crabs. This study indicates the food web in the southwestern waters of Daya Bay is characterized by a relatively simple initial food source, few trophic levels, short food chain, low trophic level diversity, and high degree of redundancy in trophic structure. The abundance of organisms with high trophic levels decreased, and the structure of the food web shifted from complex to simplistic, and the ecosystem became less stable in the past 30 years. The study adds new basic information about the food web structure in the study area. It also provides a reference for protecting the fishery resources of Daya Bay and maintaining the stability of the ecosystem structure there.

Cite this article

ZHANG Wanru , LIU Qingxia , HUANG Honghui , QIN Xiaoqing , LI Jiajun , CHEN Jianhua . Study on stable isotopes of carbon and nitrogen of main fishery organisms in the southwestern waters of Daya Bay, South China Sea in winter 2020[J]. Journal of Tropical Oceanography, 2022 , 41(3) : 147 -155 . DOI: 10.11978/2021108

营养关系是生态系统结构和功能形成的基础, 决定食物网和生态系统的稳定性。明确海洋生物所处的营养级可反映群落结构与功能的变化, 是研究海洋食物网营养关系的关键, 也是评价海洋生态系统稳定性的重要依据(Pauly et al, 2001)。稳定同位素作为一种天然示踪物, 是研究海洋生态系统食物网结构及营养关系的重要手段之一(Hobson et al, 2002; Jackson et al, 2012; 张文博 等, 2019)。由于消费者碳稳定同位素比值与其饵料同位素比值相接近, 因此可用其判断生物的食物来源(张硕 等, 2019); 氮稳定同位素在捕食者和其食物之间以平均3.4‰的差值递减, 可以用来判断生物在食物网中的营养位置(徐军 等, 2010)。相比传统的胃含物分析法, 稳定同位素具有检测灵敏度高, 不受时间和空间限制的特点(王玉堃, 2015), 具有一定的技术优势。近年来, 越来越多的国内外学者利用稳定同位素技术开展海洋生态系统营养结构研究, 取得了大量的研究成果。例如张文博 等(2019)研究了亚热带海湾海陵湾和陵水湾主要渔业生物的碳、氮稳定同位素比值, 发现陵水湾比海陵湾食物链长, 食物网多样性高; 黄佳兴 等(2019)应用碳氮稳定同位素构建了南海中西部渔场主要渔业生物营养级的连续营养谱; 谢斌 等(2017)利用该技术研究了海州湾海洋牧场海域碳源对食物网的贡献和营养结构特征, 并揭示了该海域群落营养结构存在季节差异, 夏季群落营养结构冗余度小于春季, 且食源多样性水平高于春季; Ying等(2020)对大亚湾三个主要功能群进行稳定同位素分析并评估营养相互作用, 发现大亚湾的浮游—底栖耦合效应很强, 且具有季节性动态; McMeans等(2013)利用稳定同位素技术解析坎伯来海峡的食物网结构, 并揭示了由于气候变化造成的大型藻类和浮游植物的变化会影响食物网结构的稳定性; Bode等(2018)应用稳定同位素技术计算了比斯开湾1998—2014年间春天沙丁鱼(Sardina pilchardus)的营养级, 并分析了赤潮暴发和沙丁鱼生物量减少对其营养位置的影响。
海湾是陆地与海域相接的半封闭性海域, 受陆地和人类活动影响较大, 人类生活、海水养殖、工程建设等都可直接或间接对海湾生态环境产生影响, 进而影响其生态系统的稳定性(黄小平, 2019)。大亚湾是我国南部沿岸极具代表性的亚热带封闭性海湾, 位于珠江口东侧, 面积约600km2, 蕴含着丰富的渔业资源。近三十年来, 各类工厂、养殖业的兴起导致大亚湾生态环境发生明显变化, 海洋由贫营养转变为富营养状态, 重金属和有机物污染加重, 赤潮时有发生, 生物多样性降低(王友绍 等, 2004; 牟新悦 等, 2017; 杨文超 等, 2020), 鱼类资源量也有所下降, 群落结构由复杂化向简单化演变, 生态系统稳定性下降(黄小平 等, 2019)。因此, 有必要对该海域食物网的营养结构进行分析。本研究应用碳氮稳定同位素示踪技术分析了大亚湾西南海域主要渔业生物的碳氮稳定同位素组成, 得出主要渔业生物的营养结构特征, 为保护大亚湾渔业资源, 维持生态系统结构的稳定性提供基础资料。

1 材料与方法

1.1 样品采集

本研究样品来自2020年1月在大亚湾西南海域进行的底层单拖网调查, 租用的渔船为“粤汕尾渔11092”。调查船使用的网具为扒罟网, 其中网身长2.50m, 网口目大40mm, 网囊目大2.5mm, 平均拖速2.8kn, 每次拖曳时间35~55min, 采样站位详情见图1。所有样品采集后用密封袋装好并进行现场低温冷冻保存, 带回实验室后进行鉴定, 随机选取生物样品进行分析, 每种2尾。基线生物浮游动物样品用浅水Ⅱ型网(网目160μm)采集, 采集后除杂质, 然后置于用醋酸纤维膜(0.45μm)过滤后的海水中进行肠道排空(5h)。排空结束后, 参照Zhou等(2015)的方法, 将浮游动物分粒级处理, 处理结束后将不同粒级浮游动物冷冻保存并带回实验室进行取样分析。
图1 大亚湾西南海域采样站点图

该图基于国家测绘地理信息局标准地图服务网站下载的审图号为GS(2019)3266号的标准地图制作

Fig. 1 Sampling sites in the southwestern waters of Daya Bay

1.2 样品处理

鱼类样品取其背部白色肌肉, 蟹类去壳取第一螯足肌肉, 头足类取胴体肌肉, 每个样品取两个平行。所有样品经冷冻干燥48h后, 然后使用研钵对样品进行研磨, 研磨后的样品使用80目的筛绢过筛, 最后置于干燥器中保存待测。

1.3 稳定同位素测定

样品分析采用元素分析仪(Flash 2000, Thermo Scientific, Germany)与同位素质谱仪(Delta V, Thermo Scientific, Germany)联用技术测定碳氮稳定同位素组成, 仪器分析误差小于0.15‰。以蛋白质标准物质B2155-114859(Elemental Microanalysis Ltd)(δ13C= -26.98‰、δ15N= 5.94‰)为参考标准, 样品测定误差均小于0.15‰。碳氮的稳定同位素比值以国际通用的δ值表示:
$\delta \text{X}(‰)=\left[ \left( {{{R}_{\text{sample}}}}/{{{R}_{\text{standard}}}-1}\; \right) \right]\times 1000$
式中, X代表13C或15N, Rsample表示所测得的同位素比值(13C/12C或15N/14N)。所有样品的δ13C和δ15N值均在中国科学院南海海洋研究所分析完成。

1.4 数据处理与分析

本研究采用两种模型对大亚湾西南海域主要渔业生物的营养级进行估算, 分别为传统的相加模型(position by the additive model, TPA)和较新的缩比模型(position by the scaled model, TPS) (Post, 2002; Zanden et al, 2007; Hussey et al, 2014)。
运用TPA模型计算生物营养级公式如下所示:
$\text{TPA}={\lambda +\left( {{\delta }^{15}}{{\text{N}}_{\text{consumer}}}-{{\delta }^{15}}{{\text{N}}_{\text{baseline}}} \right)}/{\Delta {{\delta }^{15}}N}\;$
式中, δ15Nconsumer为渔业生物样品的δ15N; Δδ15N为营养级传递过程中δ15N的富集值, 每个营养级的平均值约为3.4‰; δ15Nbaseline为基线生物的δ15N (λ=1时, δ15Nbaseline为生产者的δ15N值; λ=2时, δ15Nbaseline为初级消费者的δ15N值)(Post, 2002; Zanden et al, 2007)。本研究选取中型浮游动物(160~600μm)作为基线生物(Bode et al, 2018), δ15Nbaseline取值为8.25‰, λ取值为2, 用来计算大亚湾西南海域主要渔业生物的营养级。
运用TPS模型计算生物营养级, 其公式为
$\text{TPS}={2+\left[ \begin{align} & \log \left( {{\delta }^{15}}{{\text{N}}_{\lim }}+{{\delta }^{15}}{{\text{N}}_{\text{baseline}}} \right) \\ & -\log \left( {{\delta }^{15}}{{\text{N}}_{\lim }}-{{\delta }^{15}}{{\text{N}}_{\text{consumer}}} \right) \\ \end{align} \right]}/{k}\;$
该模型认为, 随营养级的增加, 相邻营养级之间的Δδ15N值逐渐减小, 生物体δ15N值存在理论上的极大值(Hussey et al, 2014)。式中, δ15Nlim表示生物体δ15N的极大值(saturating isotope limit), k表示δ15Nconsumer接近δ15Nlim的速率常数。本研究参考Hussey等(2014)和Bode等(2018), δ15Nlimk值分别取21.926和0.137。
本研究还分别以δ13C和δ15N值为横、纵坐标, 绘制了主要渔业生物的δ13C-δ15N双位图, 并以此计算基于稳定同位素量化的6个营养结构群落范围指标(Layman et al, 2007)。

2 结果

2.1 碳氮稳定同位素特征

本研究测定了35种渔业生物的稳定同位素值, 其中鱼类18种, 虾蟹类16种, 头足类1种, 详情见表1。稳定同位素结果显示, 大亚湾西南海域主要渔业生物中δ13C的范围是-14.85‰~-17.67‰, 平均值为-16.38‰, 总跨度2.83‰, 显示该研究海域食物网初始食物来源比较单一; 其中毛虾(Acetes)最低, 为-17.67‰; 单斑笛鲷(Lutjanus monostigma)最高, 为-14.85‰。δ15N的范围是11.05‰~15.23‰, 平均值为12.94‰, 总跨度为4.18‰; 其中远海梭子蟹(Portunus pelagicus)最低, 为11.05‰; 单斑笛鲷最高, 为15.23‰。以δ13C和δ15N值为横、纵坐标, 绘制渔业生物的δ13C-δ15N值的双位图(图2)。
表1 大亚湾西南海域主要渔业生物的碳稳定同位素比值、氮同位素比值、长度范围和营养级(n=2)

Tab. 1 Stable isotope ratios of δ13C and δ15N, length range and trophic level (TL) of major fishery organisms in the southwestern waters of Daya Bay (n=2)

种类 δ13C/‰ δ15N/‰ 长度范围/mm 营养级
TPA TPS
鱼类 多鳞鱚 Sillago sihama -15.88 13.82 120~170 3.64 3.66
单角革鲀 Aluterus monoceros -16.50 12.92 3.37 3.32
黄斑篮子鱼 Siganus canaliculatus -16.63 13.69 167~176 3.60 3.61
小头栉孔鰕虎鱼 Ctenotrypauchen microcephalus -16.76 13.83 65~69 3.64 3.66
小黄鱼 Larimichthys polyactis -16.67 12.31 116~148 3.19 3.12
绿斑细棘鰕虎鱼 Acentrogobius chloorstigmatoides -16.46 13.85 3.65 3.67
孔鰕虎鱼 Trypauchen vagina -16.53 13.22 89~100 3.46 3.43
矛尾鰕虎鱼 Chaeturichthys stigmatias -17.15 13.14 94~178 3.44 3.40
虎鲉 Minous monodactylus -15.46 14.38 3.80 3.88
黄吻棱鳀 Thryssa vitrirostris -17.52 13.11 3.43 3.39
李氏䲗 Callionymus richardsoni -16.23 13.37 70~91 3.51 3.49
海鳗 Muraenesox cinereus -15.97 13.64 98~120 3.58 3.59
短吻鲾 Leiognathus brevirostris -17.63 13.84 44~59 3.64 3.67
截尾白姑鱼 Pennahia anea -17.39 14.36 145 3.80 3.88
线纹鳗鲶 Plotosus lineatus -16.29 14.53 21~215 3.85 3.95
长蛇鲻 Saurida elongata -16.31 14.91 185~233 3.96 4.12
艾氏蛇鳗 Ophichthus lithinus -16.20 14.17 185~260 3.74 3.80
单斑笛鲷 Lutjanus monostigma -14.85 15.23 4.05 4.26
虾蟹类 远海梭子蟹 Portunus pelagicus -16.09 11.05 2.82 2.73
红星梭子蟹 Portunus sanguinolentus -16.11 12.09 3.13 3.04
晶莹蟳 Charybdis lucifera -16.64 11.72 3.02 2.93
伪装关公蟹 Dorippe facchino -16.83 11.93 3.08 2.99
香港蟳 Charybdis hongkongensis -16.17 11.94 3.08 3.00
隆线强蟹 Eucrate crenata -15.73 12.12 3.14 3.05
美人蟳 Charybdis callianassa -15.99 11.67 3.01 2.91
阿氏强蟹 Eucrate alcocki -15.96 12.22 3.17 3.09
日本蟳 Charybdis japonica -15.85 11.88 3.07 2.98
口虾蛄 Oratosquilla oratori -16.94 12.06 3.12 3.04
饰尾绿虾蛄 Clorida decorata -16.35 11.83 3.05 2.96
断脊口虾蛄 Oratosquillina interrupta -15.51 12.62 3.28 3.22
近缘新对虾 Metapenaeus affinis -16.45 12.03 3.11 3.03
长毛对虾 Penaeus penicillatus -16.03 11.70 3.01 2.92
宽突赤虾 Metapenaeopsis palmensis -16.45 11.66 3.00 2.91
毛虾 Acetes -17.67 11.08 2.83 2.73
头足类 杜氏枪乌贼 Loligo duvaucelii -16.27 15.03 30~200 3.99 4.17
图2 大亚湾西南海域主要渔业生物的δ13C和δ15N值双位图[平均值±标准偏差(n=2)]

Fig. 2 Stable isotope biplot of δ13C and δ15N of major fishery organisms in the southwestern waters of Daya Bay [Means±SD (n=2)]

2.2 营养级及连续营养谱

本研究运用TPA模型和TPS模型分别计算了大亚湾西南海域主要渔业生物的营养级, 并绘制其连续营养谱, 详情见表1图3。对TPA模型和TPS模型计算所得营养级结果进行比较, 发现两者差异性不显著(P>0.1)。运用TPA模型计算得出, 大亚湾西南海域鱼类营养级范围为3.19~4.05, 平均值为3.63, 最高的是单斑笛鲷, 最低的是小黄鱼(Larimichthys polyactis); 虾蟹类营养级范围为2.82~3.28, 平均值为3.12, 最高的是断脊口虾蛄 (Oratosquillina interrupta), 最低的是远海梭子蟹; 头足类仅一种为杜氏枪乌贼(Loligo duvaucelii), 其营养级为3.99。单因素方差分析结果表明, 头足类和鱼类的营养级差异性不显著(P>0.05), 鱼类与虾蟹类的营养级差异性显著(P<0.05), 呈现鱼类平均营养级高于虾蟹类的趋势。本研究海域主要渔业生物的营养级范围在2~5之间, 其中营养级低于2的有2种, 占比5.8%; 营养级处在2~3之间的有32种, 占比91.4%, 即营养级处在2~3之间的渔业生物占明显优势。将TPA模型和TPS模型计算的结果进行比较, 发现当营养级低于3.58(海鳗Muraenesox cinereus所处营养级)时, TPA模型计算的营养级略高于TPS模型的计算结果; 反之, 当营养级高于3.58时, TPA模型计算得出的结果则略低于TPS模型的计算结果。
图3 大亚湾西南海域主要渔业生物的营养级

Fig. 3 The trophic levels of major fishery organisms in the southwestern waters of Daya Bay

2.3 营养结构分析度量参数

依据δ13C-δ15N双位图计算了基于稳定同位素的6个营养结构群落范围指标, 结果见表2δ13C比值范围(δ13C range, CR)和δ15N比值范围(δ15N range, NR)分别为2.83和4.18, 多边形面积(total area, TA)和质心均距(mean distance to centroid, CD)分别为8.30和1.18, 最短均值(mean nearest neighbor distance, NND)和最短均值标准差(standard deviation of nearest neighbor distance, SDNND)分别为0.31和0.23, 说明大亚湾西南海域存在食物链营养层级较少并且长度不足, 食物网营养级多样性较低和营养结构冗余程度高等现象。
表2 营养结构分析度量参数

Tab. 2 Measurement parameters of trophic structure analysis

参数名称 简写 含义 参数值
δ13C比值范围 CR 图中δ13C 最大值与最小值之间的绝对距离, 反映初始食源的多样性特征 2.83
δ15N比值范围 NR 图中δ15N 最大值与最小值之间的绝对距离, 反映消费者所占的营养层次 4.18
多边形面积 TA 由所有物种在δ13C-δ15N 双位图上组成的多边形面积, 是衡量群落占据的生态位空间的总数量, 代表食物网中营养多样性的总范围 8.30
质心均距 CD 质心坐标为所有样品δ13C、δ15N的平均值, 计算所有样品到质心的欧氏距离, 并得出平均值, 表示群落营养多样性的平均水平 1.18
最短均值 NND 相邻两点间最短距离的平均值, 反映群落的聚集度密度 0.31
最短均值标准差 SDNND 相邻两点间最短距离的标准差, 反映群落物种聚集度均匀度, 表示营养生态位分布范围水平 0.23

3 讨论

3.1 渔业生物的碳、氮稳定同位素分析

稳定同位素结果显示, 大亚湾西南海域主要渔业生物δ13C的范围是-14.85‰ ~ -17.67‰, 差值为2.83‰; δ15N的范围是11.05‰~15.23‰, 差值为4.18‰, 即该海域主要渔业生物的CR和NR值分别为2.83和4.18。CR可用于表征食物来源多样性, 能够反映食物网的营养水平和结构层次(De Smet et al, 2015), CR值越大, 食物网中的初始食物来源(如本地初级生产者固定的有机碳、外源输入的有机物等)越广泛, 反之越单一; NR值则反映了群落营养级长度, NR值越高, 说明食物网营养层次越丰富, 食物链长度越长(Layman et al, 2007)。本研究结果显示, 大亚湾西南海域主要渔业生物的CR值为2.83, 与其他亚热带海区研究结果相比(表3), 该结果略高于海陵湾, 略低于陵水湾和南沙群岛西南陆架区, 远低于珠江口海域(主要渔业生物的CR值为12.58) (宁加佳 等, 2016; 张文博 等, 2019), 这可能是由于珠江口海域位于珠江流域与南海的耦合带, 陆源有机质来源更丰富(八大口门输入、工业排污、农业生产、水产养殖等), 再加上海源浮游饵料等渔业生物食物来源广泛, 使得该海域渔业生物的CR值较高。大亚湾西南海域渔业生物的NR值为4.18, 与陵水湾和南沙群岛西南陆架区相近, 略高于海陵湾, 低于珠江口海域(宁加佳 等, 2016; 曾艳艺 等, 2018; 张文博 等, 2019), 推测大亚湾西南海域同其他亚热带海区一样, 受工业、农业、水产养殖以及过度捕捞等高强度的人类活动影响较大, 改变了海湾生态环境, 导致高营养级生物减少, 食物链缩短, 营养层次比较接近, 营养级跨度不大。
表3 典型海域食物网营养结构

Tab. 3 Trophic structure of food web in typical sea areas

区域 参考文献 CR NR TA CD NND SDNND
大亚湾西南海域 本文 2.83 4.18 8.30 1.18 0.31 0.23
海陵湾 张文博 等, 2019 2.44 3.06 5.10 0.93 0.55 0.35
陵水湾 张文博 等, 2019 4.45 4.66 11.18 1.49 0.60 0.54
珠江口海域 曾艳艺 等, 2018 12.58 7.57
海州湾 谢斌 等, 2017 3.70 6.40 13.00 1.37 0.61 0.64
南海中西部海域 黄佳兴 等, 2019 3.49 4.91 9.48 1.20 1.69 0.74
南沙群岛西南陆架区 宁加佳 等, 2016 3.40 4.30 5.80 1.00 0.37 0.43
东海中北部海域 纪炜炜 等, 2015 3.38 3.45 7.02 1.12 0.42 0.28
TA代表食物网中营养多样性的总范围, 而CD表示群落营养多样性的平均水平, TA和CD值越大表明平均营养级多样性程度越高, 反之则越低。NND和SDNND反应的是群落营养冗余度大小, NND值较小表示群落营养冗余度较高; SDNND值与其类似, SDNND值越低, 意味着营养生态位的分布越均匀, 营养冗余度越高(Layman et al, 2007)。大亚湾西南海域主要渔业生物的TA和CD值分别为8.30和1.18, 高于海陵湾, 低于陵水湾(张文博 等, 2019), 显示大亚湾西南海域食物网营养级多样性程度不高。以3.4‰作为一个营养级的氮稳定同位素富集度来计算, 大亚湾西南海域主要渔业生物的营养级距仅为1.23, 说明该海域高营养级生物较少, 食物网受外界干扰较多, 生态系统稳定性较差。另外, 大亚湾西南海域的NND和SDNND值也远低于苏丹红海沿岸(Sabeel et al, 2015)的研究结果, 表明该海域食物网的冗沉程度较高。基于Ecopath模型对不同时期大亚湾生态系统结构和能量流动进行分析, 发现与1985—1986年相比, 2015—2016年高营养级生物量减少, 食物网结构由复杂化向简单化发展, 生态系统容易受外界干扰, 生态系统稳定性下降(黄小平 等, 2019), 与本研究基于稳定同位素技术分析得出的结果一致。
本研究结果与温带海湾海州湾(谢斌 等, 2017)相比, NR、TA、CD值均较低(表3), 表明大亚湾西南海域主要渔业生物的食物链长度和多样性程度均低于海州湾。海州湾位于黄海南部, 地处暖温带季风气候区, 而大亚湾是我国南部沿岸极具代表性的亚热带海湾, 二者在气候、水文等环境因子上有很大差异, 人类陆源输入以及捕捞强度对两个海湾的影响程度也不同, 可能会导致两者食物网营养结构和多样性程度的不同。

3.2 渔业生物营养级分析

本研究用TPA模型和TPS模型分别计算了主要渔业生物的营养级, 结果显示两个模型的计算结果无显著性差异(P>0.1)。单因素方差分析结果显示, 头足类和鱼类的平均营养级差异性不显著(P>0.05), 鱼类和虾蟹类的平均营养级差异性显著(P<0.05), 这与头足类、鱼类和虾蟹类的食性有关。本次调查仅捕获一种头足类——杜氏枪乌贼, 主要以甲壳类、鱼类和头足类为食, 且同类残食现象严重; 鱼类主要以浮游动物、游泳动物和底栖生物为食; 虾蟹类主要以浮游动物、底栖生物以及有机碎屑为食, 因此本研究中鱼类、虾蟹类和头足类平均营养级都高于3, 且鱼类平均营养级高于虾蟹类。
本研究样品来自底拖网调查, 18种鱼类大部分为底层或近底层鱼类, 主要以浮游动物、底栖动物以及小型游泳动物为食, 营养位置主要集中在3~4之间, 平均营养级为3.63, 这与Sánchez-Hernández等(2018)对全球鱼类营养级的研究结果相一致, 该研究通过对5426种鱼类进行营养级分析, 发现海洋食浮游生物鱼类平均营养级为3.53, 食游泳动物鱼类的平均营养级为4.16, 底栖鱼类平均营养级为3.55。大亚湾西南海域沿岸长期受居民生活污水、海洋施工以及核电站温排水的影响, 海洋生态环境遭到破坏, 高营养级鱼类减少, 鱼类以小型底层和近底层种类为主, 并且除长蛇鲻和单斑笛鲷外, 其余鱼类的营养级均位于3~4之间, 并且大部分种类食性相近, 说明该海域鱼类不同种类之间营养生态宽幅较小, 营养生态位重叠度较高。徐姗楠 等(2020)对比分析了大亚湾1985—2017年的夏季鱼类调查资料, 发现受人类活动影响, 30多年来大亚湾夏季鱼类群落物种多样性减小, 鱼类由大型中上层种类向小型底层、近底层种类演变, 鱼类群落结构由复杂化趋向简单化, 与本研究结果一致。另外, 受人类生产生活以及过度捕捞等影响, 近年来大亚湾海域鱼类生物量降低(黄小平 等, 2019), 而鱼类生物量降低会导致其营养级升高(Bode et al, 2018)。

4 结论与展望

本文利用稳定同位素技术初步分析了大亚湾西南海域主要渔业生物碳氮稳定同位素特征, 并建立了其连续营养谱。结果显示: 该海域受人类活动等因素的影响, 食物网初始食物来源较为单一, 营养层级较少; 食物网的冗余程度高, 不同种类之间的营养生态位幅宽较小, 重叠程度较高; 以TPA模型和TPS模型分别计算主要渔业生物的营养级, 结果显示两个模型计算结果无显著性差异(P>0.1), 鱼类的平均营养级高于虾蟹类; 与30多年前相比, 近年来大亚湾食物网结构由复杂趋向简单化, 生态系统稳定性下降。
基线生物的确定是利用稳定同位素技术对海洋生态系统开展研究的关键(徐军 等, 2010), 海湾是鱼虾贝类等经济动物繁殖、索饵和越冬的场所, 具有重要的生态价值, 常选择浮游动物和底栖生物等初级消费者或颗粒有机碳(particulate organic matter, POM)等物质作为基线生物(Zanden et al, 2003; 贡艺 等, 2017)。本文参考Bode等(2018)对比斯开湾沙丁鱼的营养级研究, 以大亚湾西南海域粒径为160~600μm的中型浮游动物为基线生物(δ15N值为8.25‰), 对大亚湾西南海域主要渔业生物营养级进行计算分析。不同浮游动物种类存在着明显的季节变化(Matthews et al, 2005), 水温的季节性变化也会通过影响浮游植物的光合作用及其对氮元素的吸收和分馏, 影响浮游动物的δ15N值(徐军 等, 2010), 进而对营养级的计算产生影响。因此, 期望今后对大亚湾西南海域不同季节的主要渔业生物和中型浮游动物(160~600μm)进行采集, 从而比较分析季节性变化对大亚湾西南海域食物网营养结构的影响。
[1]
贡艺, 陈玲, 李云凯, 2017. 海洋生态系统稳定同位素基线的选取[J]. 应用生态学报, 28(7): 2399-2404.

GONG YI, CHEN LING, LI YUNKAI, 2017. Selection of isotopic baselines in marine ecosystems[J]. Chinese Journal of Applied Ecology, 28(7): 2399-2404. (in Chinese with English abstract)

[2]
黄佳兴, 龚玉艳, 徐姗楠, 等, 2019. 南海中西部渔场主要渔业生物碳氮稳定同位素特征[J]. 热带海洋学报, 38(1): 76-84.

HUANG JIAXING, GONG YUYAN, XU SHANNAN, et al, 2019. Characteristics of stable carbon and nitrogen isotopes of major fishery organisms in the fishing ground of central western South China Sea[J]. Journal of Tropical Oceanography, 38(1): 76-84. (in Chinese with English abstract)

[3]
黄小平, 黄良民, 宋金明, 等, 2019. 营养物质对海湾生态环境影响的过程与机理[M]. 北京: 科学出版社: 549-558. (in Chinese)

[4]
纪炜炜, 李圣法, 陈雪忠, 等, 2015. 基于稳定同位素方法的东海北部及其邻近水域主要游泳动物营养结构变化[J]. 海洋渔业, 37(6): 494-500.

JI WEIWEI, LI SHENGFA, CHEN XUEZHONG, et al, 2015. Variation in trophic structure of nekton organisms from the northern East China Sea and adjacent waters based on stable isotope values[J]. Marine Fisheries, 37(6): 494-500. (in Chinese with English abstract)

[5]
牟新悦, 陈敏, 张琨, 等, 2017. 夏季大亚湾悬浮颗粒有机物碳、氮同位素组成及其物源指示[J]. 海洋学报, 39(2): 39-52.

MOU XINYUE, CHEN MIN, ZHANG KUN, et al, 2017. Stable carbon and nitrogen isotopes as tracers of sources of suspended particulate organic matter in the Daya Bay in summer[J]. Haiyang Xuebao, 39(2): 39-52. (in Chinese with English abstract)

[6]
宁加佳, 杜飞雁, 王雪辉, 等, 2016. 南沙群岛西南部陆架区底层鱼类营养结构研究[J]. 海洋与湖沼, 47(2): 468-475.

NING JIAJIA, DU FEIYAN, WANG XUEHUI, et al, 2016. The trophic structure of demersal fish species in Southwestern continental shelf of Nansha Islands, South China Sea[J]. Oceanologia et Limnologia Sinica, 47(2): 468-475. (in Chinese with English abstract)

[7]
王友绍, 王肇鼎, 黄良民, 2004. 近20年来大亚湾生态环境的变化及其发展趋势[J]. 热带海洋学报, 23(5): 85-95.

WANG YOUSHAO, WANG ZHAODING, HUANG LIANGMIN, 2004. Environment changes and trends in Daya Bay in recent 20 years[J]. Journal of Tropical Oceanography, 23(5): 85-95. (in Chinese with English abstract)

[8]
王玉堃, 2015. 耳石微细结构和微化学示踪技术在鱼类种群生态学研究中的应用[D]. 青岛: 中国海洋大学.

WANG YUKUN, 2015. Preliminary studies on the population ecology based on fish otolith microstructure and microchemistry[D]. Qingdao: Ocean University of China. (in Chinese with English abstract)

[9]
谢斌, 李云凯, 张虎, 等, 2017. 基于稳定同位素技术的海州湾海洋牧场食物网基础及营养结构的季节性变化[J]. 应用生态学报, 28(7): 2292-2298.

XIE BIN, LI YUNKAI, ZHANG HU, et al, 2017. Food web foundation and seasonal variation of trophic structure based on the stable isotopic technique in the marine ranching of Haizhou Bay, China[J]. Chinese Journal of Applied Ecology, 28(7): 2292-2298. (in Chinese with English abstract)

[10]
徐军, 张敏, 谢平, 2010. 氮稳定同位素基准的可变性及对营养级评价的影响[J]. 湖泊科学, 22(1): 8-20.

XU JUN, ZHANG MIN, XIE PING, 2010. Variability of stable nitrogen isotopic baselines and its consequence for trophic modeling[J]. Journal of Lake Sciences, 22(1): 8-20. (in Chinese with English abstract)

DOI

[11]
徐姗楠, 郭建忠, 范江涛, 等, 2020. 夏季大亚湾鱼类群落结构与多样性[J]. 生态学杂志, 39(4): 1254-1264.

XU SHANNAN, GUO JIANZHONG, FAN JIANGTAO, et al, 2020. Fish community structure and diversity in Daya Bay in summer[J]. Chinese Journal of Ecology, 39(4): 1254-1264. (in Chinese with English abstract)

[12]
杨文超, 黄道建, 陈继鑫, 等, 2020. 大亚湾近十年沉积物中汞、砷分布及污染评价[J]. 水产科学, 39(6): 915-921.

YANG WENCHAO, HUANG DAOJIAN, CHEN JIXIN, et al, 2020. Distribution and pollution assessment of Hg and As contents in surface sediments of Daya Bay in the past ten years[J]. Fisheries Science, 39(6): 915-921. (in Chinese with English abstract)

[13]
曾艳艺, 赖子尼, 杨婉玲, 等, 2018. 珠江河口渔业生物稳定同位素营养级分析[J]. 生态学杂志, 37(1): 194-202.

ZENG YANYI, LAI ZINI, YANG WANLING, et al, 2018. Trophic spectrum of fishery species from the Pearl River Estuary by stable isotope analysis[J]. Chinese Journal of Ecology, 37(1): 194-202. (in Chinese with English abstract)

[14]
张硕, 高世科, 于雯雯, 等, 2019. 碳、氮稳定同位素在构建海洋食物网及生态系统群落结构中的研究进展[J]. 水产养殖, 40(7): 6-10.

ZHANG SHUO, GAO SHIKE, YU WENWEN, et al, 2019. Research progress of stable carbon and nitrogen isotopes in the construction of marine food web and ecosystem community structure[J]. Journal of Aquaculture, 40(7): 6-10. (in Chinese with English abstract)

[15]
张文博, 黄洪辉, 李纯厚, 等, 2019. 华南典型海湾主要渔业生物碳氮稳定同位素研究[J]. 南方水产科学, 15(5): 9-14.

ZHANG WENBO, HUANG HONGHUI, LI CHUNHOU, et al, 2019. Study on carbon and nitrogen stable isotopes of main fishery species in typical gulf, southern China[J]. South China Fisheries Science, 15(5): 9-14. (in Chinese with English abstract)

[16]
BODE A, CARRERA P, GONZÁLEZ-NUEVO G, et al, 2018. A trophic index for sardine (Sardina pilchardus) and its relationship to population abundance in the southern Bay of Biscay and adjacent waters of the NE Atlantic[J]. Progress in Oceanography, 166: 139-147.

DOI

[17]
DE SMET B, FOURNIER J, DE TROCH M, et al, 2015. Integrating ecosystem engineering and food web ecology: testing the effect of biogenic reefs on the food Web of a soft-bottom intertidal area[J]. PLoS One, 10(10): e0140857.

DOI

[18]
HOBSON K A, FISK A, KARNOVSKY N, et al, 2002. A stable isotope (δ13C, δ15N) model for the North Water food web: implications for evaluating trophodynamics and the flow of energy and contaminants[J]. Deep Sea Research Part II: Topical Studies in Oceanography, 49(22-23): 5131-5150.

DOI

[19]
HUSSEY N E, MACNEIL M A, MCMEANS B C, et al, 2014. Rescaling the trophic structure of marine food webs[J]. Ecology Letters, 17(2): 239-250.

DOI

[20]
JACKSON M C, DONOHUE I, JACKSON A L, et al, 2012. Population-level metrics of trophic structure based on stable isotopes and their application to invasion ecology[J]. PLoS One, 7(2): e31757.

DOI

[21]
LAYMAN C A, ARRINGTON D A, MONTAÑA C G, et al, 2007. Can stable isotope ratios provide for community-wide measures of trophic structure[J]. Ecology, 88(1): 42-48.

DOI

[22]
MATTHEWS B, MAZUMDER A, 2005. Consequences of large temporal variability of zooplankton δ15N for modeling fish trophic position and variation[J]. Limnology and Oceanography, 50(5): 1404-1414.

DOI

[23]
MCMEANS B C, ROONEY N, ARTS M T, et al, 2013. Food web structure of a coastal Arctic marine ecosystem and implications for stability[J]. Marine Ecology Progress Series, 482: 17-28.

DOI

[24]
PAULY D, PALOMARES M L, FROESE R, et al, 2001. Fishing down Canadian aquatic food webs[J]. Canadian Journal of Fisheries and Aquatic Sciences, 58(1): 51-62.

DOI

[25]
POST D M, 2002. Using stable isotopes to estimate trophic position: Models, methods, and assumptions[J]. Ecology, 83(3): 703-718.

DOI

[26]
SABEEL R A O, INGELS J, PAPE E, et al, 2015. Macrofauna along the Sudanese Red Sea coast: potential effect of mangrove clearance on community and trophic structure[J]. Marine Ecology, 36(3): 794-809.

DOI

[27]
SÁNCHEZ-HERNÁNDEZ J, AMUNDSEN P A, 2018. Ecosystem type shapes trophic position and omnivory in fishes[J]. Fish and Fisheries, 19(6): 1003-1015.

DOI

[28]
YING RUI, CAO YITING, YIN FANGMIN, et al, 2020. Trophic structure and functional diversity reveal pelagic-benthic coupling dynamic in the coastal ecosystem of Daya Bay, China[J]. Ecological Indicators, 113: 106241.

DOI

[29]
ZANDEN M J V, CHANDRA S, ALLEN B C, et al, 2003. Historical food web structure and restoration of native aquatic communities in the Lake Tahoe (California-Nevada) Basin[J]. Ecosystems, 6(3): 274-288.

DOI

[30]
ZANDEN M J V, FETZER W W, 2007. Global patterns of aquatic food chain length[J]. Oikos, 116(8): 1378-1388.

DOI

[31]
ZHOU LINBIN, HUANG LIANGMIN, TAN YEHUI, et al, 2015. Size-based analysis of a zooplankton community under the influence of the Pearl River plume and coastal upwelling in the northeastern South China Sea[J]. Marine Biology Research, 11(2): 168-179.

DOI

Outlines

/