
Journal of Tropical Oceanography >
Trend analysis of marine heatwaves variability in the outer Pearl River estuary from 1974 to 2020
Copy editor: LIN Qiang
Received date: 2022-01-27
Revised date: 2022-04-20
Online published: 2022-04-24
Supported by
Science and Technology Fundamental Resources Survey Program of Ministry of Science and Technology(2019FY202110)
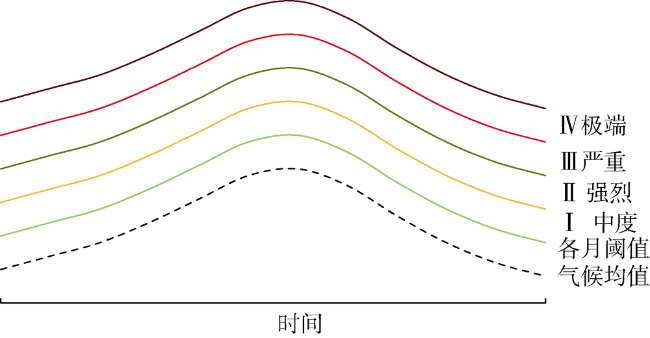
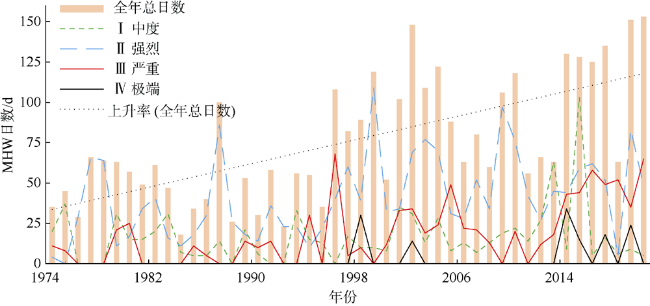
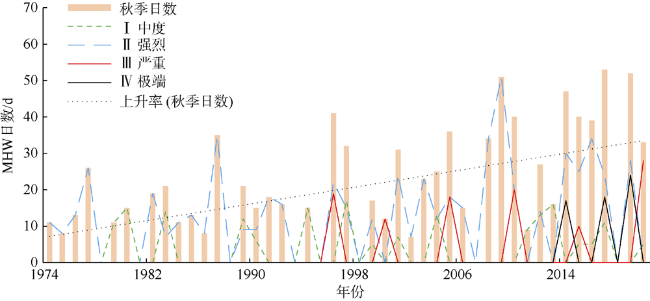
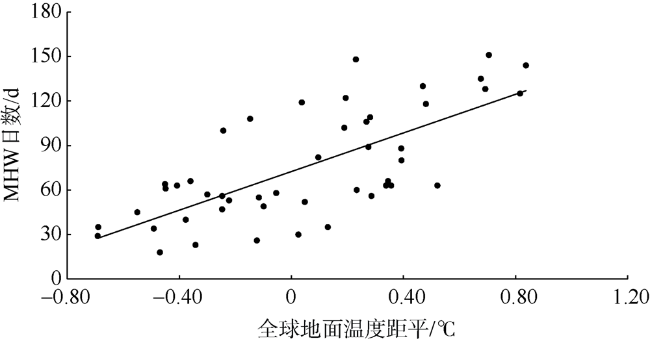
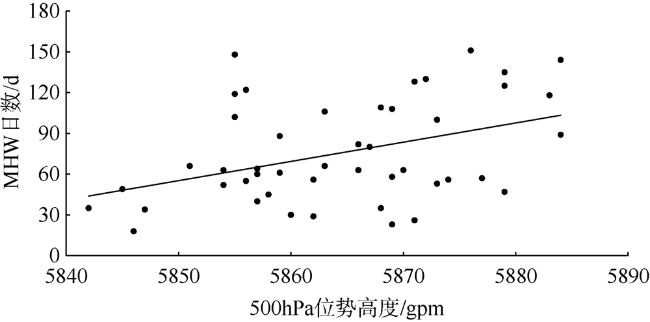
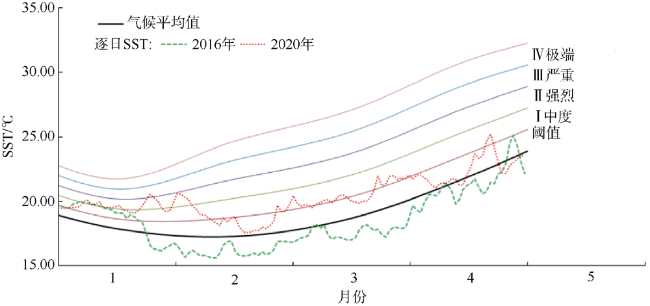
Based on the daily mean sea surface temperature (SST) data observed at the Dawanshan Marine Environmental Monitoring Station (DMEMS) in the Pearl River Estuary from 1974 to 2020, the definition of marine heatwaves (MHW) adopted by the World Meteorological Organization, the intensity classification criteria, and the global and northern hemisphere annual mean surface temperature anomaly data, the trends of MHW in the Pearl River Estuary are analyzed using correlation and comparison methods. The results show that: 1) MHW incidents have occurred annually in the Pearl River Estuary in the past 47 years, with an average of 6.5 times per year and up to 13 times in 2020. There is an upward trend in the number of occurrences every year. The average duration is 11.7 days, up to 62 days. 2) MHW days in the Pearl River Estuary have increased significantly in the past 47 years, with an increasing rate of 1.81 d·a-1. 3) During this period, the proportion of MHW days with each level of intensity to all days is: moderate 18.92%, strong 53.24%, severe 24.06% and extreme 3.77%. 4) The main reasons for the increase of MHW days and the occurrence of extreme MHW in the Pearl River Estuary might be global warming, enhanced high pressure and weakened monsoon in the South China Sea. It is estimated that the MHW days in the Pearl River Estuary will increase in the future.
TANG Ling , NIE Yuhua , WANG Ping , TANG Chaolian . Trend analysis of marine heatwaves variability in the outer Pearl River estuary from 1974 to 2020[J]. Journal of Tropical Oceanography, 2022 , 41(6) : 143 -150 . DOI: 10.11978/2022017
表1 珠江口海洋热浪年代际变化Tab. 1 Interdecadal variation of MHW in Pearl River Estuary |
| 年代际 | MHW日数 | MHW强度等级日数 | 全球温度 距平/℃ | 北半球温度 距平/℃ | |||
|---|---|---|---|---|---|---|---|
| 中度 | 强 | 严重 | 极端 | ||||
| 1981—1990 | 42.2 | 12.4 | 29.4 | 0.4 | 0.0 | -0.16 | -0.27 |
| 1991—2000 | 67.5 | 11.4 | 39.2 | 13.9 | 3.0 | -0.04 | -0.03 |
| 2001—2010 | 100.0 | 18.9 | 56.8 | 23.5 | 1.4 | 0.21 | 0.30 |
| 2011—2020 | 108.0 | 14.7 | 46.0 | 38.2 | 9.1 | 0.41 | 0.56 |
注: 温度距平数据取自HadCRUT5, 以1981—2010年平均SST为气候均值 |
表2 1974—2020年大万山海洋站四季海洋热浪参数比较Tab. 2 Comparison of MHW parameters at DMEMS in four seasons from 1974 to 2020 |
| 季节 | MHW | 各级强度比例/% | 最大强度 | MHW日数上升率/(d·a-1) | ||||
|---|---|---|---|---|---|---|---|---|
| 平均次数/季 | 平均日数/次 | 中度 | 强烈 | 严重 | 极端 | |||
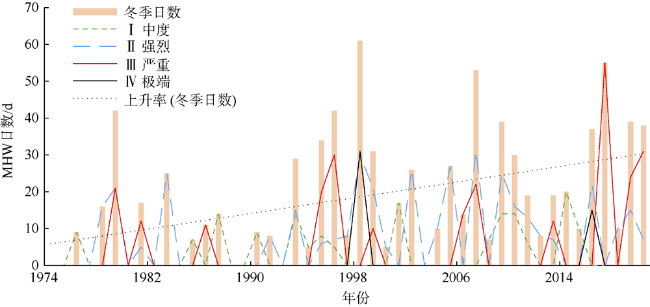
| 冬 | 1.38 | 17.2 | 18.7 | 41.6 | 30.8 | 8.9 | 4.44* | 0.53 |
| 春 | 1.25 | 14.2 | 33.7 | 56.4 | 9.85 | 0.0 | 3.00 | 0.31 |
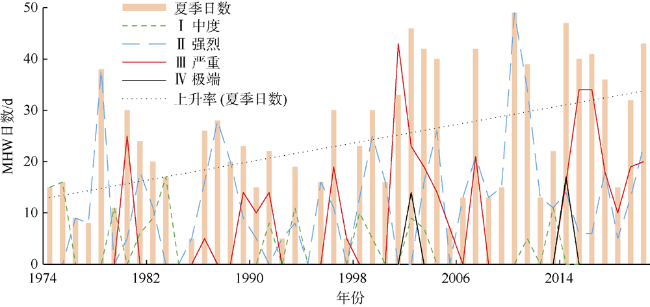
| 夏 | 2.38 | 23.0 | 13.1 | 50.7 | 33.4 | 2.8 | 2.61 | 0.45 |
| 秋 | 1.72 | 20.2 | 19.1 | 63.2 | 11.4 | 6.3 | 2.46 | 0.57 |
| 全年 | 6.73 | 74.6 | 18.9 | 53.2 | 24.1 | 3.8 | 4.44 | 1.83 |
注: *受超强ENSO事件影响, 1998年1月全月处于MHW中 |
表3 大万山海洋站2016和2020年逐月水文气象参数比较Tab. 3 Comparison of monthly hydrometeorological parameters at DMEMS in 2016 and 2020 |
| 年份 | 项目 | 月份 | 年 | |||||||||||
|---|---|---|---|---|---|---|---|---|---|---|---|---|---|---|
| 1 | 2 | 3 | 4 | 5 | 6 | 7 | 8 | 9 | 10 | 11 | 12 | |||
| 2016 | 热浪日数/d | 20 | 0 | 0 | 0 | 0 | 17 | 23 | 0 | 0 | 16 | 23 | 24 | 123 |
| 月SST距平/℃ | 0.6 | -1.2 | -1.2 | -0.6 | -0.2 | 1.4 | 0.8 | -1.3 | 0.1 | 0.7 | 1.4 | -0.3 | 0.6 | |
| 500hPa高度 | 5820 | 5840 | 5826 | 5856 | 5881 | 5892 | 5885 | 5859 | 5879 | 5887 | 5887 | 5858 | 5864 | |
| 2020 | 热浪日数/d | 31 | 9 | 10 | 0 | 22 | 19 | 24 | 0 | 19 | 14 | 0 | 7 | 153 |
| 月SST距平/℃ | 1.7 | 1.4 | 1.8 | 0.5 | 1.8 | 1.4 | 1.1 | 0.3 | 1.4 | -0.1 | -0.26 | 0.72 | 0.9 | |
| 500hPa高度 | 5830 | 5841 | 5844 | 5855 | 5884 | 5888 | 5891 | 5872 | 5893 | 5910 | 5893 | 5856 | 5872 | |
注: 500hPa高度≥5880表示该月为南海高压控制 |
| [1] |
程泽梅, 汤超莲, 蔡兵, 等, 2016. 1960-2013年华南沿海海洋站SST变化及其影响因子[J]. 热带地理, 36(6): 906-914.
|
| [2] |
邓松, 汤超莲, 游大伟, 2005. 1998年冬春季粤港赤潮爆发海区异常高SST成因分析[J]. 海洋通报, 24(4): 17-21.
|
| [3] |
广东省气候中心, 2016. 广东省气候影响评价[R]. 广州:广东省气候中心. (in Chinese)
|
| [4] |
广东省气候中心, 2020. 广东省气候公报[R]. 广州: 广东省气候中心. (in Chinese)
|
| [5] |
何俊杰, 何宇恒, 2016. 2016年1月下旬强烈寒潮对香港的影响和预报方法[C]// 第33届中国气象学会年会S1灾害天气监测、分析与预报. 西安: 中国气象学会: 510. (in Chinese)
|
| [6] |
胡石建, 李诗翰, 2022. 海洋热浪研究进展与展望[J]. 地球科学进展, 37(1): 51-64.
|
| [7] |
李琰, 王国松, 范文静, 等, 2018. 中国沿海海表温度均一性检验和订正[J]. 海洋学报, 40(1): 17-28.
|
| [8] |
梁巧倩, 简茂球, 彭勇刚, 等, 2006. 东亚冬季风异常对西北太平洋海温的影响[J]. 热带海洋学报, 25(6): 1-7.
|
| [9] |
缪予晴, 徐海明, 刘佳伟, 2021. 西北太平洋夏季海洋热浪的变化特征及海气关系[J]. 热带海洋学报, 40(1): 31-43.
|
| [10] |
任国玉, 张爱英, 初子莹, 等, 2010. 我国地面气温参考站点遴选的依据、原则和方法[J]. 气象科技, 38(1): 78-85.
|
| [11] |
汤超莲, 游大伟, 邓松, 等, 2004. 珠江口赤潮多发期海表水温变化特征[C]// 中国赤潮研究与防治(一)—中国海洋学会赤潮研究与防治学术研讨会论文集. 广州: 中国海洋学会: 97-103. (in Chinese)
|
| [12] |
汤超莲, 郑兆勇, 游大伟, 等, 2006. 珠江口近30a的SST变化特征分析[J]. 台湾海峡, 25(1): 96-101.
|
| [13] |
汤超莲, 游大伟, 邓松, 等, 2007. 20世纪2次最强El Nino事件珠江口SST变化的差异[J]. 广东气象, 29(2): 11-13.
|
| [14] |
王爱梅, 王慧, 范文静, 等, 2021. 2019年中国近海海洋热浪特征研究[J]. 海洋学报, 43(6): 35-44.
|
| [15] |
香港天文台. 2016年1月天气回顾[EB/OL]. (2016a-02-02) [2022-01-26]. https://www.hko.gov.hk/sc/wxinfo/pastwx/mws2016/mws201601.htm.
|
| [16] |
香港天文台. 2016年2月天气回顾[EB/OL]. (2016b-03-02) [2022-01-26]. https://www.hko.gov.hk/sc/wxinfo/pastwx/mws2016/mws201602.htm.
|
| [17] |
香港天文台. 2016年3月天气回顾[EB/OL]. (2016c-04-05) [2022-01-26]. https://www.hko.gov.hk/sc/wxinfo/pastwx/mws2016/mws201603.htm.
|
| [18] |
郑兆勇, 周雄, 江四义, 等, 2010. 近50年华南沿海SST热事件变化的时空特征[J]. 热带海洋学报, 29(4): 14-19.
|
| [19] |
周宇, 2017. 南海西沙一次冷空气强风分析[J]. 海洋预报, 34(4): 58-65.
|
| [20] |
自然资源部, [2020-05-21]. 2019年中国海平面公报[EB/OL]. 北京: 自然资源部. http://www.nmdis.org.cn/hygb/zghpmgb/2019nzghpmgb.
|
| [21] |
自然资源部, [2021-04-28]. 2020年中国海平面公报[EB/OL]. 北京: 自然资源部. http://www.nmdis.org.cn/hygb/zghpmgb/2020nzghpmgb.
|
| [22] |
|
| [23] |
|
| [24] |
|
| [25] |
|
| [26] |
WMO, 2020. WMO statement on the state of the global climate in 2019[R]. Geneva: WMO.
|
| [27] |
WMO, 2021. State of the global climate 2020[R]. Geneva: WMO.
|
| [28] |
|
| [29] |
|
| [30] |
|
| [31] |
|
| [32] |
|
| [33] |
|
/
| 〈 |
|
〉 |


