
Journal of Tropical Oceanography >
Investigating the contents and sources of heavy metals in winter season in the Xisha waters of South China Sea*
Copy editor: YIN Bo
Received date: 2022-06-08
Revised date: 2022-09-06
Online published: 2022-09-14
Supported by
National Natural Science Foundation of China(U21A6001)
National Key Research and Development Program of China(2016YFC0402604)
In order to investigate the contents and sources of heavy metals in the Xisha waters in the South China Sea, 24 seawater samples at six sites were collected in December of 2021. Vertical profiles of temperature, salinity, turbidity, dissolved oxygen, colored soluble organic matter and chlorophyll were determined by Conductivity-Temperature-Depth instrument. Inductively coupled plasma mass spectrometry was used to measure the contents of heavy metals in seawater samples, and the average Cu, Pb, Zn, Cd, Ni, Cr, As, Fe and Mn contents were 0.22~20.79 µg·L-1, n.d. (not detected) ~0.25 µg·L-1, 1.90~15.90 µg·L-1, 0.13~0.17 µg·L-1, 0.54~1.31 µg·L-1, 0.29~0.33 µg·L-1, 2.93~3.17 µg·L-1, 0.39~1.23 µg·L-1 and 0.35~1.14 µg·L-1, respectively; Hg was not detected. Only Cu or Zn contents in 5m-depth seawater at D2~D4 sites exceeded Class I requirement of National Seawater Quality Standard (GB 3097-1997), and the spatial distribution of heavy metals was influenced by terrestrial inputs, environmental factors and human activities. Principal component analysis indicated that the heavy metals in the Xisha waters are mainly from three sources: ship emission, terrestrial agricultural runoff, as well as terrestrial debris and industrial inputs. The measurements in this study are generally within the range of heavy metal contents previously reported in the South China Sea. However, compared with the background values of the South China Sea in 1998, the contents of Cu, Pb, Zn and Cd in surface seawater have increased by one order of magnitude, reflecting the impact of recent intense human activities in this region.
Key words: heavy metal; ship pollution; Xisha waters; source analysis
DONG Hanying , SU Juan , ZHOU Shengzhen , LIANG Shaoxia , CHEN Guanyu , WANG Fan . Investigating the contents and sources of heavy metals in winter season in the Xisha waters of South China Sea*[J]. Journal of Tropical Oceanography, 2023 , 42(2) : 169 -177 . DOI: 10.11978/2022129
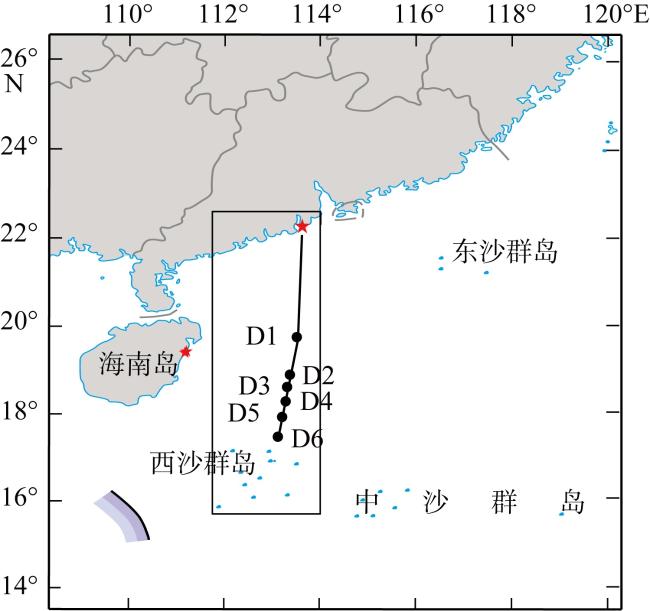
图1 西沙海域海水采样站位位置该图基于国家测绘地理信息局标准地图服务网站下载的审图号为GS(2019)1821的标准地图制作, 底图无修改。图中黑色实心圆为采样站位位置, 红色五角星从北至南分别为高栏港、龙湾港和潭门港 Fig. 1 Seawater sampling sites in the Xisha waters. This map is based on the standard map with the review number of GS(2019)1821 downloaded from the website of National Administration of Surveying, Mapping and Geoinformation of China. Black solid circles denote sampling stations, and red stars denote the Gaolan Port, Longwan Port and Tanmen Port from north to south |
表1 各站位海水重金属质量浓度及海水水质标准(GB 3097-1997)(单位: µg·L-1)Tab. 1 Heavy metal contents in the seawater from six sampling sites and National Seawater Quality Standard (GB 3097-1997) |
| 观测站位 | 采样深度/m | Cu | Pb | Zn | Cd | Ni | Cr | As | Hg | Fe | Mn |
|---|---|---|---|---|---|---|---|---|---|---|---|
D1 | 20 | 0.24 | n.d. | 0.57 | 0.15 | 0.53 | 0.35 | 2.97 | n.d. | 0.63 | 0.50 |
| 50 | 0.23 | n.d. | 4.26 | 0.12 | 0.37 | 0.29 | 3.10 | n.d. | 0.94 | 0.33 | |
| 100 | 0.20 | n.d. | 1.29 | 0.14 | 0.32 | 0.32 | 3.11 | n.d. | 0.32 | 0.24 | |
| 200 | 0.20 | n.d. | 4.10 | 0.21 | 3.99 | 0.36 | 3.50 | n.d. | 0.55 | 0.31 | |
| 平均值 | 0.22 | n.d. | 2.55 | 0.16 | 1.31 | 0.33 | 3.17 | n.d. | 0.61 | 0.35 | |
D2 | 5 | 5.32 | 0.54 | 9.95 | 0.08 | 0.47 | 0.34 | 2.81 | n.d. | 1.53 | 0.79 |
| 50 | 0.31 | n.d. | 2.13 | 0.13 | 0.38 | 0.28 | 2.84 | n.d. | 0.38 | 0.32 | |
| 100 | 0.24 | n.d. | 1.19 | 0.14 | 0.31 | 0.30 | 3.07 | n.d. | 0.29 | 0.21 | |
| 200 | 0.25 | 0.03 | 1.25 | 0.24 | 3.28 | 0.33 | 3.61 | n.d. | 0.64 | 0.40 | |
| 平均值 | 1.53 | 0.14 | 3.63 | 0.15 | 1.11 | 0.31 | 3.08 | n.d. | 0.71 | 0.43 | |
D3 | 5 | 82.35 | 0.98 | 59.61 | 0.14 | 2.88 | 0.34 | 2.77 | n.d. | 1.22 | 1.06 |
| 50 | 0.32 | n.d. | 1.69 | 0.14 | 0.31 | 0.27 | 2.72 | n.d. | 0.26 | 0.28 | |
| 100 | 0.23 | n.d. | 0.85 | 0.15 | 0.29 | 0.27 | 3.05 | n.d. | 0.21 | 0.29 | |
| 200 | 0.25 | n.d. | 1.45 | 0.23 | 1.72 | 0.27 | 3.74 | n.d. | 0.44 | 0.56 | |
| 平均值 | 20.79 | 0.25 | 15.90 | 0.16 | 1.30 | 0.29 | 3.07 | n.d. | 0.53 | 0.55 | |
D4 | 5 | 19.49 | 0.26 | 28.97 | 0.14 | 1.12 | 0.44 | 2.67 | n.d. | 4.19 | 3.44 |
| 50 | 0.26 | n.d. | 0.70 | 0.16 | 0.29 | 0.26 | 2.71 | n.d. | 0.10 | 0.36 | |
| 100 | 0.21 | n.d. | 0.68 | 0.13 | 0.25 | 0.29 | 2.89 | n.d. | 0.21 | 0.30 | |
| 200 | 0.30 | n.d. | 1.09 | 0.24 | 1.54 | 0.34 | 3.47 | n.d. | 0.42 | 0.46 | |
| 平均值 | 5.06 | 0.07 | 7.86 | 0.17 | 0.80 | 0.33 | 2.93 | n.d. | 1.23 | 1.14 | |
D5 | 5 | 3.27 | 0.09 | 4.50 | 0.07 | 0.33 | 0.39 | 2.59 | n.d. | 0.90 | 0.49 |
| 50 | 0.22 | n.d. | 1.29 | 0.10 | 0.28 | 0.25 | 2.69 | n.d. | 0.20 | 0.36 | |
| 100 | 0.25 | n.d. | 1.00 | 0.12 | 0.37 | 0.34 | 3.19 | n.d. | 0.36 | 0.34 | |
| 200 | 0.27 | n.d. | 1.37 | 0.23 | 1.20 | 0.29 | 3.95 | n.d. | 0.33 | 0.34 | |
| 平均值 | 1.01 | 0.02 | 2.04 | 0.13 | 0.54 | 0.31 | 3.11 | n.d. | 0.45 | 0.38 | |
D6 | 5 | 2.12 | 0.03 | 4.22 | 0.10 | 2.76 | 0.34 | 2.83 | n.d. | 0.79 | 0.86 |
| 50 | 0.27 | n.d. | 1.00 | 0.10 | 0.30 | 0.25 | 2.68 | n.d. | 0.17 | 0.37 | |
| 100 | 0.22 | n.d. | 0.96 | 0.12 | 0.32 | 0.32 | 2.98 | n.d. | 0.26 | 0.25 | |
| 200 | 0.21 | n.d. | 1.40 | 0.24 | 0.91 | 0.30 | 3.57 | n.d. | 0.35 | 0.45 | |
| 平均值 | 0.71 | 0.01 | 1.90 | 0.14 | 1.07 | 0.30 | 3.02 | n.d. | 0.39 | 0.48 | |
| 海水水质标准 (GB 3097-1997) | 一类 | 5 | 1 | 20 | 1 | 5 | 50 | 20 | 0.05 | n.a. | n.a. |
| 二类 | 10 | 5 | 50 | 5 | 10 | 100 | 30 | 0.20 | n.a. | n.a. | |
| 三类 | 50 | 10 | 100 | 10 | 20 | 200 | 50 | 0.20 | n.a. | n.a. | |
| 四类 | 50 | 50 | 500 | 10 | 50 | 500 | 50 | 0.50 | n.a. | n.a. |
注: n.d.表示未检出; n.a.表示未报道 |
表2 各站位海水环境因子参数Tab. 2 Environmental factors of seawater at the six sampling sites |
| 观测站位 | 采样深度/m | 水温/℃ | 盐度/‰ | 浊度/NTU | 溶解氧/ (mg·L-1) | 有色可溶性有机质 质量浓度/(μg·L-1) | 叶绿素质量浓度/(µg·L-1) |
|---|---|---|---|---|---|---|---|
D1 | 20 | 25.72 | 33.75 | 0.061 | 6.47 | 222.88 | 0.355 |
| 50 | 25.72 | 33.77 | 0.067 | 6.46 | 170.02 | 0.330 | |
| 100 | 23.58 | 34.30 | 0.060 | 5.62 | 80.98 | 0.209 | |
| 200 | 15.76 | 34.60 | 0.041 | 4.69 | 9.23 | 0.048 | |
| 平均值 | 22.70 | 34.11 | 0.057 | 5.81 | 120.78 | 0.236 | |
D2 | 5 | 25.95 | 33.66 | 0.067 | 9.38 | 161.99 | 0.295 |
| 50 | 25.92 | 33.66 | 0.067 | 6.53 | 74.79 | 0.331 | |
| 100 | 22.95 | 34.37 | 0.054 | 5.45 | 9.23 | 0.197 | |
| 200 | 14.50 | 34.55 | 0.048 | 4.58 | 9.23 | 0.053 | |
| 平均值 | 22.33 | 34.06 | 0.059 | 6.49 | 63.81 | 0.219 | |
D3 | 5 | 25.95 | 33.86 | 0.067 | 6.52 | 9.23 | 0.417 |
| 50 | 25.71 | 33.86 | 0.077 | 6.53 | 9.23 | 0.429 | |
| 100 | 22.31 | 34.40 | 0.061 | 5.15 | 9.22 | 0.247 | |
| 200 | 15.75 | 34.59 | 0.048 | 4.59 | 9.23 | 0.054 | |
| 平均值 | 22.43 | 34.18 | 0.063 | 5.70 | 9.23 | 0.286 | |
D4 | 5m | 25.77 | 33.78 | 0.067 | 6.53 | 191.11 | 0.208 |
| 50m | 25.77 | 33.80 | 0.073 | 6.53 | 104.82 | 0.258 | |
| 100m | 24.11 | 34.26 | 0.062 | 5.85 | 16.24 | 0.236 | |
| 200m | 15.41 | 34.58 | 0.054 | 4.24 | 9.23 | 0.052 | |
| 平均值 | 22.76 | 34.11 | 0.064 | 5.79 | 80.34 | 0.189 | |
D5 | 5m | 25.31 | 33.97 | 0.077 | 6.66 | 286.25 | 0.164 |
| 50m | 25.27 | 33.97 | 0.072 | 6.61 | 186.06 | 0.367 | |
| 100m | 25.27 | 33.98 | 0.083 | 6.57 | 104.54 | 0.355 | |
| 200m | 15.65 | 34.58 | 0.042 | 3.94 | 9.22 | 0.053 | |
| 平均值 | 22.78 | 34.12 | 0.069 | 5.95 | 146.52 | 0.235 | |
D6 | 5m | 26.32 | 33.59 | 0.061 | 4.24 | 108.22 | 0.139 |
| 50m | 26.01 | 33.65 | 0.077 | 6.39 | 9.20 | 0.439 | |
| 100m | 19.94 | 34.56 | 0.060 | 4.49 | 9.23 | 0.184 | |
| 200m | 14.12 | 34.53 | 0.042 | 4.17 | 9.23 | 0.052 | |
| 平均值 | 21.60 | 34.08 | 0.060 | 4.82 | 33.96 | 0.204 |
表3 各重金属的主成分载荷值Tab. 3 Loads of principle components for each heavy metal |
| 重金属 | 成分 | ||
|---|---|---|---|
| 第一主成分(F1) | 第二主成分(F2) | 第三主成分(F3) | |
| Cu | 0.820 | 0.100 | -0.535 |
| Pb | 0.843 | 0.005 | -0.451 |
| Zn | 0.922 | 0.083 | -0.347 |
| Cd | -0.232 | 0.906 | 0.030 |
| Ni | 0.333 | 0.767 | -0.098 |
| Cr | 0.674 | 0.176 | 0.520 |
| As | -0.366 | 0.869 | 0.053 |
| Fe | 0.811 | -0.014 | 0.540 |
| Mn | 0.791 | 0.004 | 0.517 |
表4 本研究与南海海域已有海水重金属质量浓度(单位: µg·L-1)研究的比较Tab. 4 Comparison with previous studies on the seawater heavy metal in South China Sea |
| 研究海域 | 海水 层位 | 采样 时间 | Cu | Pb | Zn | Cd | Ni | Cr | As | Hg | Fe | Mn | 参考文献 |
|---|---|---|---|---|---|---|---|---|---|---|---|---|---|
| 南海海域背景值 | 表层<10m | 1998年6月和 11月 | 0.014~0.41 | 0.006~0.27 | 0.013~0.35 | 0.001~0.072 | n.a. | n.a. | n.a. | n.a. | n.a. | n.a. | 于涛(2003) |
| 西沙海域 | 表层5m | 2004年 | 0.87~4.33 | 0.79~3.89 | 0.41~1.44 | 0.01~1.00 | 2.09~8.46 | 0.05~0.23 | n.d.~0.02 | 0.20~1.50 | 0.67~0.99 | 周静等(2007) | |
| 南海中南部海域 | 0m、200m、500m | 2010年秋季 | 0.244~2.61 | 0.026~10.2 | 1.00~139 | 0.037~ 0.909 | n.a. | 0.314~0.908 | 0.032~3.46 | n.a. | n.a. | n.a. | 李景喜等(2013) |
| 北部湾和三亚湾 珊瑚生长区 | 表层2~10m | 2015年8—10月 | 0.40~1.52 | 0.12~3.06 | 3.25~14.67 | n.d.~ 0.55 | n.a. | 0.58~1.24 | 0.51~1.93 | 0.013~0.14 | n.a. | n.a. | 杨华等(2017) |
| 中沙和西沙岛礁区 | 表层 | 2015年夏 | n.d.~4.119 | n.d.~4.904 | 0.284~6.976 | 0.005~0.138 | n.a. | n.d.~0.589 | 0.041~0.553 | n.a. | n.a. | n.a. | 王璐等(2017) |
| 七连屿海域 | 表层 | 2017年8月 | 0.13~0.66 | 0.13~3.82 | 3.3~14.0 | 0.011~0.399 | n.a. | 0.7~1.4 | n.d.~ 1.7 | n.d.~0.029 | n.a. | n.a. | 贺仕昌等(2020) |
| 永兴岛海域 | 表层 | 2020年5月 | 0.40 | 0.36 | 3.1 | 0.04 | n.a. | 0.03 | 1.7 | 0.014 | n.a. | n.a. | 贺仕昌等(2021) |
| 西沙海域海水 | 5m或20m、50m、 100m、200m | 2021年12月 | 0.195~82.34 | n.d.~0.98 | 0.565~59.61 | 0.065~0.24 | 0.248~3.99 | 0.245~0.44 | 2.593~3.94 | n.d. | 0.098~4.19 | 0.21~3.44 | 本研究 |
注: n.d.表示未检出; n.a.表示未报道 |
| [1] |
陈斌, 尹晓娜, 姜广甲, 等, 2021. 珠江口外陆架海域表层沉积物重金属潜在生态风险评价及来源分析[J]. 应用海洋学学报, 40(3): 520-528.
|
| [2] |
陈敏, 2009. 化学海洋学[M]. 北京: 海洋出版社. (in Chinese)
|
| [3] |
国家环境保护局, 1998. 海水水质标准: GB3097-1997[S]. 北京: 中国标准出版社. (in Chinese)
|
| [4] |
国家质量技术监督局, 2007. 海洋监测规范第3部分:样品采集, 贮存与运输 (GB 17378. 2-2007)[S]. 北京: 中国标准出版社. (in Chinese)
|
| [5] |
贺仕昌, 陈巧弟, 陈三江, 等, 2021. 永兴岛海域表层海水及沉积物重金属环境质量评估[J]. 海洋技术学报, 40(5): 71-77.
|
| [6] |
贺仕昌, 蔚广鑫, 王德鸿, 等, 2020. 七连屿海域表层海水及沉积物重金属环境质量评估[J]. 应用海洋学学报, 39(2): 246-252.
|
| [7] |
黄以琛, 李炎, 邵浩, 等, 2008. 北部湾夏冬季海表温度、叶绿素和浊度的分布特征及调控因素[J]. 厦门大学学报(自然科学版), 47(6): 856-863.
|
| [8] |
霍文冕, 暨卫东, 许昆灿, 2002. 南海表层水中的溶解态Cu, Pb, Zn, Cd[J]. 海洋学报, 24(4): 44-50.
|
| [9] |
暨卫东, 2011. 中国近海海洋环境质量现状与背景值研究[M]. 北京: 海洋出版社. (in Chinese)
|
| [10] |
康霖, 2016. 西沙群岛海洋渔业资源调查研究[J]. 海洋与渔业, (2): 64-66. (in Chinese)
|
| [11] |
李景喜, 李俊飞, 郑立, 等, 2013. 南海中南部水域海水中重金属的分布特征[J]. 中国环境监测, 29(3): 65-71.
|
| [12] |
李荣凤, 王文质, 黄企洲, 1994. 南海夏季海流的数值模拟[J]. 大气科学, (3): 257-262.
|
| [13] |
彭加喜, 刘金铃, 徐向荣, 等, 2014. 西沙永兴岛珊瑚重金属水平及其富集效应[J]. 海洋环境科学, 33(6): 848-853.
|
| [14] |
孙立广, 赵三平, 刘晓东, 等, 2005. 西沙群岛生态环境报告[J]. 自然杂志, 27(2): 79-84.
|
| [15] |
谭趣孜, 梁文, 2011. 广西涠洲岛附近海域水质现状评价与分析[J]. 广西轻工业, (10): 107-108. (in Chinese)
|
| [16] |
王璐, 余克服, 王英辉, 等, 2017. 南海中沙群岛、西沙群岛珊瑚岛礁区海水重金属的分布特征[J]. 热带地理, 37(5): 718-727.
|
| [17] |
杨华, 王少鹏, 余克服, 等, 2017. 南海北部珊瑚生长区海水重金属污染特征[J]. 生态环境学报, 26(2): 253-260.
|
| [18] |
于涛, 2003. 南海海水中溶解态铜、铅、锌、镉环境背景值的初步研究[J]. 台湾海峡, 22(3): 329-333.
|
| [19] |
赵德, 卢先刚, 庞东豪, 等, 2022. 南海海流环境特征及其对深水钻井装置的影响研究[J]. 中国资源综合利用, 40(2): 65-67.
|
| [20] |
周静, 杨东, 彭子成, 等, 2007. 西沙海域海水中溶解态重金属的含量及其影响因子[J]. 中国科学技术大学学报, (8): 1036-1042.
|
| [21] |
|
| [22] |
|
| [23] |
|
| [24] |
|
| [25] |
|
| [26] |
|
| [27] |
|
| [28] |
|
| [29] |
|
| [30] |
|
/
| 〈 |
|
〉 |
