
Journal of Tropical Oceanography >
Three-dimensional numerical simulation of the influence of excavation pit on the hydrodynamic characteristics of solitary wave on fringing reef
Copy editor: LIN Qiang
Received date: 2023-03-23
Revised date: 2023-04-28
Online published: 2023-03-13
Supported by
National Key Research and Development Program of China(2022YFC3103601)
National Natural Science Foundation of China(51839002)
Natural Science Foundation of Hunan Province, China(2021JJ20043)
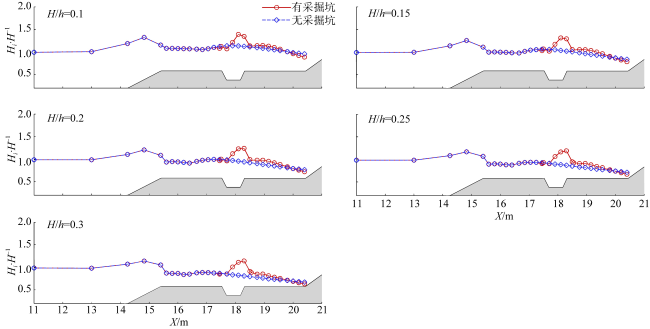
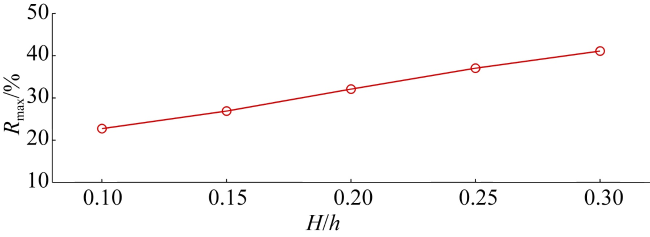
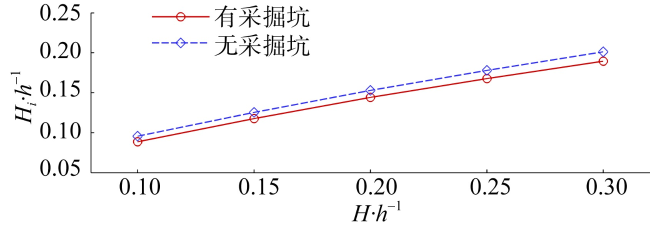
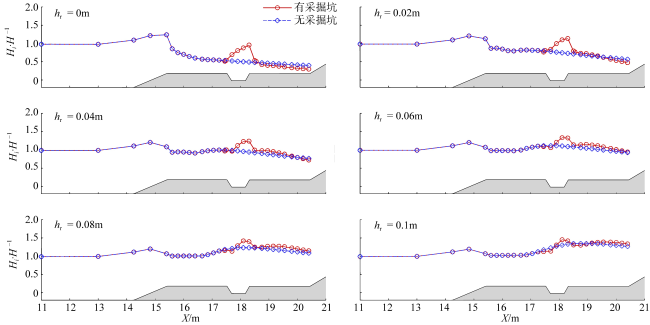
Based on a non-hydrostatic wave model, a series of three-dimensional high-precision numerical calculations were carried out, and the influence mechanism of artificial excavation pit on the hydrodynamic characteristics of solitary wave over fringing reef was analyzed in depth by comprehensively considering the influence of incident wave height, water depth, the width and location of the excavation pit. The calculation results show that the artificial excavation pit has a certain blocking effect on the propagation of solitary waves on the fringing reef, resulting in a significant increase in the local wave height near the excavation pit, and also causing the wave height near the shoreline to decrease. The maximum rate of increase in local wave height is affected by the incident wave height, submergence water depths of the reef, and the width and location of the excavation pit. The greater the incident wave height, the greater the maximum rate of increase in local wave height, the greater the submergence water depths of the reef, the smaller maximum rate of increase in local wave height, the larger the width of the excavation pit, and the greater the maximum rate of increase in local wave height. In addition, the presence of the excavation pit reduces the maximum wave runup height, but changes in the width and position of the excavation pit have a limited effect on maximum wave runup height.
LI Junjie , QU Ke , WANG Xu . Three-dimensional numerical simulation of the influence of excavation pit on the hydrodynamic characteristics of solitary wave on fringing reef[J]. Journal of Tropical Oceanography, 2023 , 42(6) : 42 -51 . DOI: 10.11978/2023005
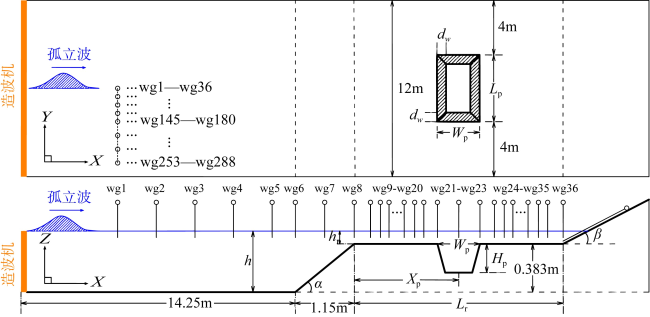
图4 带采掘坑岸礁计算区域布置Fig. 4 Computational layout for fringing reef with an excavation pit |
表1 数值模拟工况表Tab. 1 Parameter setup of numerical simulation |
| 工况 | 入射波高/m | 礁坪水深/m | 采掘坑宽度/m | 采掘坑位置/m |
|---|---|---|---|---|
| A1 | 0.0423 | 0.04 | 0 | 0 |
| A2 | 0.06345 | 0.04 | 0 | 0 |
| A3 | 0.0846 | 0.04 | 0 | 0 |
| A4 | 0.10575 | 0.04 | 0 | 0 |
| A5 | 0.1269 | 0.04 | 0 | 0 |
| B1 | 0.0423 | 0.04 | 0.8 | 2.5 |
| B2 | 0.06345 | 0.04 | 0.8 | 2.5 |
| B3 | 0.0846 | 0.04 | 0.8 | 2.5 |
| B4 | 0.10575 | 0.04 | 0.8 | 2.5 |
| B5 | 0.1269 | 0.04 | 0.8 | 2.5 |
| C1 | 0.0846 | 0 | 0 | 0 |
| C2 | 0.0846 | 0.02 | 0 | 0 |
| C3 | 0.0846 | 0.06 | 0 | 0 |
| C4 | 0.0846 | 0.08 | 0 | 0 |
| C5 | 0.0846 | 0.1 | 0 | 0 |
| D1 | 0.0846 | 0 | 0.8 | 2.5 |
| D2 | 0.0846 | 0.02 | 0.8 | 2.5 |
| D3 | 0.0846 | 0.06 | 0.8 | 2.5 |
| D4 | 0.0846 | 0.08 | 0.8 | 2.5 |
| D5 | 0.0846 | 0.1 | 0.8 | 2.5 |
| E1 | 0.0846 | 0.04 | 0.4 | 2.5 |
| E2 | 0.0846 | 0.04 | 0.6 | 2.5 |
| E3 | 0.0846 | 0.04 | 1.0 | 2.5 |
| E4 | 0.0846 | 0.04 | 1.2 | 2.5 |
| F1 | 0.0846 | 0.04 | 0.8 | 0.4 |
| F2 | 0.0846 | 0.04 | 0.8 | 1.45 |
| F3 | 0.0846 | 0.04 | 0.8 | 3.55 |
| F4 | 0.0846 | 0.04 | 0.8 | 4.6 |
图5 不同时刻速度云图左列为无采掘坑岸礁; 右列为有采掘坑岸礁… Fig. 5 Snapshots of water velocity contour at different time moments. Left side: fringing reef without excavation pit; right side: fringing reef with excavation pit |
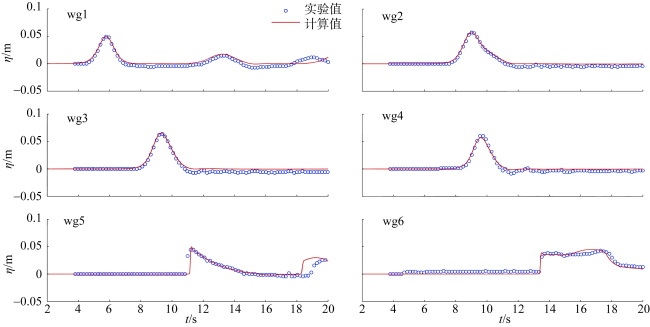
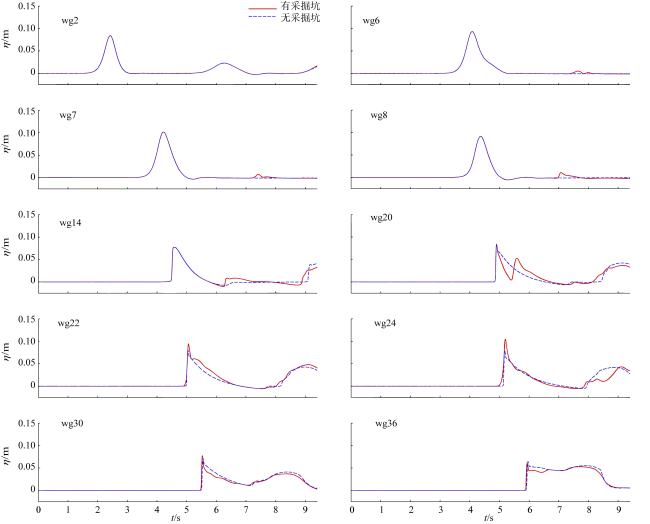
图6 计算区域中心线上不同测点自由液面随时间变化Fig. 6 Time series of water elevations recorded at different wave gauges on the centerline of the domain |
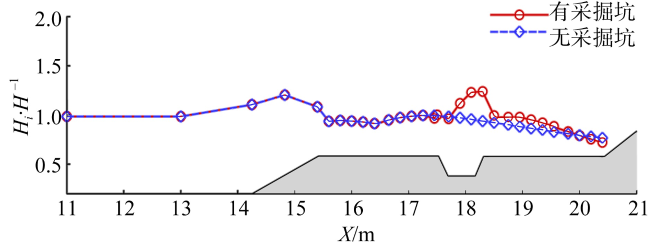
图7 计算区域中心线上最大波高的空间分布Fig. 7 Spatial distributions of the maximum wave height at the centerline of the domain |
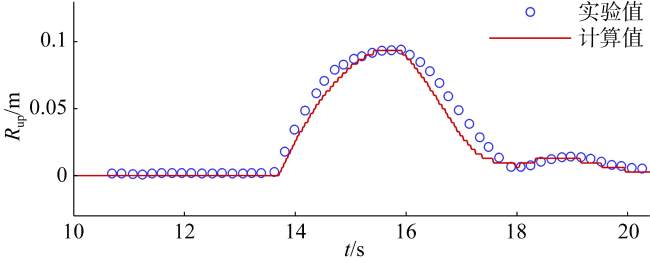
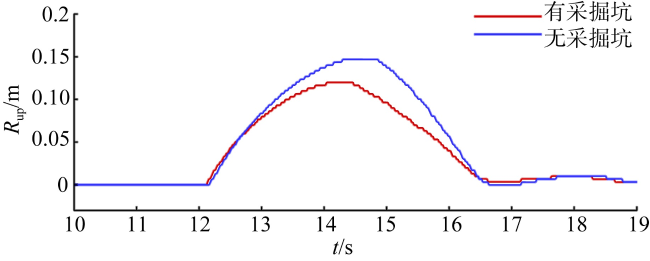
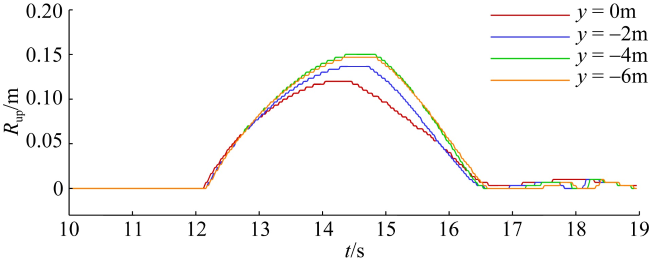
图8 计算区域中心线上波浪爬高随时间变化Fig. 8 Temporal evolutions of wave runup height at the centerline of the domain |
图10 在不同入射波高下计算区域中心线上最大波高的空间分布Fig. 10 Spatial distributions of the maximum wave height at the centerline of the domain under different incident wave heights |
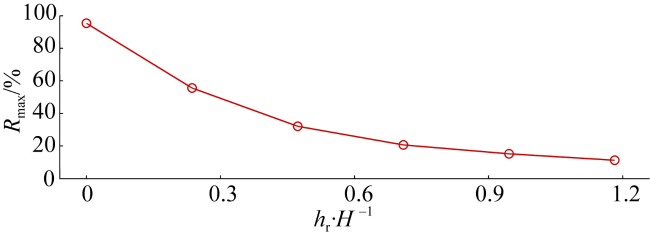
图11 不同入射波高下局部波高最大增幅Fig. 11 Maximum rate of increase in local wave height under different incident wave heights |
图13 不同礁坪水深下计算区域中心线上最大波高的空间分布Fig. 13 Spatial distributions of the maximum wave height at the centerline of the domain under different submergence water depths |
图14 不同礁坪水深下局部波高最大增幅Fig. 14 Maximum rate of increase in local wave height under different submergence water depths |
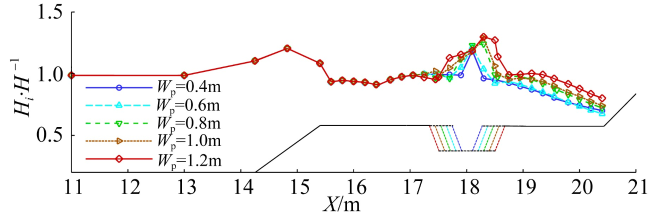
图16 不同采掘坑宽度下计算区域中心线上最大波高的空间分布Fig. 16 Spatial distributions of the maximum wave height at the centerline of the domain under different excavation pit widths |
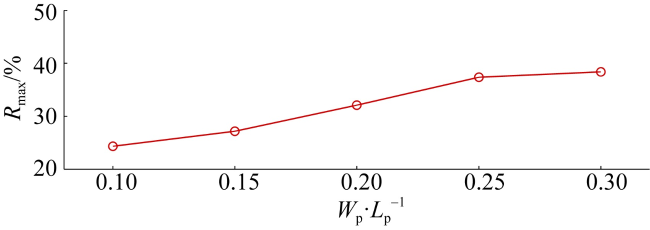
图17 不同采掘坑宽度下局部波高最大增幅Fig. 17 Maximum rate of increase in local wave height under different excavation pit widths |
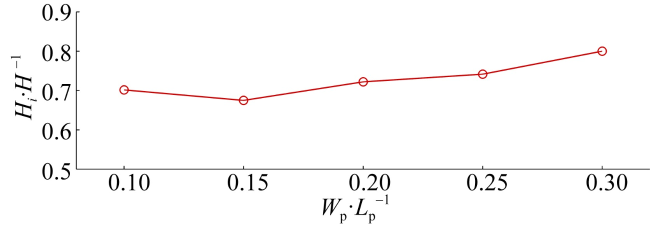
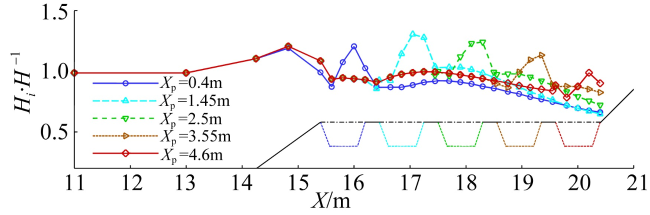
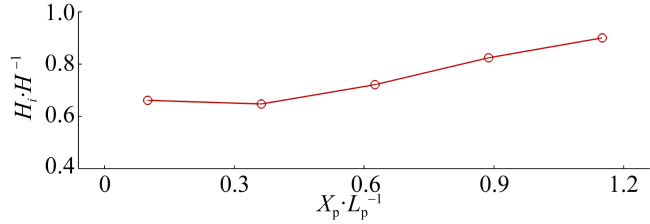
图19 不同采掘坑位置下计算区域中心线上最大波高的空间分布Fig. 19 Spatial distributions of the maximum wave height at the centerline of the domain under different excavation pit locations |
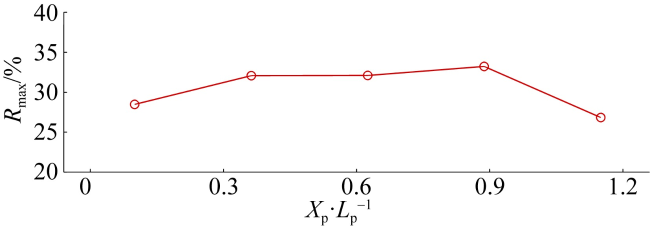
图20 不同采掘坑位置下局部波高最大增幅Fig. 20 Maximum rate of increase in local wave height under different excavation pit locations |
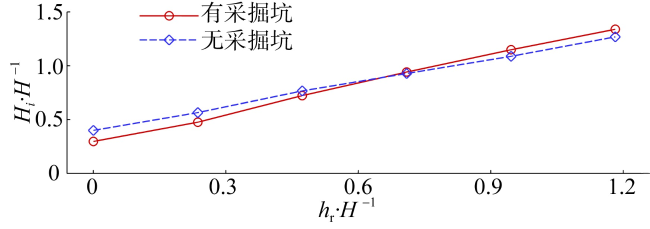
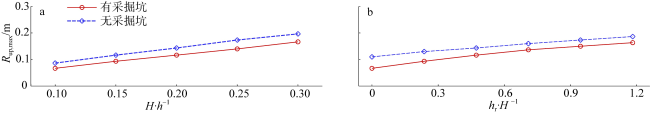
图22 计算区域中心线上最大波浪爬高随入射波高和礁坪水深的变化a. 入射波高的影响; b. 礁坪水深的影响 Fig. 22 Variation of the maximum wave runup at the centerline of the domain with wave heights and submergence water depths. (a) Influence of wave heights; (b) influence of submergence water depths |
| [1] |
|
| [2] |
|
| [3] |
|
| [4] |
|
| [5] |
|
| [6] |
|
| [7] |
|
| [8] |
|
| [9] |
|
| [10] |
|
| [11] |
|
| [12] |
|
| [13] |
|
| [14] |
|
| [15] |
|
| [16] |
|
| [17] |
|
| [18] |
|
| [19] |
|
/
| 〈 |
|
〉 |

