
Journal of Tropical Oceanography >
In situ rapid analytical method for ammonia nitrogen concentration in estuarine zone*
Copy editor: SUN Cuici
Received date: 2023-10-08
Revised date: 2023-10-25
Online published: 2023-12-11
Supported by
Research and Development Projects in Key Areas of Guangdong Province(2020B1111020004)
Science and Technology Planning Project of Guangzhou Nansha District Guangzhou City China(2022ZD001)
National Key Research and Development Program(2016YFC1400603)
National Key Research and Development Program(2017YFC0506305)
Guangdong Basic and Applied Basic Research Foundation(2021A1515110639)
Hainan Provincial Natural Science Foundation of China(422QN441)
Open Project Program of the State Key Laboratory of Tropical Oceanography(LTOZZ2003)
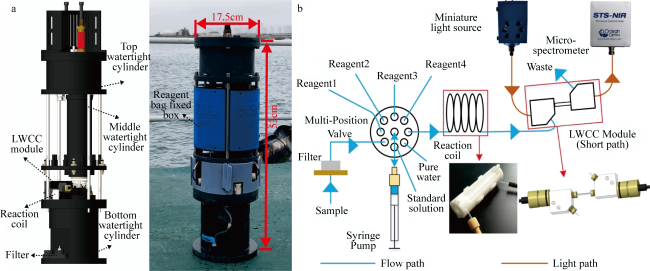
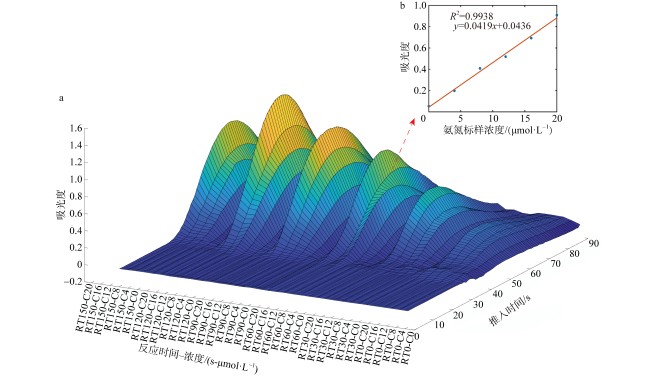
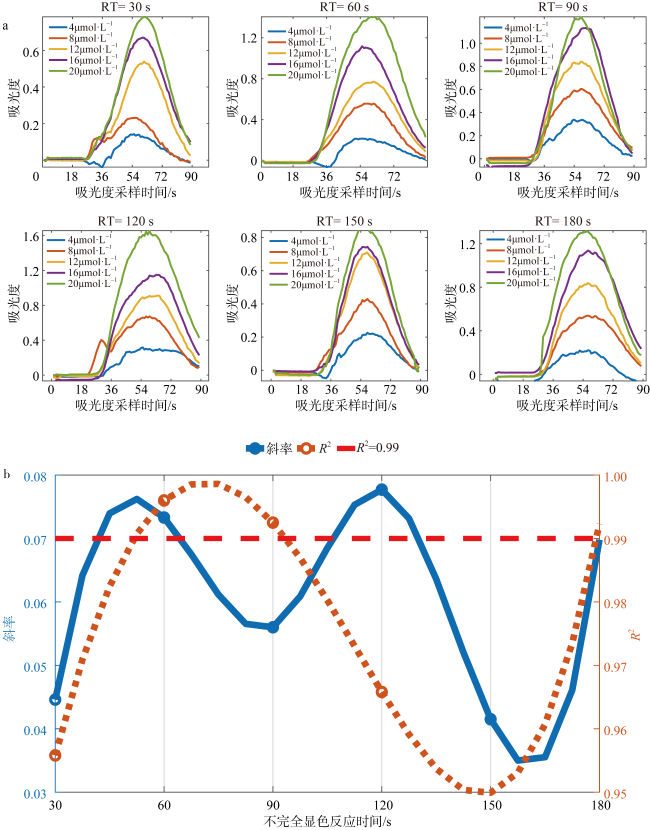
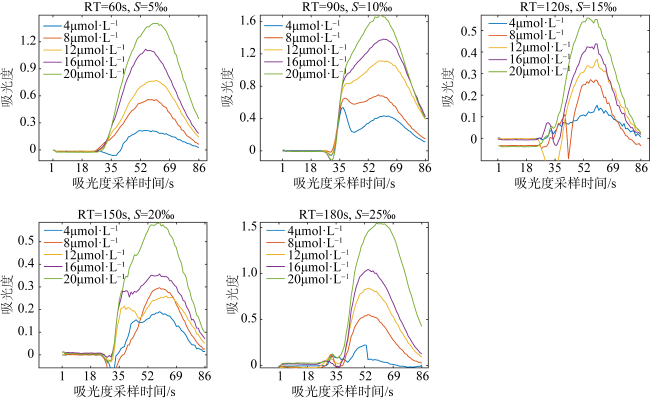
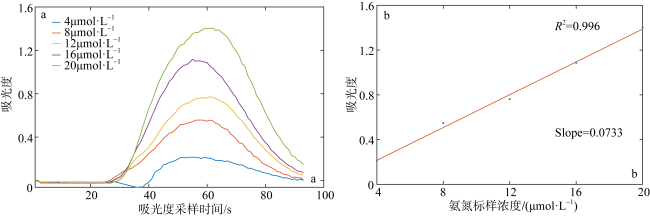
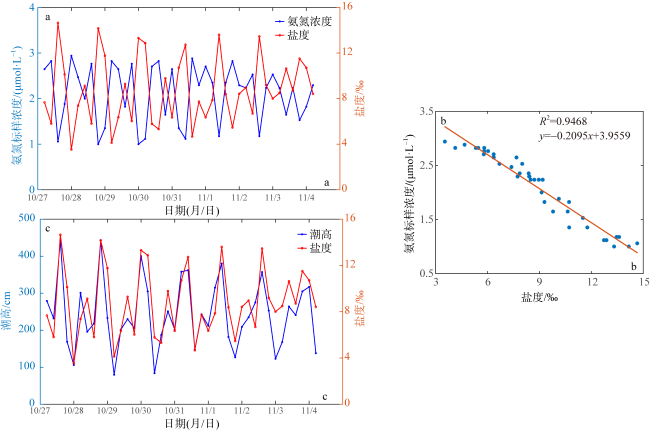
With the goal of in situ reliable measuring of the ammonia nitrogen by a self-developed in situ analyzer, a rapid analysis method for ammonia nitrogen concentration in estuarine zones has been established based on the improved indophenol blue spectrophotometry. Through the orthogonal experimental analysis on the incomplete chromogenic reaction time and salinity, the optimal incomplete chromogenic reaction time for in situ automated rapid measurements under different salinity conditions has been established and the variation of the optimal incomplete chromogenic reaction time of the samples with salinity in each range has been determined. The study shows that the optimal reaction time for the rapid measurement of ammonia nitrogen in the range of salinity from 0‰ to 25‰ gradually increases with the increase of salinity and the minimum reaction time is 60s (salinity: 5‰) and the maximum reaction time is 180s (salinity: 25‰). With a 10 cm LWCC (liquid waveguide capillary cell) and 60s reaction time, the detection limit of this method acquired by taking 11 parallel samples of blank samples is 0.9945 μmol·L-1 (salinity: 5‰), and the R2 of the standard working curve of the method was more than 0.99, which proved that the improved indophenol blue spectrophotometric method can meet the in situ rapid analysis of ammonia nitrogen in estuarine zones. The in situ analyzer has deployed in the Zhanjiang Bay for the time series monitoring of ammonia nitrogen concentration, and the monitoring data revealed that there is a good negative correlation between the ammonia nitrogen concentration and the salinity in the Zhanjiang Bay during the monitoring period. The consumption of samples and reagents during the detection and analysis process is very small (μL), and the reaction time is short (60 s, salinity: 5‰), and these features make the analyzer ideally suited for long time series monitoring of ammonia nitrogen concentration in estuarine waters.
HE Jiawei , YANG Zeming , ZHAO Jincheng , ZHANG Xianqing , LI Cai , LI Zhihao , LIN Yongquan , CHEN Rong . In situ rapid analytical method for ammonia nitrogen concentration in estuarine zone*[J]. Journal of Tropical Oceanography, 2024 , 43(4) : 144 -152 . DOI: 10.11978/2023144
图4 不同盐度(S)、不同显色反应时间下氨氮吸光度Fig. 4 Absorbance of ammonia nitrogen at different salinity and different color development reaction time |
表1 不同盐度、不同显色反应时间下R2Tab. 1 R2 at different salinity and different color development reaction time |
| 盐度/‰ | 显色反应时间/s | R2 |
|---|---|---|
| 5 | 30 | 0.9558 |
| 60 | 0.9960 | |
| 90 | 0.9925 | |
| 120 | 0.9658 | |
| 150 | 0.9499 | |
| 180 | 0.9923 | |
| 10 | 30 | 0.9855 |
| 60 | 0.8522 | |
| 90 | 0.9932 | |
| 120 | 0.9594 | |
| 150 | 0.9431 | |
| 180 | 0.6930 | |
| 15 | 30 | 0.9744 |
| 60 | 0.9478 | |
| 90 | 0.9592 | |
| 120 | 0.9910 | |
| 150 | 0.9648 | |
| 180 | 0.7663 | |
| 20 | 30 | 0.5760 |
| 60 | 0.5031 | |
| 90 | 0.6916 | |
| 120 | 0.7983 | |
| 150 | 0.9939 | |
| 180 | 0.9391 | |
| 25 | 30 | 0.9466 |
| 60 | 0.9772 | |
| 90 | 0.8984 | |
| 120 | 0.9823 | |
| 150 | 0.9901 | |
| 180 | 0.9924 |
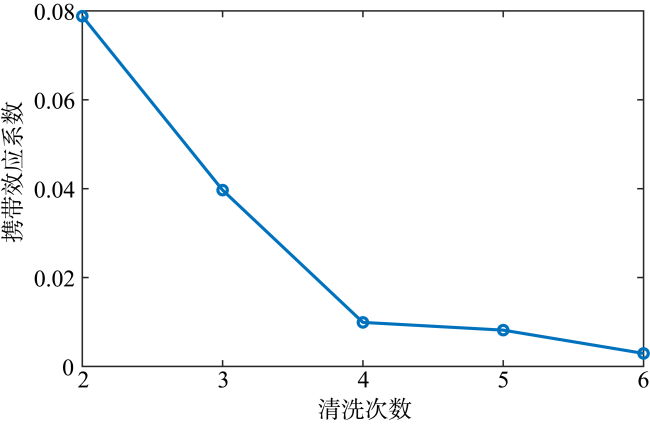
图5 氨氮原位分析及携带效应检测结果Fig. 5 Carryover effect detection results of ammonia nitrogen analyzer |
表2 不同清洗次数下空白样和氨氮标液的吸光度及携带效应系数Tab. 2 Absorbance and carryover effect coefficients of blank samples and ammonia nitrogen standard solutions at different washing times |
| 清洗次数 | 携带效应系数 | 第1次吸光度 (空白样) | 第2次吸光度 (高浓度样品) | 第3次吸光度 (空白样) |
|---|---|---|---|---|
| 2 | 0.079 | 0.24 | 2.04 | 0.40 |
| 3 | 0.040 | 0.27 | 1.98 | 0.35 |
| 4 | 0.010 | 0.18 | 2.07 | 0.16 |
| 5 | 0.008 | 0.21 | 1.21 | 0.20 |
| 6 | 0.003 | 0.34 | 1.94 | 0.34 |
表3 盐度5‰空白样品平行检测吸光度值及其标准偏差SDTab. 3 Absorbance values at 695nm and their standard deviations SD for parallel detection of salinity 5‰ blank samples |
| 次数 | Abs695 | 次数 | Abs695 | SD |
|---|---|---|---|---|
| 1 | 0.23 | 7 | 0.20 | 0.02 |
| 2 | 0.18 | 8 | 0.17 | |
| 3 | 0.21 | 9 | 0.19 | |
| 4 | 0.18 | 10 | 0.18 | |
| 5 | 0.15 | 11 | 0.16 | |
| 6 | 0.17 |
表4 盐度5‰的12μmol·L-1标样平行检测吸光度值Abs695及其相对标准偏差RSDTab. 4 Absorbance values at 695nm and their relative standard deviations RSD for parallel testing of 12 μmol·L-1 water samples with salinity 5‰ |
| 次数 | Abs695 | 次数 | Abs695 | RSD |
|---|---|---|---|---|
| 1 | 0.76 | 7 | 0.91 | 7.6% |
| 2 | 0.75 | 8 | 0.89 | |
| 3 | 0.81 | 9 | 0.87 | |
| 4 | 0.89 | 10 | 0.94 | |
| 5 | 0.86 | 11 | 0.93 | |
| 6 | 0.91 |
| [1] |
何露露, 杨平, 谭立山, 等, 2019. 福州地区海湾和河口潮汐沼泽湿地秋季上覆水营养盐分布特征[J]. 环境科学, 40(4): 1788-1796.
|
| [2] |
施玉珍, 赵利容, 柯盛, 等, 2013. 湛江湾海域营养盐的时空分布特征及潜在性富营养化研究[C]//热带海洋科学学术研讨会暨第八届广东海洋湖沼学会、第七届广东海洋学会会员代表大会论文及摘要汇编. 北京: 中国学术期刊电子出版社, 395-401,
|
| [3] |
石泳昊, 贾良文, 张恒, 等, 2021. 湛江湾内湾环境容量计算与排污治理[J]. 热带海洋学报, 40(4): 134-142.
|
| [4] |
王丽芳, 黄韬, 杜川军, 等, 2021. 不同海水营养盐现场连续观测系统的比较研究[J]. 热带海洋学报, 40(3): 103-113.
|
| [5] |
中华人民共和国国家质量监督检验检疫总局,中国国家标准化管理委员会, 2007. GB 17378. 4-2007 海洋监测规范第4部分: 海水分析[S]. 北京: 中国标准出版社: 109-111.
GENERAL ADMINISTRATION OF QUALITY SUPERVISION,INSPECTION AND QUARANTINE OF THE PEOPLE’S REPUBLIC OF CHINA, STANDARDIZATION ADMINISTRATION OF THE PEOPLE’S REPUBLIC OF CHINA, 2007. GB 17378. 4-2007 The specification for marine monitoring—Part 4: Seawater analysis[S]. Beijing: Standards Press of China: 109-111 (in Chinese).
|
| [6] |
|
| [7] |
|
| [8] |
|
| [9] |
|
| [10] |
|
| [11] |
|
| [12] |
|
| [13] |
|
| [14] |
|
| [15] |
|
| [16] |
|
| [17] |
|
| [18] |
|
| [19] |
|
| [20] |
|
| [21] |
|
| [22] |
|
| [23] |
|
/
| 〈 |
|
〉 |
