
Journal of Tropical Oceanography >
Statistical study on the influence of typhoon with different path on the temperature of coastal waters of China
Received date: 2023-10-04
Revised date: 2023-12-07
Online published: 2023-12-13
Supported by
National Key Research and Development Program(2022YFC3104000)
Jiangsu Province Marine Science and Technology Innovation Project(JSZRHYKJ202304)
Based on the best typhoon track data provided by the China Meteorological Administration, according to K-means clustering analysis, typhoons entering the coastal waters of China from the West Pacific Warm Pool from 2002 to 2021 are divided into three types, and the three types are named as westward path typhoon, northwestward path typhoon and turning path typhoon according to typhoon path characteristics. In addition, the optimal daily product of sea surface temperature interpolation provided by remote sensing systems (REMSS) and simulation results of coupled ocean atmosphere wave sediment transport modeling system (COAWST) are used to study the changes of upper ocean temperature caused by these three typhoons with different path. The results show that the influence characteristics of three different typhoon paths on sea surface temperature (SST) are mainly reflected in the cooling amplitude and recover time: the turning typhoon exhibits the largest cooling amplitude and the longest-lasting effect on sea surface temperature, followed by the northwestward typhoon, the westward typhoon has the smallest cooling amplitude and the shortest duration of impact. The difference of three different typhoon paths on the mixed layer thickness (MLT) and thermocline thickness (TT) are mainly reflected in the rangeability of thickness and recovery time: for the rangeability of MLT and TT, the turning typhoon is the largest, followed by the northwestward typhoon, and the westward typhoon is the least. For the recovery speed of MLT and TT, the northwestward typhoon is obviously faster than the westward typhoon and the turning typhoon.
SUN Zeming , HAN Shuzong , WANG Mingjie , SU Hanxiang . Statistical study on the influence of typhoon with different path on the temperature of coastal waters of China[J]. Journal of Tropical Oceanography, 2024 , 43(5) : 17 -31 . DOI: 10.11978/2023141
表1 两种最优插值海表面温度数据集的时空范围及对应所用到的传感器Tab. 1 Spatiotemporal ranges of two optimal interpolated sea surface temperature data sets and corresponding sensors used |
| 传感器 | 空间范围 | 时间范围 | |
|---|---|---|---|
| MW | TMI, AMSR-E, AMSR2, WindSat, GMI | 在2002-06-01之前: 40°S—40°N 在2002-06-01之后: 全球 | 1998-01-01 至今 |
| MW_IR | MW: TMI, AMSR-E, AMSR2,WindSat, GMI IR: MODIS-Terra, MODIS-Aqua, VIIRS-NPP, VIIRS-N20 | 全球 | 2002-06-01 至今 |
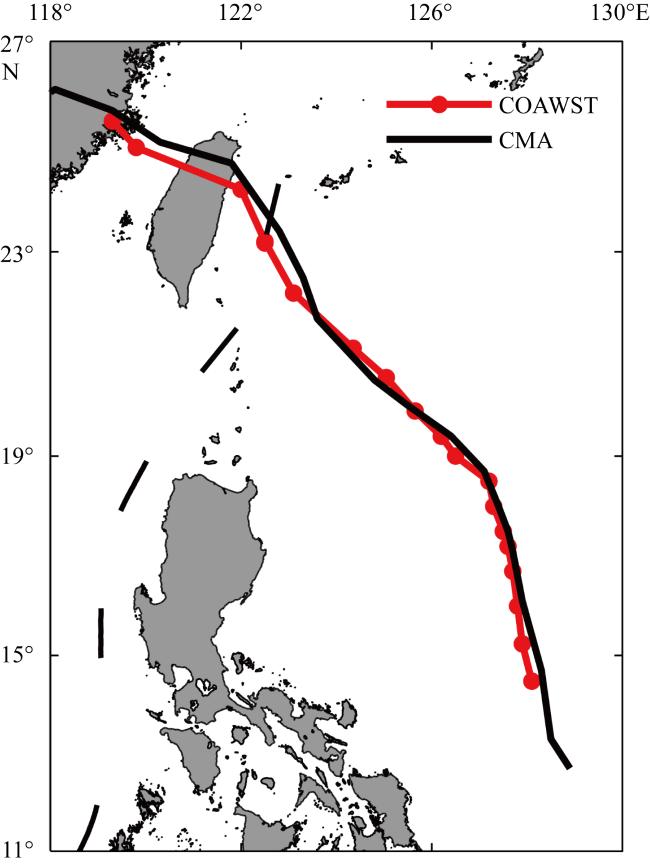
图1 1709号台风“纳沙”的部分移动路径该图基于国家测绘地理信息局标准地图服务网站下载的审图号为GS(2016)1611号标准地图制作, 底图无修改。图中黑色实线为中国气象局(CMA)热带气旋资料中心的最佳路径, 红色实线为COAWST耦合模式的模拟路径 Fig. 1 The path of No. 1709 typhoon “Nesat”. The black solid line is the best track provided by the tropical cyclone data center of the CMA, and the red solid line is the simulated path of COAWST coupling mode |
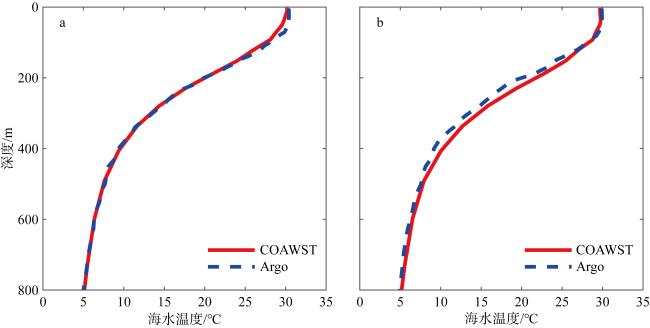
图2 1709号台风“纳沙”过境前后台风路径附近的Argo与COAWST耦合模式的温度剖面对比a. 台风过境前Argo剖面数据与COAWST剖面数据对比。图中蓝色虚线为2902656号Argo的第169个剖面数据, 红色实线为COAWST模拟结果的温度剖面; b. 台风过境后Argo剖面数据与COAWST剖面数据对比。图中蓝色虚线为2902656号Argo的第170个剖面数据, 红色实线为COAWST模拟结果的温度剖面 Fig. 2 Temperature profile comparison of Argo and COAWST coupling models near the typhoon path before and after the passage of No. 1709 typhoon “Nesat”. The dashed blue line in the figure (a) is the 169th profile data of No. 2902656 Argo, the solid red line is the temperature profile of COAWST simulation results, and the dashed blue line in the figure (b) is the 170th profile data of No. 2902656 Argo, the solid red line is the temperature profile of COAWST simulation results |
表2 不同分类数情况下各类别的台风数量Tab. 2 Number of typhoons of different categories under different classification numbers |
| 第1类台风数量/个 | 第2类台风数量/个 | 第3类台风数量/个 | 第4类台风数量/个 | 第5类台风数量/个 | 第6类台风数量/个 | |
|---|---|---|---|---|---|---|
| 分为2类 | 50 | 33 | - | - | - | - |
| 分为3类 | 31 | 25 | 27 | - | - | - |
| 分为4类 | 7 | 36 | 27 | 13 | - | - |
| 分为5类 | 31 | 25 | 20 | 2 | 5 | - |
| 分为6类 | 13 | 9 | 29 | 25 | 2 | 5 |
注: - 表示不存在此类台风 |
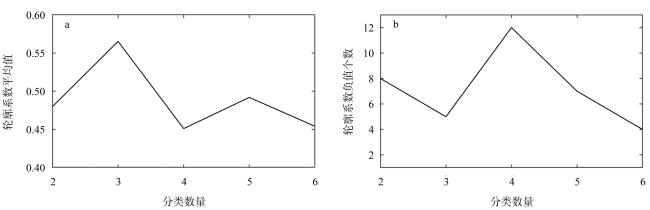
图3 分类数量与轮廓系数平均值(a)和轮廓系数负值个数(b)之间的关系Fig. 3 The relationship between the number of classifications and the mean value of the silhouette coefficient (a) and the number of negative silhouette coefficient (b) |
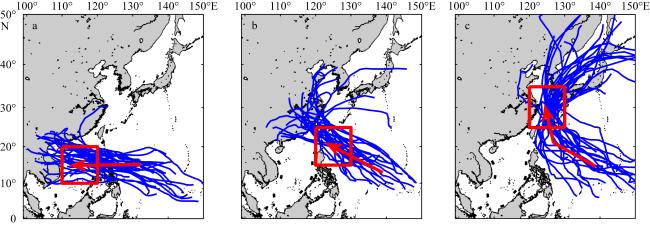
图4 台风路径示意图a. 西行台风路径; b. 西北台风路径; c. 转向台风路径。图中灰色实线为台风样本的路径, 红色箭头为台风样本的主要移动方向, 红色方框为主要研究海域。该图基于国家测绘地理信息局标准地图服务网站下载的审图号为GS(2016)1611号标准地图制作, 底图无修改 Fig. 4 Typhoon track diagram. Westward typhoon (a); Northwestward typhoon (b); turning typhoon (c). Solid gray lines are paths of the typhoon samples, the red arrow is the main moving direction of the typhoon samples, and the red box is the main research area |
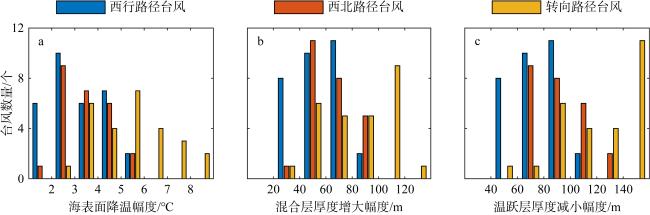
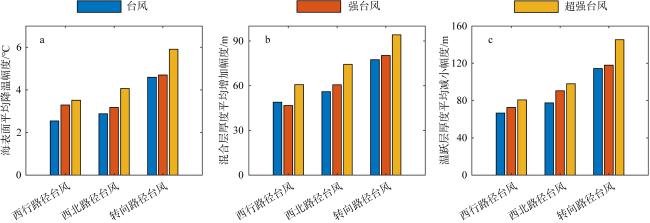
图5 台风样本造成的上层海洋温度变化幅度a. 台风样本造成的海表面降温幅度; b. 台风样本造成的混合层厚度变化幅度; c. 台风样本造成的温跃层变化幅度。图中所展示的信息仅为各变化区间内3种不同台风样本的数量 Fig. 5 Variation of upper ocean temperature induced by typhoon samples. (a) Sea surface cooling amplitude caused by typhoon samples; (b) the variation amplitude of mixed layer thickness caused by typhoon samples; (c) the variation amplitude of thermocline caused by typhoon samples |
表3 3类台风之间各统计量的差异显著性检验结果Tab. 3 The result of significance test of statistics between three kinds of typhoons |
| SST冷却幅度 | MLT增大幅度 | TT减小幅度 | |
|---|---|---|---|
| 西行路径台风与西北路径台风之间各统计量的差异显著性 | 0.3226 | 0.0249 | 0.0071 |
| 西北路径台风与转向路径台风之间各统计量的差异显著性 | 0.00004250 | 0.0052 | 0.00008879 |
| 转向路径台风与西行路径台风之间各统计量的差异显著性 | 0.000002065 | 0.00001813 | 0.0000001063 |
注: 表中展示数据为使用曼-惠特尼U检测法得到的p值, 当p值小于显著性水平0.05时, 认为两组数据存在显著差异 |
表4 不同路径台风对SST的影响特征Tab. 4 Characteristic of influence of different path typhoons on SST |
| 台风数量/个 | 海表面的主要 降温区间/℃ | SST降低幅度/℃ | SST平均 降低幅度/℃ | SST 7d内 恢复占比/% | SST变化偏右 性异常占比/% | ||
|---|---|---|---|---|---|---|---|
| 最大降温幅度 | 最小降温幅度 | ||||||
| 西行台风 | 31 | 2~5 | 5.13 | 1.49 | 3.2 | 83.87 | 29.03 |
| 西北台风 | 25 | 2~5 | 5.89 | 1.79 | 3.5 | 56.00 | 8.00 |
| 转向台风 | 27 | 3~6 | 8.95 | 2.76 | 4.9 | 18.52 | 14.81 |
表5 不同路径台风对MLT的影响特征Tab. 5 Characteristic of influence of different path typhoons on MLT |
| 台风数量/个 | MLT的主要 增加区间/m | MLT增加幅度/m | MLT平均 增大幅度/m | MLT 7d内 恢复占比/% | MLT变化偏右 性异常占比/% | ||
|---|---|---|---|---|---|---|---|
| 最大加深幅度 | 最小加深幅度 | ||||||
| 西行台风 | 31 | 30~70 | 87.10 | 28.05 | 53.78 | 58.06 | 41.94 |
| 西北台风 | 25 | 50~90 | 92.03 | 36.17 | 65.04 | 84.00 | 40.00 |
| 转向台风 | 27 | 70~100 | 133.73 | 34.64 | 84.74 | 62.96 | 37.04 |
表6 不同路径台风对TT的影响特征Tab. 6 Characteristic of influence of different path typhoons on TT |
| 台风数量/个 | TT的主要 减少区间/m | TT减少幅度/m | TT平均 减小幅度/m | TT 7d内 恢复占比/% | TT变化偏右 性异常占比/% | ||
|---|---|---|---|---|---|---|---|
| 最大减少幅度 | 最小减少幅度 | ||||||
| 西行台风 | 31 | 50~90 | 118.50 | 40.84 | 74.63 | 38.71 | 67.74 |
| 西北台风 | 25 | 70~120 | 127.48 | 60.57 | 90.36 | 60.00 | 64.00 |
| 转向台风 | 27 | 90~150 | 180.62 | 58.42 | 125.02 | 37.04 | 59.26 |
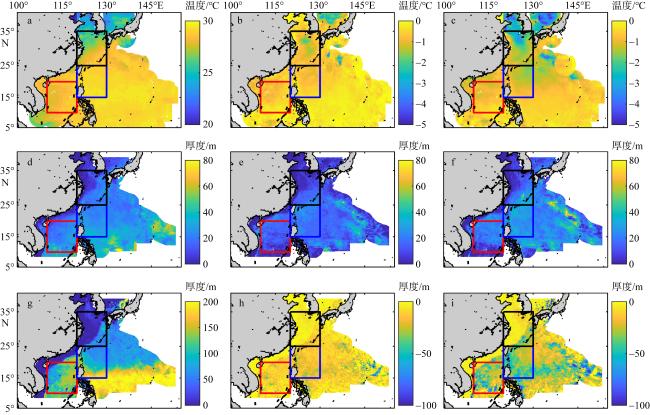
图6 台风样本造成的SST、MLT以及TT的变化幅度的时空特征a. 台风过境前平均SST; b. 台风过境时对海表面的平均降温幅度; c. 台风过境后7d内对海表面的平均降温幅度; d. 台风过境前的平均MLT; e. 台风过境时对MLT的平均增大幅度; f. 台风过境后7d内对MLT的平均增大幅度; g. 台风过境前的平均TT; h. 台风过境时对TT的平均减小幅度; i. 台风过境后7d内对TT的平均减小幅度。黑色方框区域为转向台风的主要影响区域; 蓝色方框区域为西北台风的主要影响区域; 红色方框区域为西行台风的主要影响区域。图中空白区域为台风样本未影响到的区域。该图基于国家测绘地理信息局标准地图服务网站下载的审图号为GS(2016)1611号标准地图制作, 底图无修改 Fig. 6 Temporal and spatial characteristics of the variation amplitude of SST, MLT and TT induced by typhoon samples. (a) The average SST before the typhoon; (b) the average reduction of SST during typhoon transit; (c) the average reduction of SST within 7 days after the passage of the typhoon; (d) average MLT before the typhoon; (e) the average increase of MLT during typhoon transit; (f) the average increase in MLT within 7 days after the typhoon’s passage; (g) average TT before the typhoon; (h) the average reduction of TT during typhoon transit; (i) average reduction of TT within 7 days after the typhoon’s passage. The black box area is the main impact area of the turning typhoon. The area in blue box is the main affected area of the northwestward typhoon. The area in the red box is the main impact area of the westward typhoon. The blank area in the figure is the area not affected by the typhoon samples |
表7 3类台风在其主要影响区域内的特征Tab. 7 The characteristics of each type of typhoon in their main affect areas |
| 到达主要影响区域的时间 | 在主要影响区域内的平均强度(近中心最大风速)/(m·s-1) | 在主要影响区域内的平均移动速度/(km·h-1) | |
|---|---|---|---|
| 西行路径台风 | 7—9月(92.59%) | 45.51 | 25.05 |
| 西北路径台风 | 7—9月(92.00%) | 52.28 | 28.27 |
| 转向路径台风 | 7—9月(74.19%) | 61.37 | 37.22 |
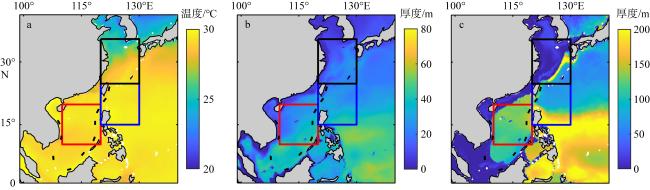
图7 2001—2020年主要影响区域内7—9月的平均SST (a)、MLT (b)和TT (c)该图基于国家测绘地理信息局标准地图服务网站下载的审图号为GS(2016)1611号标准地图制作, 底图无修改。数据来自 https://data.marine.copernicus.eu/product/GLOBAL_REANALYSIS_PHY_001_031/。图中红色、蓝色、黑色方框内分别为西行路径台风、西北路径台风和转向路径台风的主要影响区域 Fig. 7 The average SST (a), MLT (b) and TT (c) from July to September in the mean affect area from 2001 to 2020 (https://data.marine.copernicus.eu/product/GLOBAL_REANALYSIS_PHY_001_031/), the red, blue and black boxes in the figure show the main affect area of the westward typhoon, the northwestward typhoon and the turning typhoon respectively |
表8 3类台风的主要影响区域背景场信息Tab. 8 Background field information of the main affect areas of each type of typhoon |
| 主要影响区域内SST平均值/℃ | 主要影响区域内MLT平均值/m | 主要影响区域内TT平均值/m | ||||
|---|---|---|---|---|---|---|
| 过境前2d平均 | 7—9月平均 | 过境前2d平均 | 7—9月平均 | 过境前2d平均 | 7—9月平均 | |
| 西行路径台风 | 28.49 | 29.28 | 24.08 | 29.01 | 106.05 | 118.02 |
| 西北路径台风 | 29.21 | 29.56 | 25.74 | 27.51 | 100.27 | 114.98 |
| 转向路径台风 | 27.25 | 27.54 | 13.46 | 14.59 | 21.14 | 38.95 |
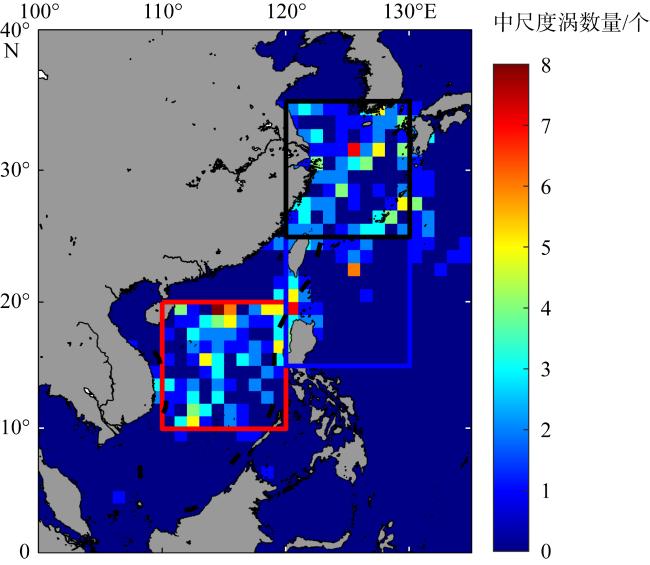
图8 2002—2021年主要影响区域内7—9月的中尺度冷涡数量该图基于国家测绘地理信息局标准地图服务网站下载的审图号为GS(2016)1611号标准地图制作, 底图无修改。数据来自 https://data.aviso.altimetry.fr/aviso-gateway/data/META3.1exp_DT/META3.1exp_DT_twosat/。图中红色、蓝色、黑色方框内分别为西行路径台风、西北路径台风和转向路径台风的主要影响区域 Fig. 8 The number of mesoscale cold vortices from July to September in the mean affect area from 2002 to 2021, using AVISO altimetry data (https://data.aviso.altimetry.fr/aviso-gateway/data/META3.1exp_DT/META3.1exp_DT_twosat/), the red, blue and black boxes in the figure show the main affect area of the westward typhoon, the northwestward typhoon and the turning typhoon respectively |
表9 各类台风在主要影响区域内的平均移动速度和区域的平均水深Tab. 9 The average moving speed of each type typhoon and the average water depth in the main affected area |
| 台风数量/个 | 台风主要影响区域内平均水深/m | 台风在主要影响区域内平均移动速度/(km·h-1) | |
|---|---|---|---|
| 西行台风 | 31 | 2695.0 | 25.05 |
| 西北行台风 | 25 | 4350.3 | 28.27 |
| 转向台风 | 27 | 496.2 | 37.22 |
注: 水深数据来自 https://download.gebco.net |
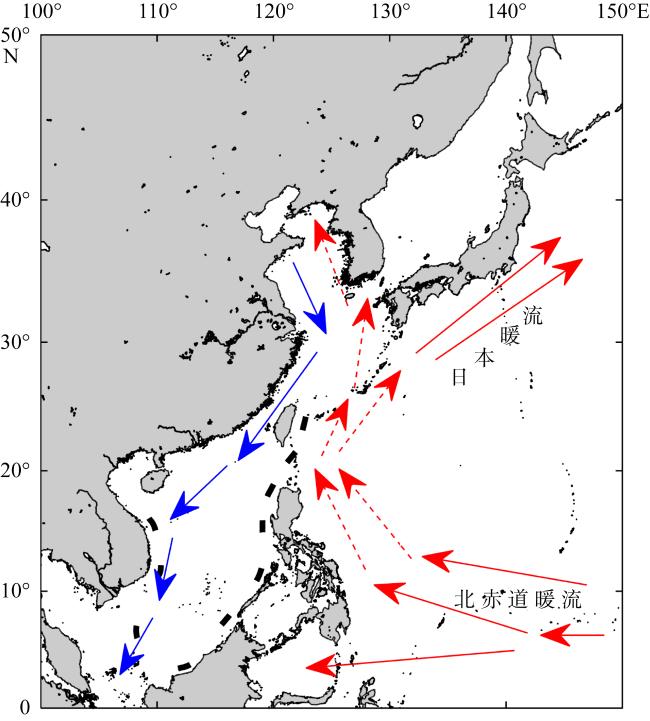
图10 中国近海与西太平洋的主要洋流示意图该图基于国家测绘地理信息局标准地图服务网站下载的审图号为GS(2016)1611号标准地图制作, 底图无修改。图中蓝色箭头为寒流, 红色箭头为暖流, 红色实线为风海流, 红色虚线为补偿流 Fig. 10 The major ocean currents in the coastal waters of China and the Western Pacific Ocean. The blue arrow is the cold current, the red arrow is the warm current, the solid line is the wind current, and the dashed line is the compensation current |
| [1] |
顾润源, 朱官忠, 李振海, 等, 1993. 影响我国的不同路径台风的对比分析[J]. 山东气象, 13(2): 1-5, 15 (in Chinese).
|
| [2] |
韩玉康, 龚立新, 2017. 南海温跃层对台风过程响应的数值模拟研究[J]. 海洋信息, (4): 12-21 (in Chinese).
|
| [3] |
刘增宏, 许建平, 朱伯康, 等, 2006. 利用Argo资料研究2001—2004年期间西北太平洋海洋上层对热带气旋的响应[J]. 热带海洋学报, 25(1): 1-8.
|
| [4] |
孙凡, 于非, 司广成, 等, 2021. 台风过境对黄海冷水团及其环流结构的影响[J]. 海洋与湖沼, 52(5): 1125-1136.
|
| [5] |
徐文玲, 苏洁, 2007. 台风对西北太平洋海表温度的影响[J]. 中国海洋大学学报, 37(S2): 17-22.
|
| [6] |
杨晓霞, 唐丹玲, 2010. 台风引起南海海表面降温的位置变化特征[J]. 热带海洋学报, 29(4): 26-31.
|
| [7] |
叶家成, 杜新观, 余锦华, 2019. 影响中国大陆热带气旋路径分类及其特征研究[J]. 气象科学, 39(3): 304-311.
|
| [8] |
郑颖青, 余锦华, 吴启树, 等, 2013. K-均值聚类法用于西北太平洋热带气旋路径分类[J]. 热带气象学报, 29(4): 607-615.
|
| [9] |
中华人民共和国国家质量监督检验检疫总局, 国家标准化管理委员会, 2006. GB/T 19201-2006 热带气旋等级[S]. 北京: 中国标准出版社.
GENERAL ADMINISTRATION OF QUALITY SUPERVISION, INSPECTION AND QUARANTINE OF THE PEOPLE’S REPUBLIC OF CHINA, NATIONAL STANDARDIZATION ADMINISTRATION, 2006. GB/T 19201-2006 Grade of tropical cyclones[S]. Beijing: Standards Press of China (in Chinese with English abstract).
|
| [10] |
周磊, 陈大可, 雷小途, 等, 2019. 海洋与台风相互作用研究进展[J]. 科学通报, 64(1): 60-72.
|
| [11] |
|
| [12] |
|
| [13] |
|
| [14] |
|
| [15] |
|
| [16] |
|
| [17] |
|
| [18] |
|
| [19] |
|
| [20] |
|
| [21] |
|
| [22] |
|
| [23] |
|
| [24] |
|
| [25] |
|
| [26] |
|
| [27] |
|
| [28] |
|
| [29] |
|
| [30] |
|
| [31] |
|
| [32] |
|
| [33] |
|
| [34] |
|
| [35] |
|
| [36] |
|
| [37] |
|
| [38] |
|
| [39] |
|
| [40] |
|
| [41] |
|
| [42] |
|
| [43] |
|
| [44] |
|
| [45] |
|
/
| 〈 |
|
〉 |
