
Journal of Tropical Oceanography ›› 2024, Vol. 43 ›› Issue (5): 17-31.doi: 10.11978/2023141CSTR: 32234.14.2023141
• Marine Meteorology • Previous Articles Next Articles
Statistical study on the influence of typhoon with different path on the temperature of coastal waters of China
SUN Zeming1( ), HAN Shuzong1,2(), WANG Mingjie1, SU Hanxiang1
- 1. Collage of Oceanic and Atmospheric Sciences, Ocean University of China, Qingdao 266100, China
2. College of Marine Science and Technology, Hainan Tropical Ocean University, Sanya 572022, China
-
Received:2023-10-04Revised:2023-12-07Online:2024-09-10Published:2024-10-10 -
Supported by:National Key Research and Development Program(2022YFC3104000); Jiangsu Province Marine Science and Technology Innovation Project(JSZRHYKJ202304)
Cite this article
SUN Zeming, HAN Shuzong, WANG Mingjie, SU Hanxiang. Statistical study on the influence of typhoon with different path on the temperature of coastal waters of China[J].Journal of Tropical Oceanography, 2024, 43(5): 17-31.
share this article
Add to citation manager EndNote|Reference Manager|ProCite|BibTeX|RefWorks
Tab. 1
Spatiotemporal ranges of two optimal interpolated sea surface temperature data sets and corresponding sensors used"
| 传感器 | 空间范围 | 时间范围 | |
|---|---|---|---|
| MW | TMI, AMSR-E, AMSR2, WindSat, GMI | 在2002-06-01之前: 40°S—40°N 在2002-06-01之后: 全球 | 1998-01-01 至今 |
| MW_IR | MW: TMI, AMSR-E, AMSR2,WindSat, GMI IR: MODIS-Terra, MODIS-Aqua, VIIRS-NPP, VIIRS-N20 | 全球 | 2002-06-01 至今 |
Tab. 1
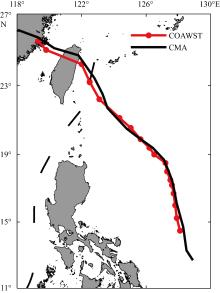
Fig. 1
The path of No. 1709 typhoon “Nesat”. The black solid line is the best track provided by the tropical cyclone data center of the CMA, and the red solid line is the simulated path of COAWST coupling mode"

Fig. 1
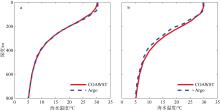
Fig. 2
Temperature profile comparison of Argo and COAWST coupling models near the typhoon path before and after the passage of No. 1709 typhoon “Nesat”. The dashed blue line in the figure (a) is the 169th profile data of No. 2902656 Argo, the solid red line is the temperature profile of COAWST simulation results, and the dashed blue line in the figure (b) is the 170th profile data of No. 2902656 Argo, the solid red line is the temperature profile of COAWST simulation results"
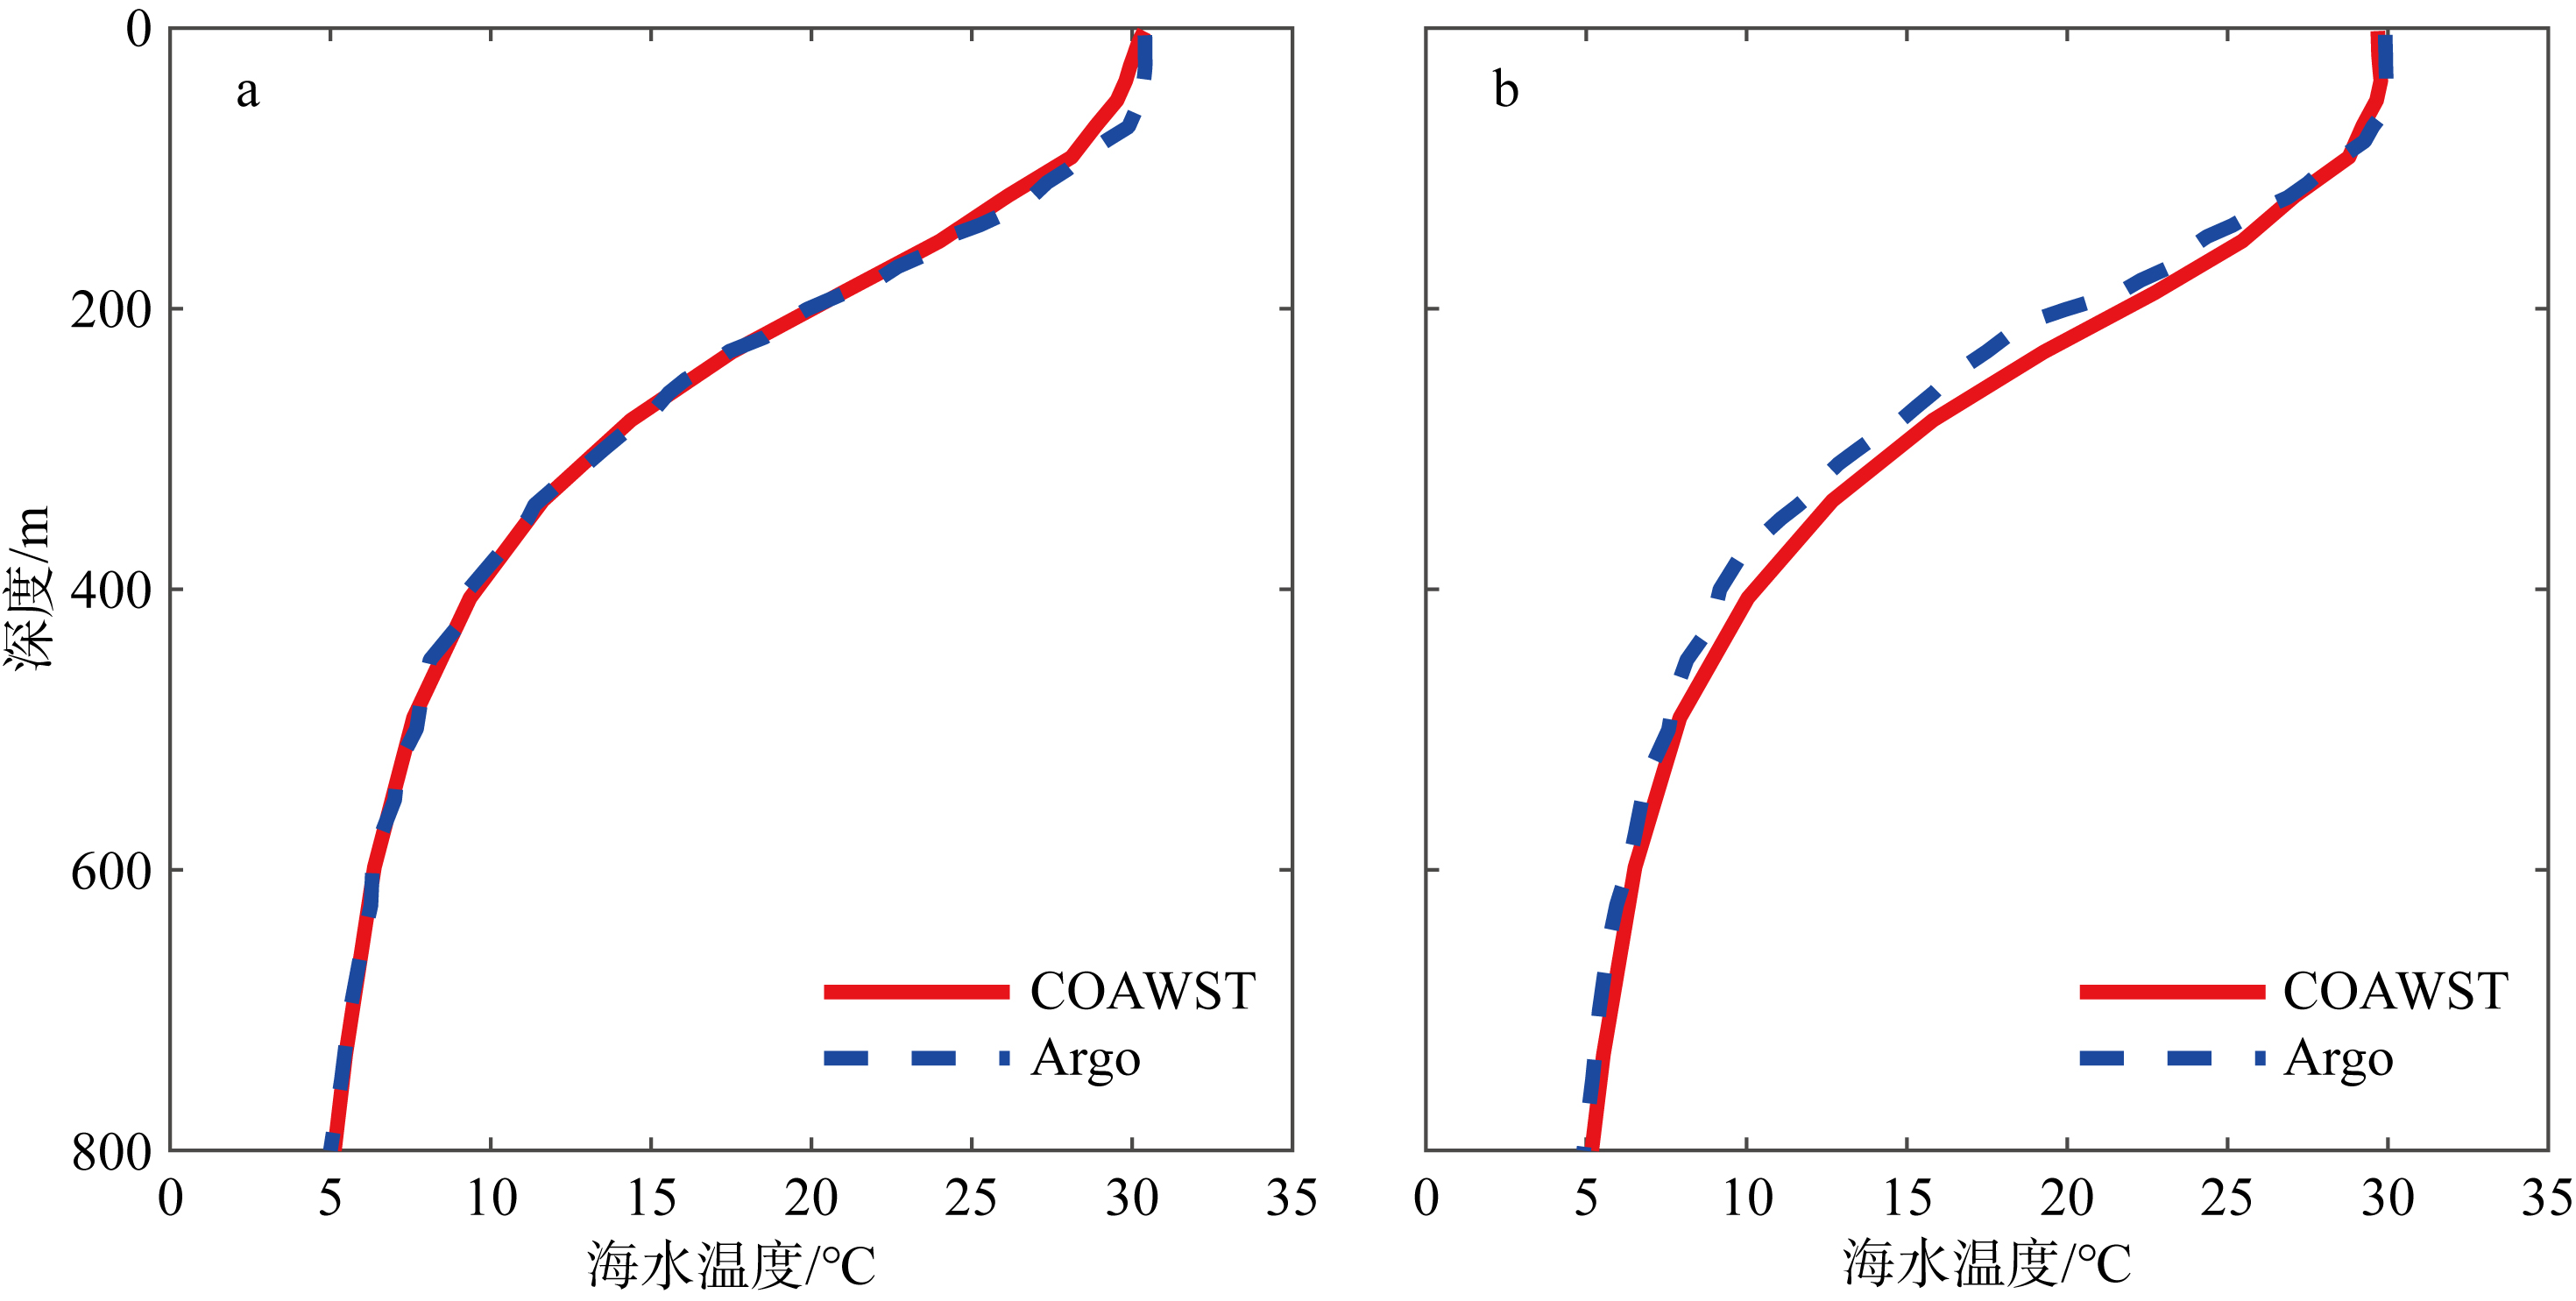
Fig. 2
Tab. 2
Number of typhoons of different categories under different classification numbers"
| 第1类台风数量/个 | 第2类台风数量/个 | 第3类台风数量/个 | 第4类台风数量/个 | 第5类台风数量/个 | 第6类台风数量/个 | |
|---|---|---|---|---|---|---|
| 分为2类 | 50 | 33 | - | - | - | - |
| 分为3类 | 31 | 25 | 27 | - | - | - |
| 分为4类 | 7 | 36 | 27 | 13 | - | - |
| 分为5类 | 31 | 25 | 20 | 2 | 5 | - |
| 分为6类 | 13 | 9 | 29 | 25 | 2 | 5 |
Tab. 2
Fig. 3
The relationship between the number of classifications and the mean value of the silhouette coefficient (a) and the number of negative silhouette coefficient (b)"
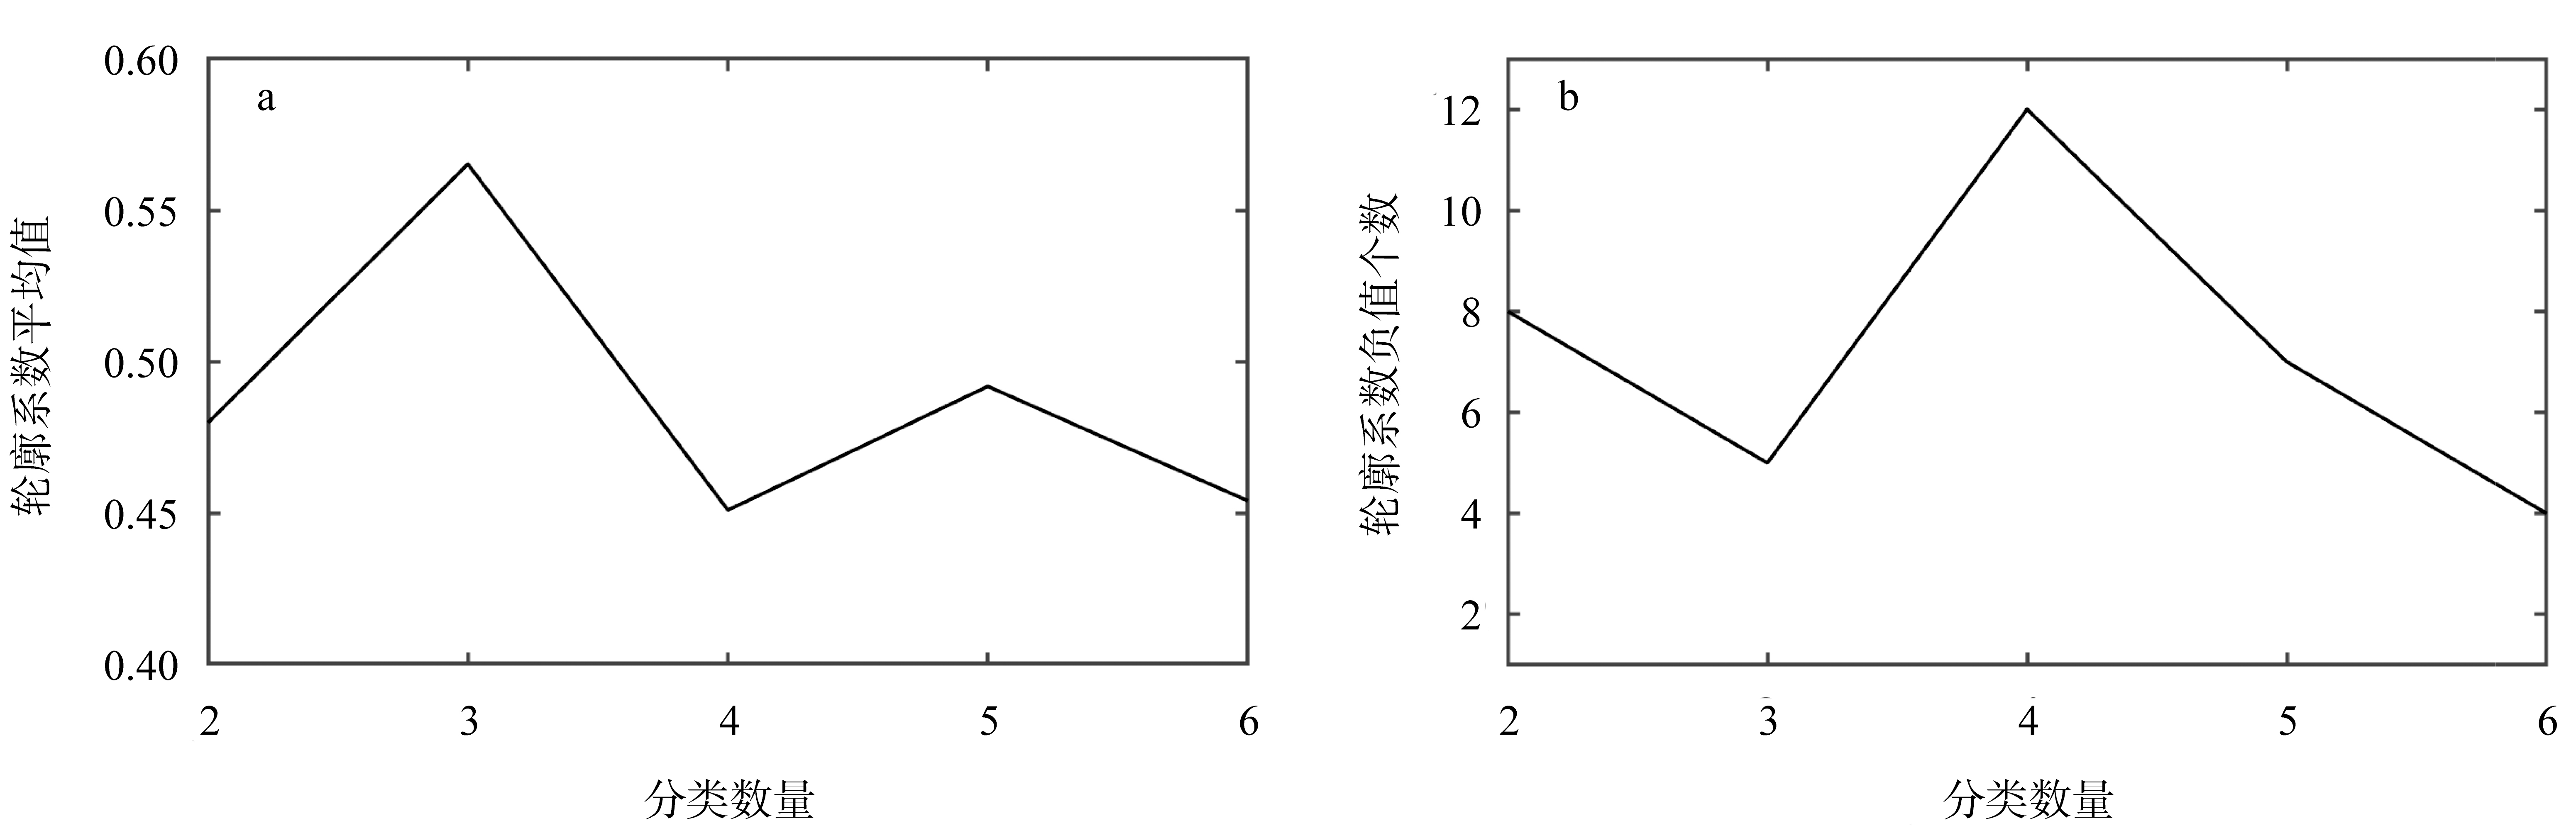
Fig. 3
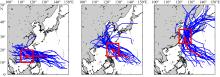
Fig. 4
Typhoon track diagram. Westward typhoon (a); Northwestward typhoon (b); turning typhoon (c). Solid gray lines are paths of the typhoon samples, the red arrow is the main moving direction of the typhoon samples, and the red box is the main research area"

Fig. 4
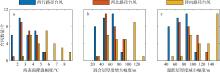
Fig. 5
Variation of upper ocean temperature induced by typhoon samples. (a) Sea surface cooling amplitude caused by typhoon samples; (b) the variation amplitude of mixed layer thickness caused by typhoon samples; (c) the variation amplitude of thermocline caused by typhoon samples"
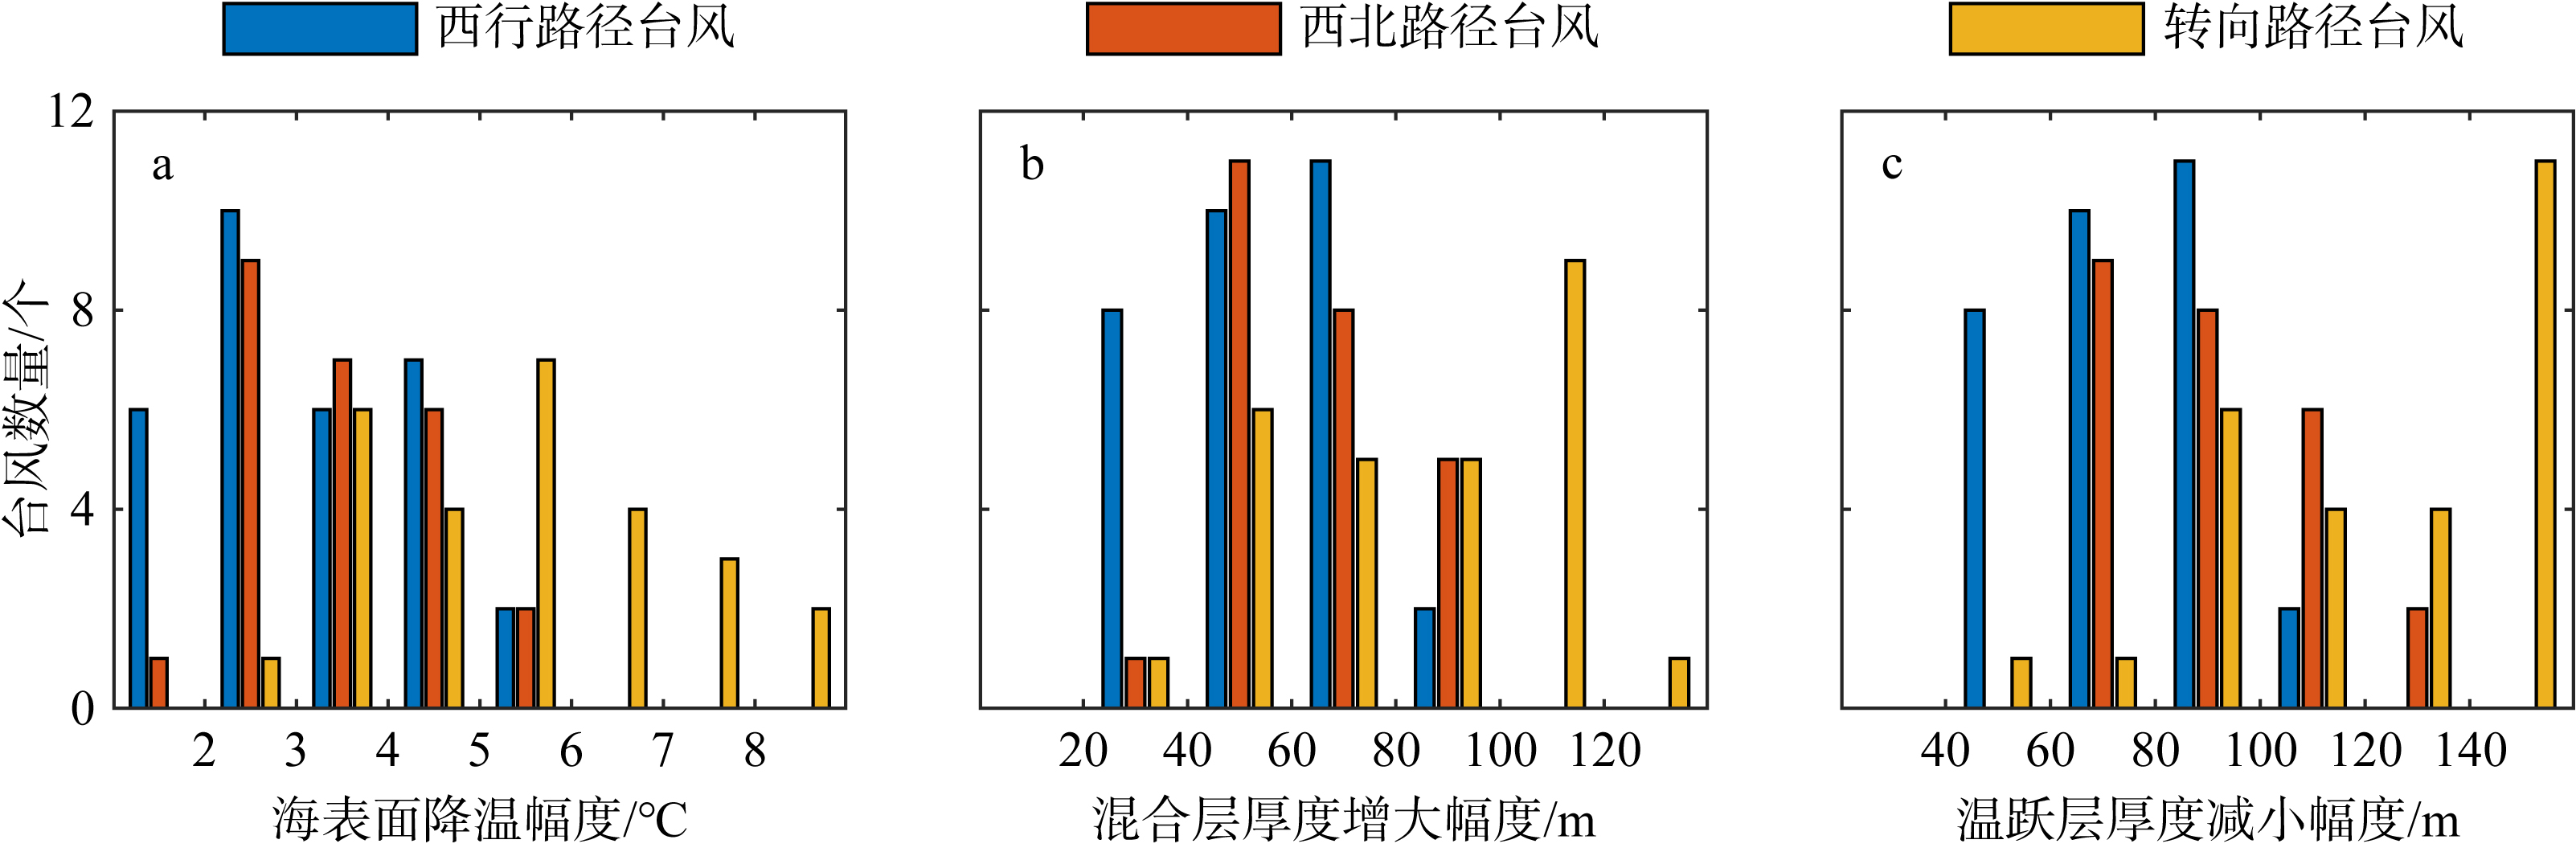
Fig. 5
Tab. 3
The result of significance test of statistics between three kinds of typhoons"
| SST冷却幅度 | MLT增大幅度 | TT减小幅度 | |
|---|---|---|---|
| 西行路径台风与西北路径台风之间各统计量的差异显著性 | 0.3226 | 0.0249 | 0.0071 |
| 西北路径台风与转向路径台风之间各统计量的差异显著性 | 0.00004250 | 0.0052 | 0.00008879 |
| 转向路径台风与西行路径台风之间各统计量的差异显著性 | 0.000002065 | 0.00001813 | 0.0000001063 |
Tab. 3
Tab. 4
Characteristic of influence of different path typhoons on SST"
| 台风数量/个 | 海表面的主要 降温区间/℃ | SST降低幅度/℃ | SST平均 降低幅度/℃ | SST 7d内 恢复占比/% | SST变化偏右 性异常占比/% | ||
|---|---|---|---|---|---|---|---|
| 最大降温幅度 | 最小降温幅度 | ||||||
| 西行台风 | 31 | 2~5 | 5.13 | 1.49 | 3.2 | 83.87 | 29.03 |
| 西北台风 | 25 | 2~5 | 5.89 | 1.79 | 3.5 | 56.00 | 8.00 |
| 转向台风 | 27 | 3~6 | 8.95 | 2.76 | 4.9 | 18.52 | 14.81 |
Tab. 4
Tab. 5
Characteristic of influence of different path typhoons on MLT"
| 台风数量/个 | MLT的主要 增加区间/m | MLT增加幅度/m | MLT平均 增大幅度/m | MLT 7d内 恢复占比/% | MLT变化偏右 性异常占比/% | ||
|---|---|---|---|---|---|---|---|
| 最大加深幅度 | 最小加深幅度 | ||||||
| 西行台风 | 31 | 30~70 | 87.10 | 28.05 | 53.78 | 58.06 | 41.94 |
| 西北台风 | 25 | 50~90 | 92.03 | 36.17 | 65.04 | 84.00 | 40.00 |
| 转向台风 | 27 | 70~100 | 133.73 | 34.64 | 84.74 | 62.96 | 37.04 |
Tab. 5
Tab. 6
Characteristic of influence of different path typhoons on TT"
| 台风数量/个 | TT的主要 减少区间/m | TT减少幅度/m | TT平均 减小幅度/m | TT 7d内 恢复占比/% | TT变化偏右 性异常占比/% | ||
|---|---|---|---|---|---|---|---|
| 最大减少幅度 | 最小减少幅度 | ||||||
| 西行台风 | 31 | 50~90 | 118.50 | 40.84 | 74.63 | 38.71 | 67.74 |
| 西北台风 | 25 | 70~120 | 127.48 | 60.57 | 90.36 | 60.00 | 64.00 |
| 转向台风 | 27 | 90~150 | 180.62 | 58.42 | 125.02 | 37.04 | 59.26 |
Tab. 6
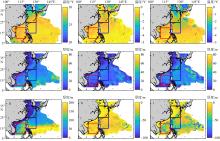
Fig. 6
Temporal and spatial characteristics of the variation amplitude of SST, MLT and TT induced by typhoon samples. (a) The average SST before the typhoon; (b) the average reduction of SST during typhoon transit; (c) the average reduction of SST within 7 days after the passage of the typhoon; (d) average MLT before the typhoon; (e) the average increase of MLT during typhoon transit; (f) the average increase in MLT within 7 days after the typhoon’s passage; (g) average TT before the typhoon; (h) the average reduction of TT during typhoon transit; (i) average reduction of TT within 7 days after the typhoon’s passage. The black box area is the main impact area of the turning typhoon. The area in blue box is the main affected area of the northwestward typhoon. The area in the red box is the main impact area of the westward typhoon. The blank area in the figure is the area not affected by the typhoon samples"

Fig. 6
Tab. 7
The characteristics of each type of typhoon in their main affect areas"
| 到达主要影响区域的时间 | 在主要影响区域内的平均强度(近中心最大风速)/(m·s-1) | 在主要影响区域内的平均移动速度/(km·h-1) | |
|---|---|---|---|
| 西行路径台风 | 7—9月(92.59%) | 45.51 | 25.05 |
| 西北路径台风 | 7—9月(92.00%) | 52.28 | 28.27 |
| 转向路径台风 | 7—9月(74.19%) | 61.37 | 37.22 |
Tab. 7

Fig. 7
The average SST (a), MLT (b) and TT (c) from July to September in the mean affect area from 2001 to 2020 (https://data.marine.copernicus.eu/product/GLOBAL_REANALYSIS_PHY_001_031/), the red, blue and black boxes in the figure show the main affect area of the westward typhoon, the northwestward typhoon and the turning typhoon respectively"
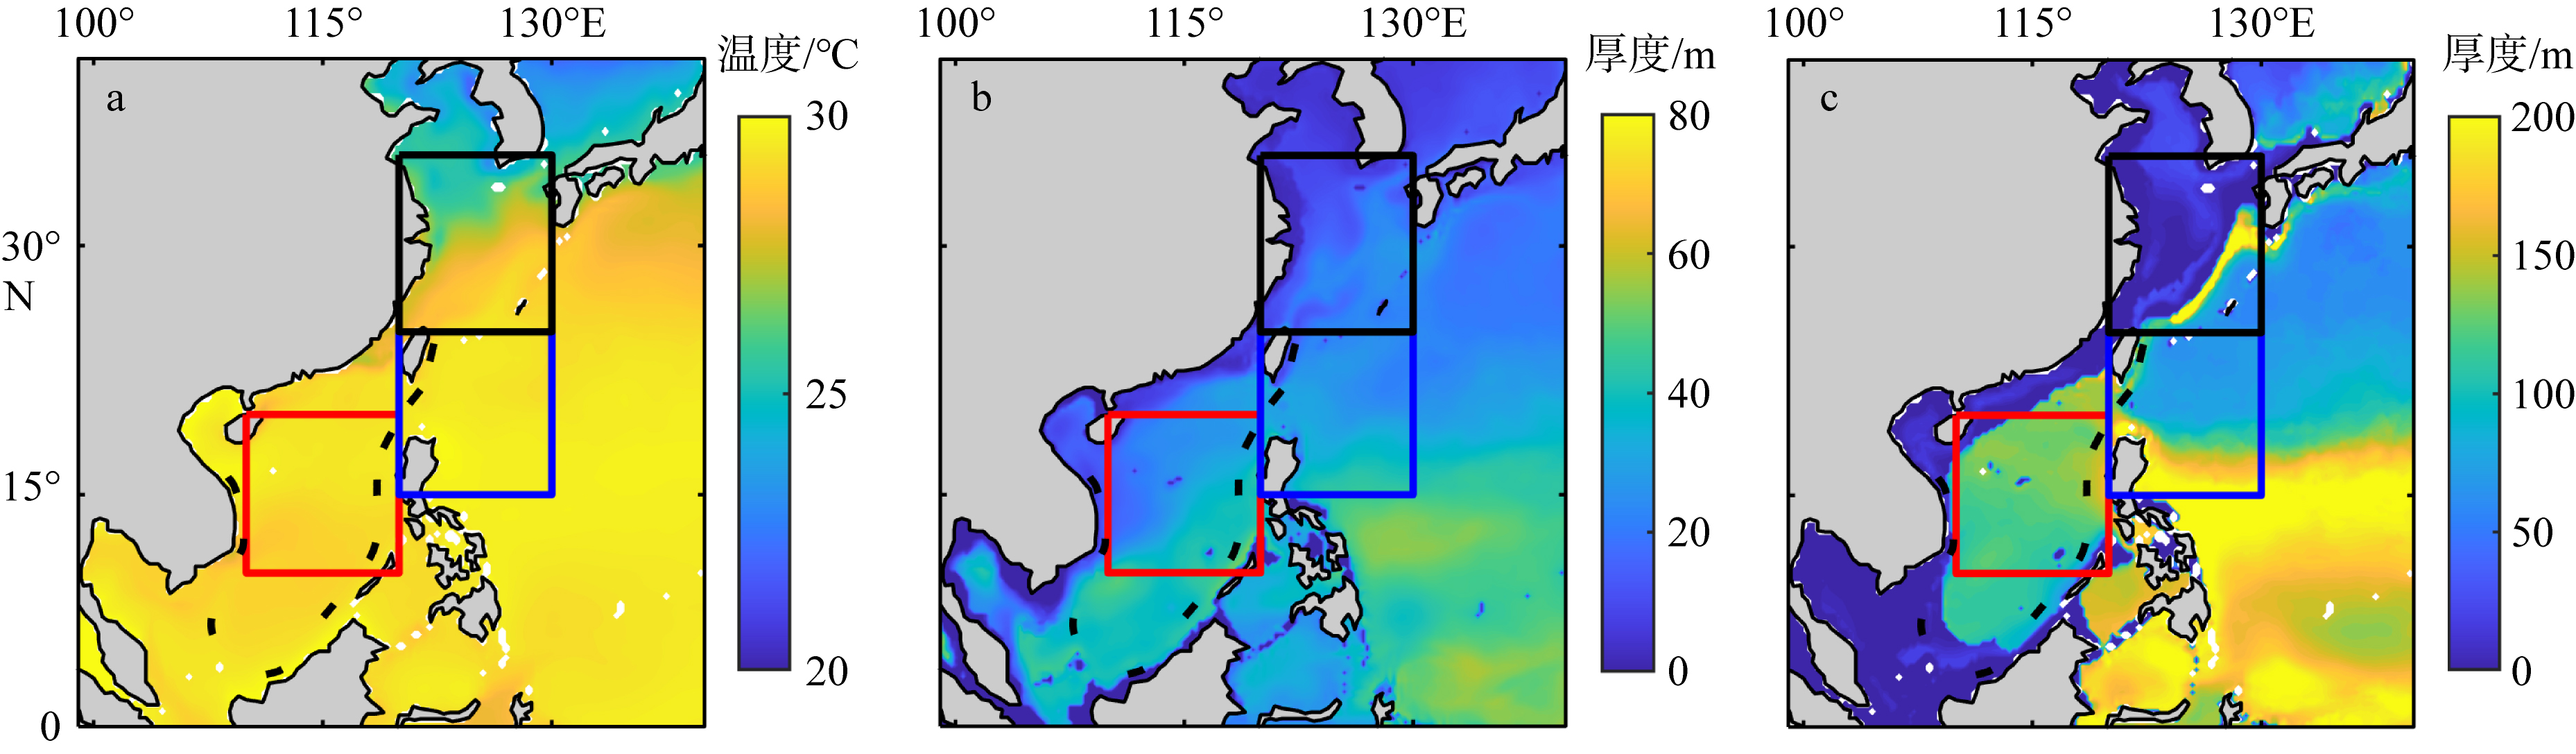
Fig. 7
Tab. 8
Background field information of the main affect areas of each type of typhoon"
| 主要影响区域内SST平均值/℃ | 主要影响区域内MLT平均值/m | 主要影响区域内TT平均值/m | ||||
|---|---|---|---|---|---|---|
| 过境前2d平均 | 7—9月平均 | 过境前2d平均 | 7—9月平均 | 过境前2d平均 | 7—9月平均 | |
| 西行路径台风 | 28.49 | 29.28 | 24.08 | 29.01 | 106.05 | 118.02 |
| 西北路径台风 | 29.21 | 29.56 | 25.74 | 27.51 | 100.27 | 114.98 |
| 转向路径台风 | 27.25 | 27.54 | 13.46 | 14.59 | 21.14 | 38.95 |
Tab. 8
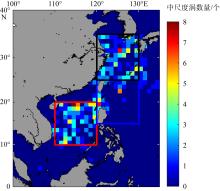
Fig. 8
The number of mesoscale cold vortices from July to September in the mean affect area from 2002 to 2021, using AVISO altimetry data (https://data.aviso.altimetry.fr/aviso-gateway/data/META3.1exp_DT/META3.1exp_DT_twosat/), the red, blue and black boxes in the figure show the main affect area of the westward typhoon, the northwestward typhoon and the turning typhoon respectively"
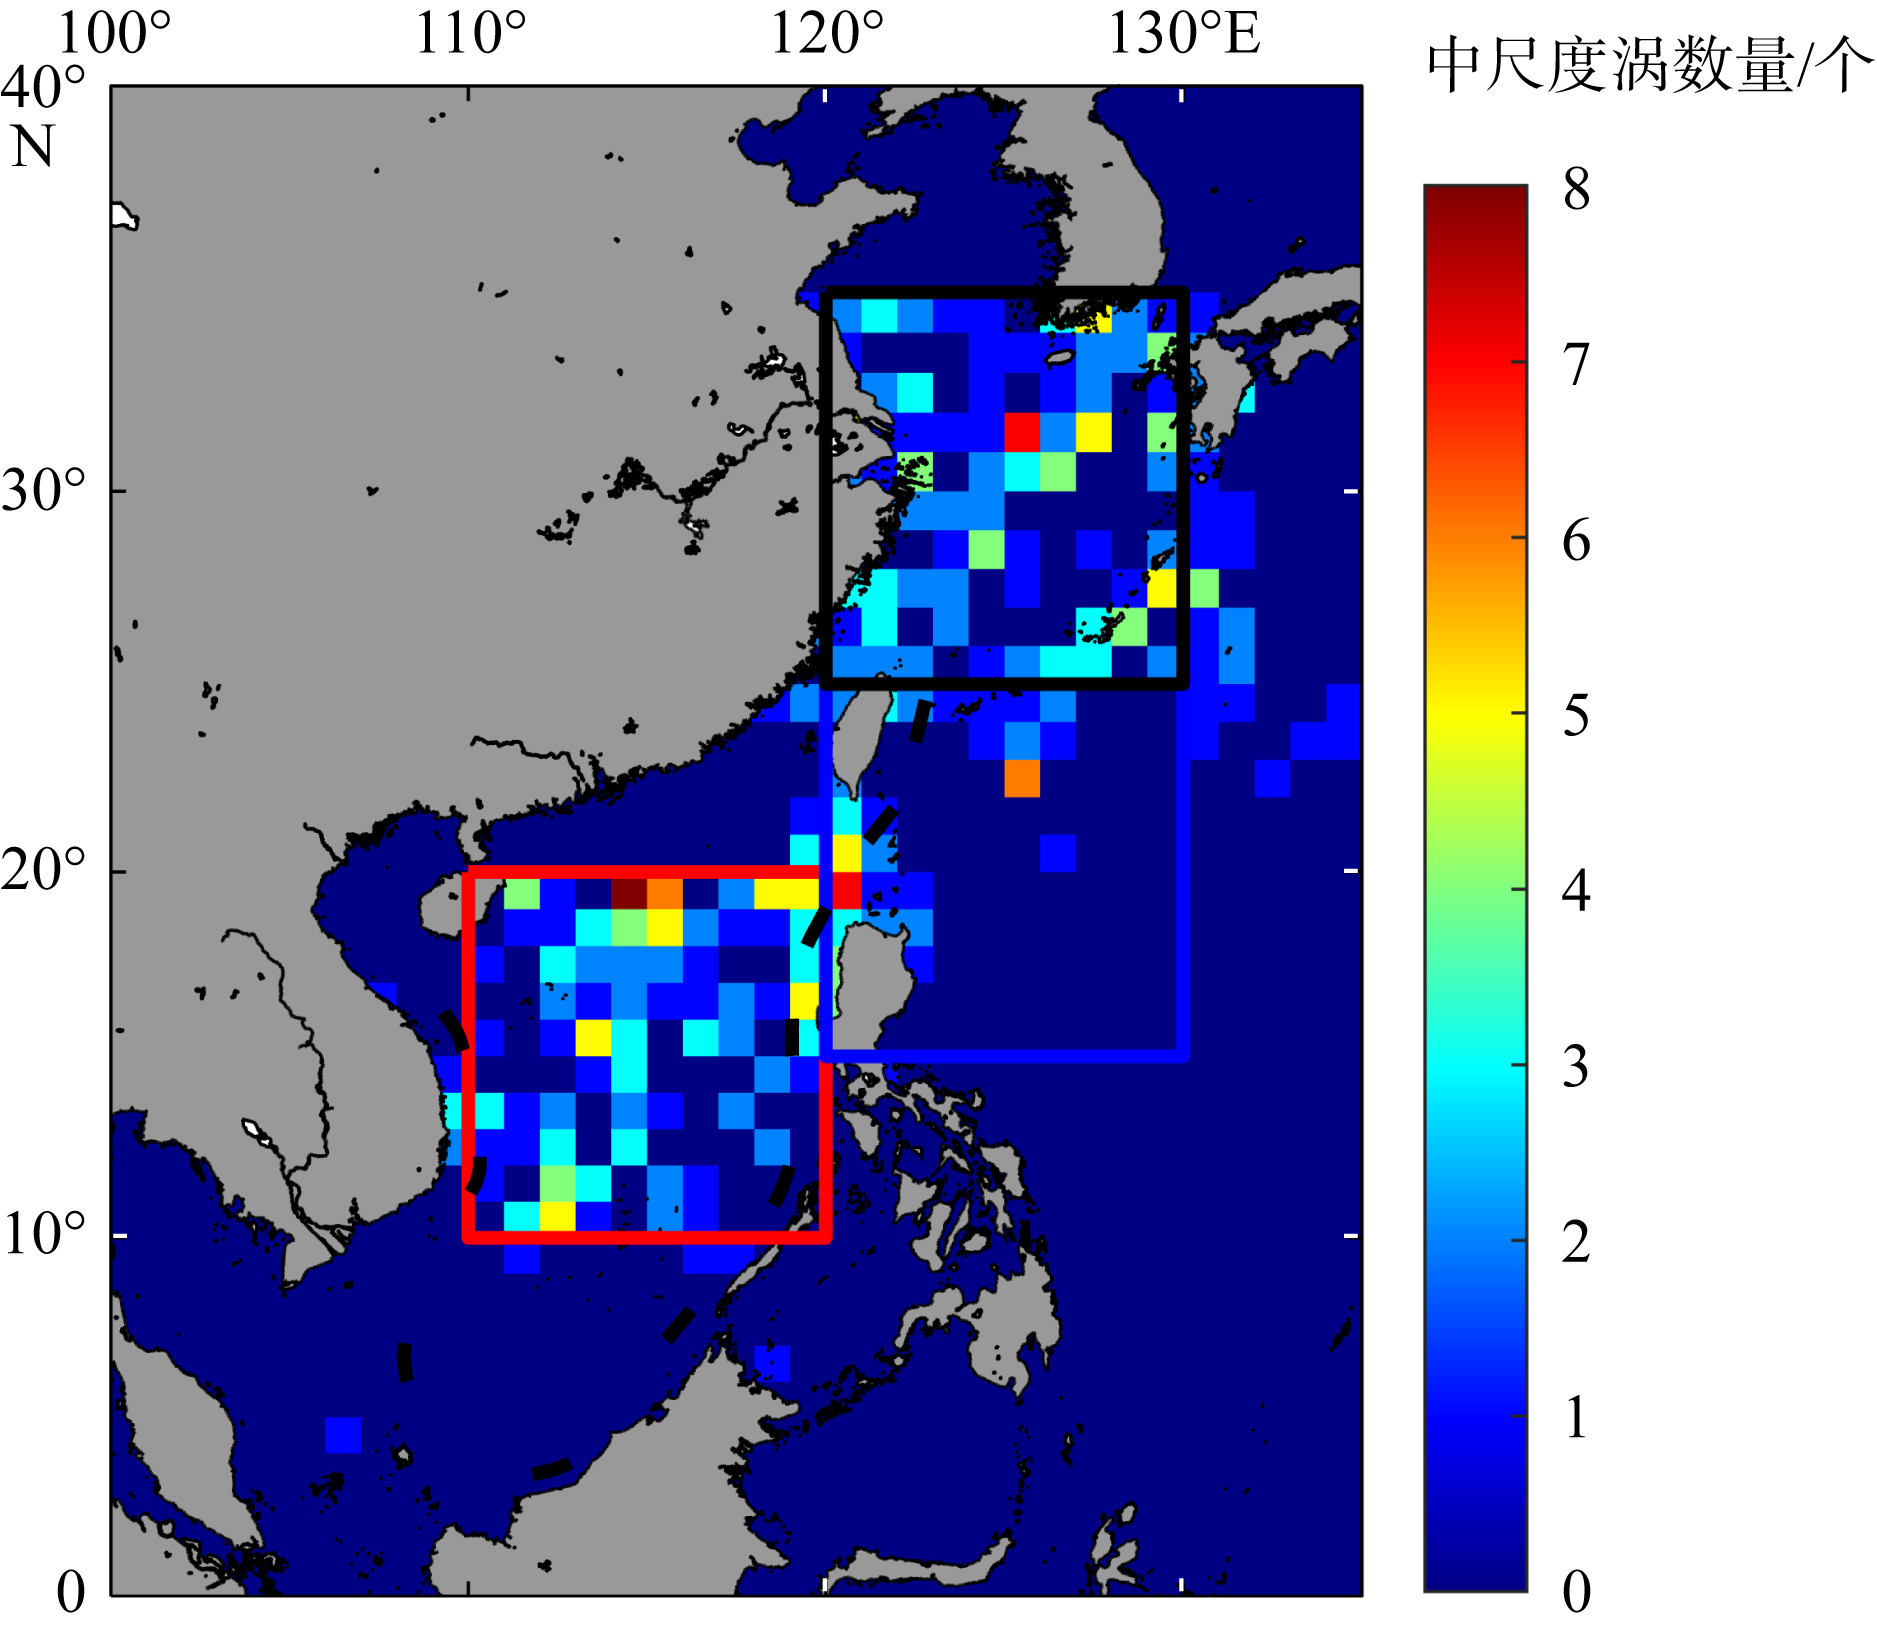
Fig. 8
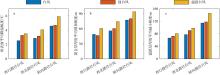
Fig. 9
The average variation amplitude of SST (a), MLT (b) and TT (c) induced by typhoons of different intensity classes in their respective main affected areas"
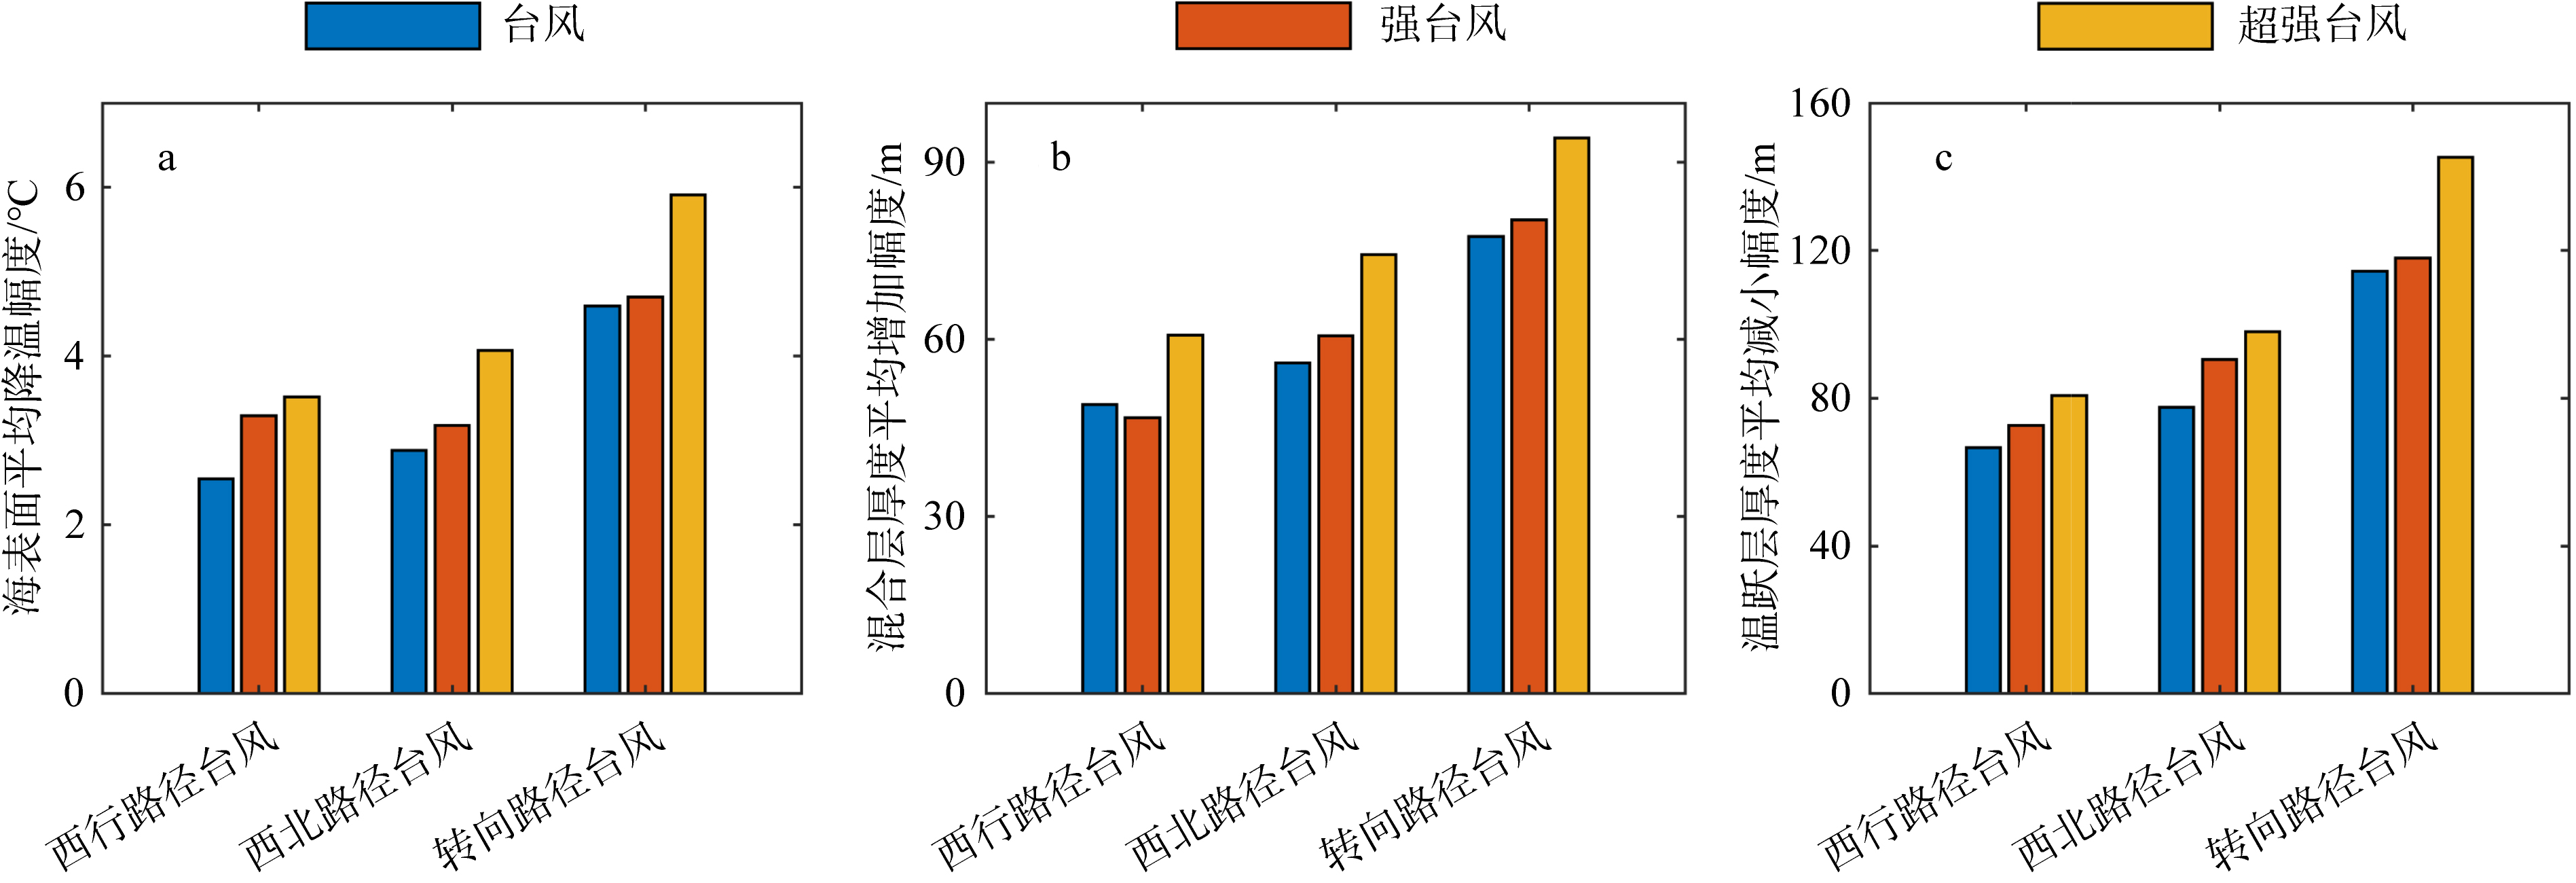
Fig. 9
Tab. 9
The average moving speed of each type typhoon and the average water depth in the main affected area"
| 台风数量/个 | 台风主要影响区域内平均水深/m | 台风在主要影响区域内平均移动速度/(km·h-1) | |
|---|---|---|---|
| 西行台风 | 31 | 2695.0 | 25.05 |
| 西北行台风 | 25 | 4350.3 | 28.27 |
| 转向台风 | 27 | 496.2 | 37.22 |
Tab. 9
Fig. 10
The major ocean currents in the coastal waters of China and the Western Pacific Ocean. The blue arrow is the cold current, the red arrow is the warm current, the solid line is the wind current, and the dashed line is the compensation current"

Fig. 10
| [1] |
顾润源, 朱官忠, 李振海, 等, 1993. 影响我国的不同路径台风的对比分析[J]. 山东气象, 13(2): 1-5, 15 (in Chinese).
|
| [2] |
韩玉康, 龚立新, 2017. 南海温跃层对台风过程响应的数值模拟研究[J]. 海洋信息, (4): 12-21 (in Chinese).
|
| [3] |
刘增宏, 许建平, 朱伯康, 等, 2006. 利用Argo资料研究2001—2004年期间西北太平洋海洋上层对热带气旋的响应[J]. 热带海洋学报, 25(1): 1-8.
|
|
|
|
| [4] |
孙凡, 于非, 司广成, 等, 2021. 台风过境对黄海冷水团及其环流结构的影响[J]. 海洋与湖沼, 52(5): 1125-1136.
|
|
|
|
| [5] |
徐文玲, 苏洁, 2007. 台风对西北太平洋海表温度的影响[J]. 中国海洋大学学报, 37(S2): 17-22.
|
|
|
|
| [6] |
杨晓霞, 唐丹玲, 2010. 台风引起南海海表面降温的位置变化特征[J]. 热带海洋学报, 29(4): 26-31.
|
|
doi: 10.11978/j.issn.1009-5470.2010.04.026 |
|
| [7] |
叶家成, 杜新观, 余锦华, 2019. 影响中国大陆热带气旋路径分类及其特征研究[J]. 气象科学, 39(3): 304-311.
|
|
|
|
| [8] |
郑颖青, 余锦华, 吴启树, 等, 2013. K-均值聚类法用于西北太平洋热带气旋路径分类[J]. 热带气象学报, 29(4): 607-615.
|
|
|
|
| [9] |
中华人民共和国国家质量监督检验检疫总局, 国家标准化管理委员会, 2006. GB/T 19201-2006 热带气旋等级[S]. 北京: 中国标准出版社.
|
|
GENERAL ADMINISTRATION OF QUALITY SUPERVISION, INSPECTION AND QUARANTINE OF THE PEOPLE’S REPUBLIC OF CHINA, NATIONAL STANDARDIZATION ADMINISTRATION, 2006. GB/T 19201-2006 Grade of tropical cyclones[S]. Beijing: Standards Press of China (in Chinese with English abstract).
|
|
| [10] |
周磊, 陈大可, 雷小途, 等, 2019. 海洋与台风相互作用研究进展[J]. 科学通报, 64(1): 60-72.
|
|
|
|
| [11] |
|
| [12] |
|
| [13] |
|
| [14] |
|
| [15] |
|
| [16] |
|
| [17] |
|
| [18] |
|
| [19] |
|
| [20] |
|
| [21] |
|
| [22] |
|
| [23] |
|
| [24] |
|
| [25] |
|
| [26] |
|
| [27] |
|
| [28] |
|
| [29] |
|
| [30] |
|
| [31] |
|
| [32] |
|
| [33] |
|
| [34] |
|
| [35] |
|
| [36] |
|
| [37] |
|
| [38] |
|
| [39] |
|
| [40] |
|
| [41] |
pmid: 10797004 |
| [42] |
|
| [43] |
|
| [44] |
|
| [45] |
|
|
||