
Journal of Tropical Oceanography >
Distribution characteristics and mechanism of the Northwest Pacific marine heatwaves in the summer of 2022*
Copy editor: SUN Cuici
Received date: 2024-02-05
Revised date: 2024-03-06
Online published: 2024-04-22
Supported by
National Natural Science Foundation of China(41905089)
Science and Technology Innovation Project of Laoshan Laboratory(LSKJ202202403)
The distribution characteristics of marine heatwaves in the northwest Pacific Ocean, from July 1 to September 30, 2022, were analyzed based on the coral reef watch (CRW) heatwaves monitoring dataset using satellite remote sensing. The typical marine heatwaves processes at single stations and formation mechanism of regional heatwaves in three regions with strong heatwaves were mainly explored. A composite analysis of atmospheric and ocean variables was used to investigate the mechanism of marine heatwaves. The results indicate that: (1) The spatial distribution of various attributes of marine heatwaves in the northwest Pacific has certain similarities except for the maximum intensity, and overall, the high values are relatively concentrated. (2) The properties of marine heatwaves in the offshore area of Jiangsu are significantly higher than those in other regions; the Kuroshio basin near Taiwan has a lower maximum intensity but longer duration of marine heatwaves; the values of various attributes of marine heatwaves in the offshore area of Guangdong are above the spatial mean of Northwest Pacific Ocean. (3) The generation of a marine heatwave in the offshore area of Jiangsu within 92 days is closely related to the combined effect of atmospheric forcing under the expansion of the Western Pacific Subtropical High and the transport process of atmospheric wind field with a large amount of sensible heat and latent heat from the Kuroshio basin. The marine heatwaves in the Kuroshio basin near Taiwan and the offshore area of Guangdong are mainly caused by the increased solar radiation under the control of the Western Pacific Subtropical High.
ZHOU Xiangrun , WANG Ying , ZHI Hai . Distribution characteristics and mechanism of the Northwest Pacific marine heatwaves in the summer of 2022*[J]. Journal of Tropical Oceanography, 2025 , 44(1) : 82 -92 . DOI: 10.11978/2024036
表1 海洋热浪特征指标定义Tab. 1 Definition of marine heatwave characteristic index |
| 指标 | 英文名称 | 定义 | 单位 |
|---|---|---|---|
| 阈值 | threshold | 气候基准期内第90百分位数的海温(记为T90) | ℃ |
| 起始时间 | start time | Td≥T90d且Td-1<T90d的这一天, 即热浪开始的日期, 记为ts | |
| 结束时间 | finish time | Td<T90d且Td-1≥T90d的这一天, 即热浪结束的日期, 记为te | |
| 总天数 | total days | 某时段热浪日的累加和即为总天数 | d |
| 爆发频次 | frequency | 从ts开始到te结束且te−ts≥5, 记为一次热浪, 某时段发生的热浪次数之和即为爆发频次 | |
| 持续时间 | duration | te−ts即为持续时间 | d |
| 最大强度 | max intensity | imax = max(Td−Tmd) | ℃ |
注: Td为日海表温度; T90d为海表温度的第90百分位数; Tmd为平均日海表温度(气候态); 数据源自Hobday 等 2016 |
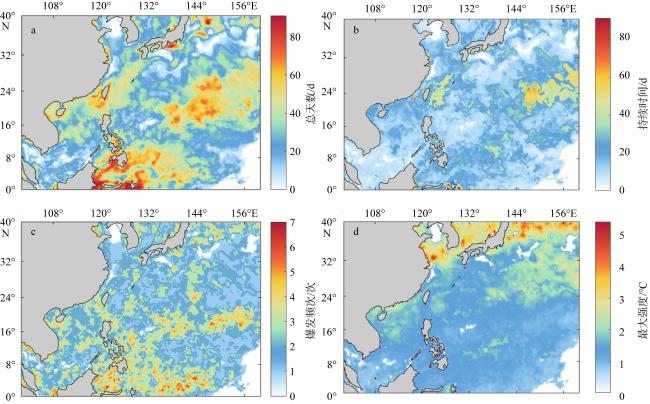
图1 2022年7月1日—9月30日西北太平洋海洋热浪(a)总天数(单位: d)、(b)平均持续时间(单位: d)、(c)爆发频次(单位: 次)和(d)平均最大强度(单位: ℃)的空间分布该图基于国家测绘地理信息局标准地图服务网站下载的审图号为GS(2016)1611号的标准地图制作, 底图无修改 Fig. 1 The spatial distribution of (a) total number of days (unit: d), (b) average duration (unit: d), (c) outbreak frequency (unit: times) and (d) average maximum intensity (unit: °C) of the Northwest Pacific marine heatwave from July 1 to September 30, 2022 |
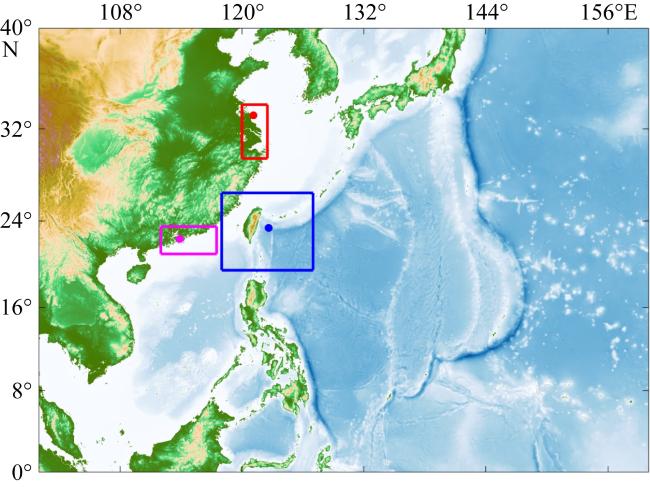
图2 研究区域及地形高程红色框为江苏外海海域, 蓝色框为台湾附近黑潮流域, 粉色框为广东近海海域, 标点处为本文研究的三个单站点; 该图基于国家测绘地理信息局标准地图服务网站下载的审图号为GS(2016)1611号的标准地图制作, 底图无修改 Fig. 2 The study area and topographic elevation; the red box represents the offshore area of Jiangsu; the blue box represents the Kuroshio basin near Taiwan; the pink box represents the offshore area of Guangdong; the dot points represent the three single stations studied in this paper |
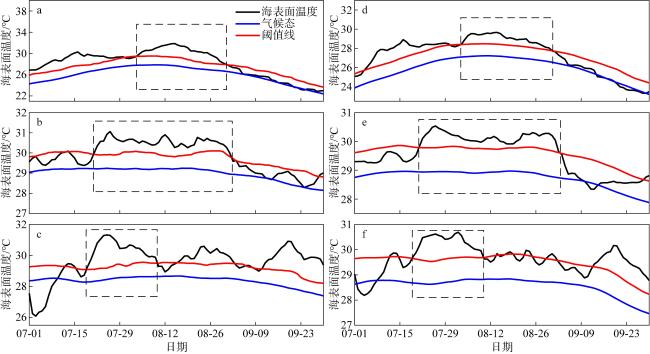
图3 2022年7月1日—9月30日发生的海洋热浪事件a. 江苏外海海域站点(图2红色标点); b.台湾附近黑潮流域站点(图2蓝色标点); c. 广东近海海域站点(图2粉色标点); d. 江苏外海海域(图2红色框); e. 台湾附近黑潮流域(图2蓝色框); f. 广东近海海域(图2粉色框); 其中虚线框部分为本文进行分析的一次海洋热浪事件 Fig. 3 From July 1 to September 30, 2022, the marine heatwaves occurred at (a) station in the offshore area of Jiangsu (Fig. 2 red dot point station); (b) station in the Kuroshio basin near Taiwan (Fig. 2 blue dot point station); (c) station in the offshore area of Guangdong ( Fig. 2 pink dot point station); (d) the offshore area of Jiangsu (Fig. 2 red box); (e) the Kuroshio basin near Taiwan (Fig. 2 blue box); (f) the offshore area of Guangdong (Fig. 2 pink box). The dotted line frame represents the marine heatwave analyzed in this paper |
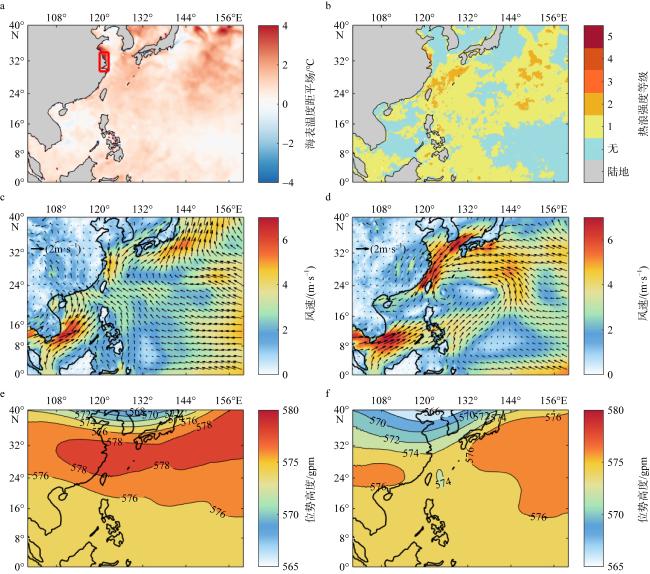
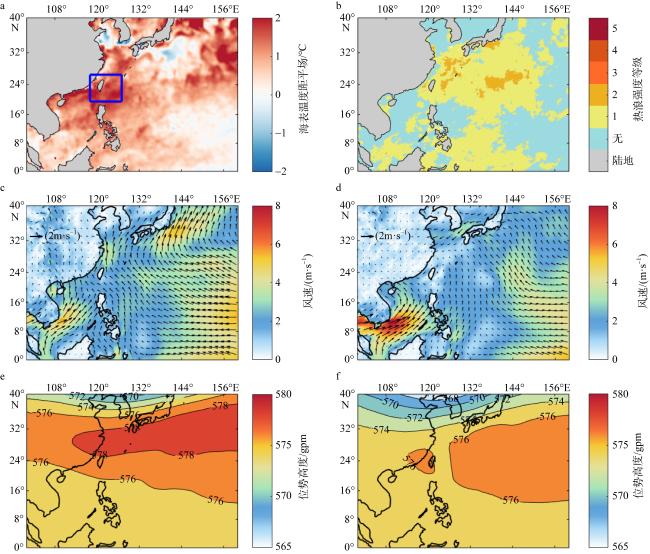
图4 江苏外海海域(红框区域)在海洋热浪峰值时间(2022年8月15日)的海表温度距平场(a)、强度等级(b), 以及在海洋热浪期间(8月4日至8月31日)的10m平均风速和风向场(c)、500 hPa平均位势高度(e), 和在非海洋热浪期间(9月1日至9月30日) 的10m平均风速、风向场(d)、500 hPa平均位势高度(f)该图基于国家测绘地理信息局标准地图服务网站下载的审图号为GS(2016)1611号的标准地图制作, 底图无修改 Fig. 4 (a) Sea surface temperature anomaly field and (b) intensity level of the peak time of the marine heatwave (August 15, 2022); (c) 10 m average wind speed and wind direction field and (e) 500 hPa average geopotential height during the marine heatwave period (August 4 to August 31); (d) 10 m average wind speed and wind direction field and (f) 500 hPa average geopotential height during the non-marine heatwave period (September 1 to September 30) in the offshore area of Jiangsu (red box area) |
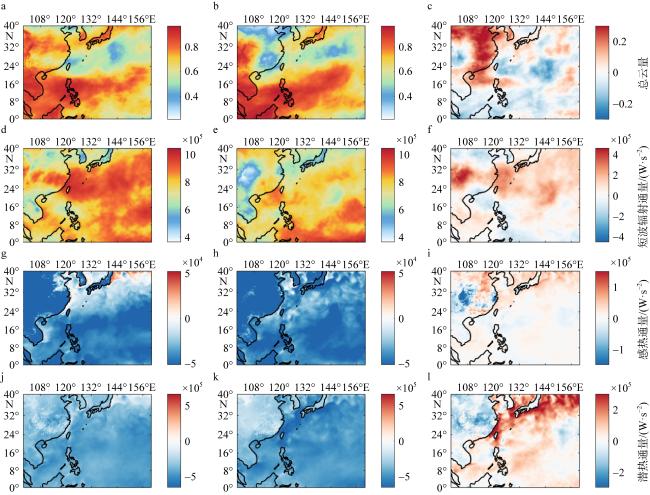
图5 江苏外海海域海洋热浪期间(8月4日—8月31日)(图左列)和非海洋热浪期间(9月1日—9月30日) (图中间列)的平均总云量、短波辐射通量、感热通量、潜热通量, 垂直通量约定向下为正, 以及热浪与非热浪期间的四项气象数据差值(图右列)该图基于国家测绘地理信息局标准地图服务网站下载的审图号为GS(2016)1611号的标准地图制作, 底图无修改 Fig. 5 The average total cloud cover, shortwave radiation flux, sensible heat flux and latent heat flux during marine heatwave period (left column) (August 4 to August 31) and non-marine heatwave period (middle column) (September 1 to September 30), and the difference of four meteorological data between two periods (right column ) in the offshore area of Jiangsu. Vertical fluxes are all positive |
图6 台湾附近黑潮流域(蓝框区域)热浪峰值时间(2022年7月26日)的(a)海表温度距平场、(b)强度等级, 海洋热浪期间(7月21日—9月1日)的(c)10 m平均风速和风向场、(e)500hPa平均位势高度, 以及非海洋热浪期间(7月1日—7月20日、9月2日—9月30日)的(d)10m平均风速和风向场、(f)500hPa平均位势高度该图基于国家测绘地理信息局标准地图服务网站下载的审图号为GS(2016)1611号的标准地图制作, 底图无修改 Fig. 6 (a) Sea surface temperature anomaly field and (b) intensity level of the peak time of the marine heatwave (July 26, 2022); (c) 10 m average wind speed and wind direction field and (e) 500 hPa average geopotential height during the marine heatwave period (July 21 to September 1); (d) 10 m average wind speed and wind direction field and (f) 500 hPa average geopotential height during the non-marine heatwave period (July 1 to July 20, September 2 to September 30) in the Kuroshio basin near Taiwan (blue box area) |
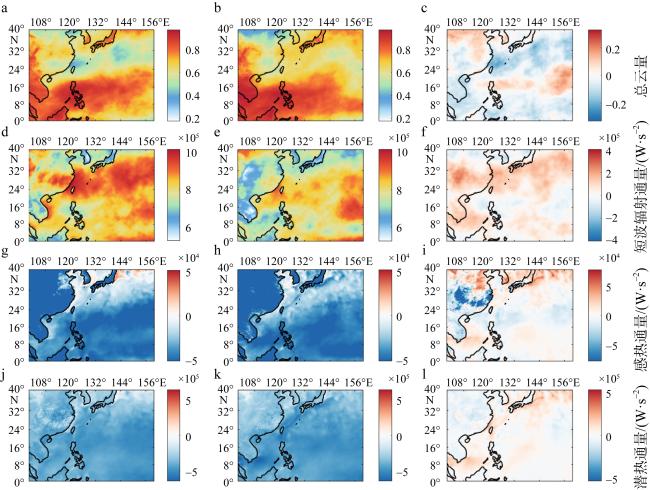
图7 台湾附近黑潮流域海洋热浪期间(7月21日—9月1日) (图左列)和非海洋热浪期间(7月1日—7月20日、9月3日—9月30日) (图中间列)的平均总云量、短波辐射通量、感热通量、潜热通量, 垂直通量约定向下为正, 以及热浪与非热浪期间的四项气象数据差值(图右列)该图基于国家测绘地理信息局标准地图服务网站下载的审图号为GS(2016)1611号的标准地图制作, 底图无修改 Fig. 7 The average total cloud cover, shortwave radiation flux, sensible heat flux and latent heat flux during marine heatwave period (left column) (July 21 to September 1) and non-marine heatwave period (middle column) (July 1 to July 20, September 2 to September 30), respectively; the difference of four meteorological data between two periods (right column) in the Kuroshio basin near Taiwan. Vertical fluxes are all positive |
图8 广东近海海域(粉框区域)海洋热浪峰值时间(2022年7月25日)的(a)海表温度距平场、(b)强度等级, 海洋热浪期间(7月19日—8月9日)的(c)10m平均风速和风向场、(e)500hPa平均位势高度, 以及非海洋热浪期间(7月1日—7月18日)的(d)10m平均风速和风向场、(f)500hPa平均位势高度该图基于国家测绘地理信息局标准地图服务网站下载的审图号为GS(2016)1611号的标准地图制作, 底图无修改 Fig. 8 (a) Sea surface temperature anomaly field and (b) intensity level of the peak time of the marine heatwave (July 25, 2022); (c) 10 m average wind speed and wind direction field and (e) 500 hPa average geopotential height during the marine heatwave period (July 19 to August 9); (d) 10 m average wind speed and wind direction field and (f) 500 hPa average geopotential height during the non-marine heatwave period (July 1 to July 18) in the offshore area of Guangdong (pink box area) |
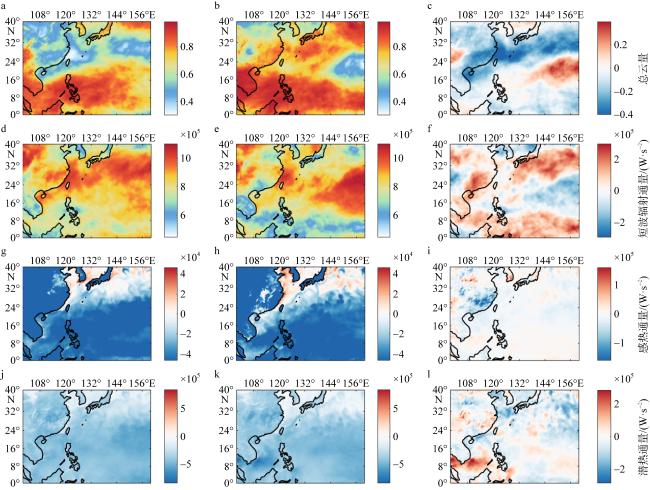
图9 广东近海海域海洋热浪期间(7月19日—8月9日) (图左列)和(图中间列)非海洋热浪期间(7月1日—7月18日)的平均总云量、短波辐射通量、 感热通量、潜热通量, 垂直通量约定向下为正, 以及(图右列)热浪与非热浪期间的四项气象数据差值该图基于国家测绘地理信息局标准地图服务网站下载的审图号为GS(2016)1611号的标准地图制作, 底图无修改 Fig. 9 The average total cloud cover, shortwave radiation flux, sensible heat flux and latent heat flux during marine heatwave period (left column) (July 19 to August 9) and non-marine heatwave period (middle column) (July 1 to July 18), and the difference of four meteorological data between two periods (right column) in the offshore area of Guangdong. Vertical fluxes are all positive |
| [1] |
高川, 陈茂楠, 周路, 等, 2022. 2020-2021年热带太平洋持续性双拉尼娜事件的演变[J]. 中国科学: 地球科学, 52(12): 2353-2372.
|
| [2] |
胡石建, 李诗翰, 2022. 海洋热浪研究进展与展望[J]. 地球科学进展, 37(1): 51-64.
|
| [3] |
李泓, 李丽平, 王盘兴, 2001. 太平洋地区海气系统年代际变率研究的若干进展[J]. 南京气象学院学报, 24(4): 591-598.
|
| [4] |
缪予晴, 徐海明, 刘佳伟, 2021. 西北太平洋夏季海洋热浪的变化特征及海气关系[J]. 热带海洋学报, 40(1): 31-43.
|
| [5] |
王庆元, 李清泉, 李琰, 等, 2021. 1982—2019年渤、黄海海洋热浪时空变化特征分析[J]. 海洋学报, 43(12): 38-49.
|
| [6] |
王越奇, 宋金明, 袁华茂, 等, 2019. 近千年来台湾以东黑潮主流区沉积物来源及其对气候波动的响应[J]. 海洋科学进展, 37(2): 231-244.
|
| [7] |
张荣华, 高川, 王宏娜, 等, 2021. 中间型海洋-大气耦合模式及其ENSO模拟和预测[M]. 北京: 科学出版社 (in Chinese).
|
| [8] |
张荣华, 2024. 用于厄尔尼诺-南方涛动(ENSO)研究的海气耦合模式综述: 中间型和混合型模式[J]. 海洋与湖沼, 55(1): 1-23.
|
| [9] |
|
| [10] |
|
| [11] |
|
| [12] |
|
| [13] |
|
| [14] |
|
| [15] |
|
| [16] |
|
| [17] |
|
| [18] |
|
| [19] |
|
| [20] |
|
| [21] |
|
/
| 〈 |
|
〉 |

