Marine Ecology

Phytoplankton community structure and its relationship with environmental factors in the spring coastal region of Nan’ao based on morphology and high-throughput sequencing

  • ZHOU Zhixi , 1 ,
  • TANG Huijuan , 1 ,
  • KE Zhixin 2, 3 ,
  • LIU Jiaxing 2 ,
  • ZHOU Weihua 2
Expand
  • 1. South China Agricultural University, Guangzhou 510640, China
  • 2. Key Laboratory of Tropical Marine Bio-resources and Ecology, Chinese Academy of Sciences, Guangzhou 510301, China
  • 3. Comprehensive Observatory of Marine Ecosystems in the Upwelling Regions of Eastern Guangdong, Shantou 515041, China
TANG Huijuan. email:

Copy editor: SUN Cuici

Received date: 2024-02-28

  Revised date: 2024-03-25

  Online published: 2024-05-17

Supported by

Special Fund for Science and Technology Planning Project of Guangdong Province of China(2021B1212050023)

Guangdong Basic and Applied Basic Research Foundation(2022A1515010656)

Guangzhou Municipal Key Science and Technology Project(2023B03J1328)

Abstract

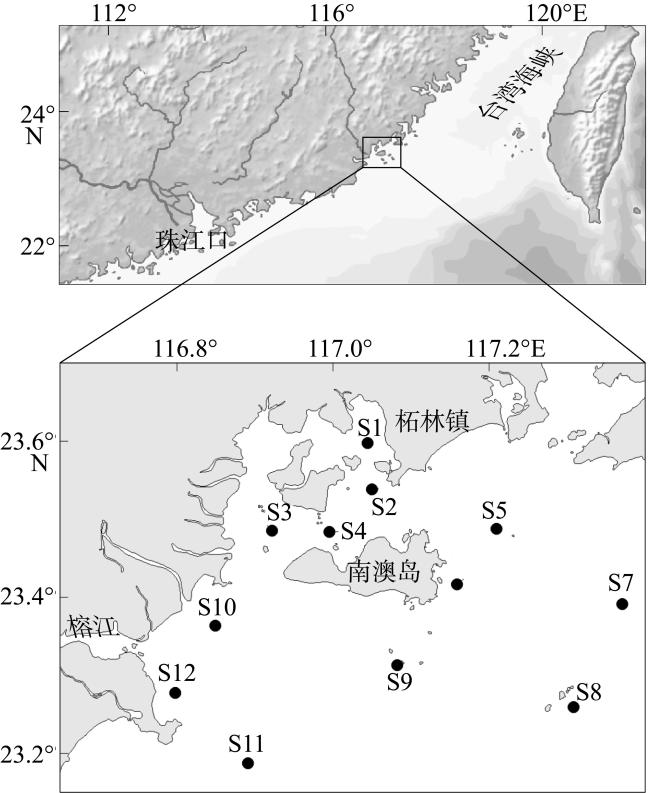
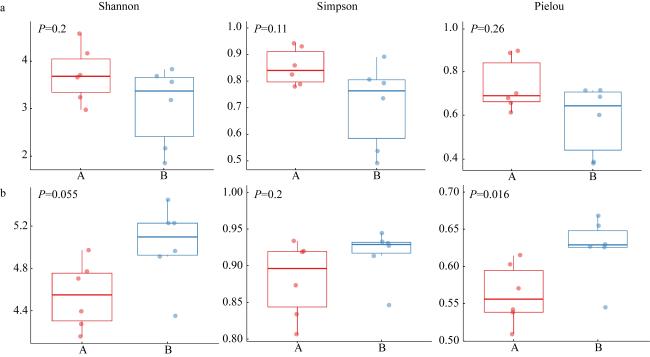
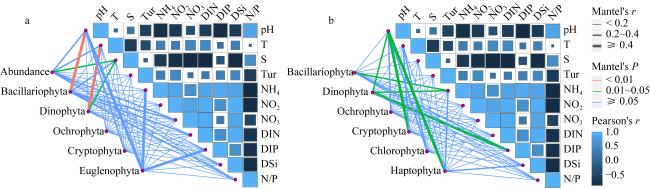
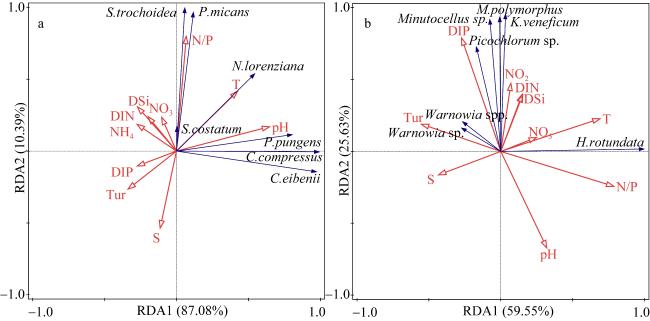
The structure of phytoplankton community was investigated based on morphological identification and high-throughput sequencing in the Nan’ao waters in May 2022. The spatial distribution of phytoplankton in relation to environmental factors was explored and results from two different methods were also compared and discussed. According to the cluster analysis of environmental factors, the survey area can be divided into nearshore area and offshore area. Totally, 105 species belong to 52 genera, 39 families, 27 orders, 8 orders, 5 phyla were morphological identified, while 543 species in 6 phyla, 32 orders, 97 families, 155 families, 272 genera through high-throughput sequencing were identified. Bacillariophyta and Dinophyta were the main groups, composing 74.54% and 24.78% through microscopic identification, and 17.52% and 67.84% through high-throughput sequencing, respectively. The abundance of phytoplankton identified by morphology ranged from 0.11×10⁵ to 6.85×10⁵ cells·L-1, which was significantly correlated with the distribution of chlorophyll a concentration, and the phytoplankton diversity index was lower than that of the high-throughput sequencing method. 7 dominant species were obtained by both methods, of which the absolutely dominant specie in the morphological identification results was Chaetoceros compressus, and the absolute dominant specie in the high-throughput sequencing identification results was Heterocapsa rotundata. Correlation analysis showed that the main environmental factor affecting phytoplankton community structure in Nan’ao in spring was pH, salinity and DIP (dissolved inorganic phosphorus). Using the combination of morphological identification and high-throughput sequencing technology, the structure and diversity of the phytoplankton community can be described more comprehensively and accurately.

Cite this article

ZHOU Zhixi , TANG Huijuan , KE Zhixin , LIU Jiaxing , ZHOU Weihua . Phytoplankton community structure and its relationship with environmental factors in the spring coastal region of Nan’ao based on morphology and high-throughput sequencing[J]. Journal of Tropical Oceanography, 2025 , 44(1) : 53 -65 . DOI: 10.11978/2024046

海洋中浮游植物作为初级生产者, 决定着生态系统的生物多样性, 为维持海洋生态系统的物质循环和能量传递提供了重要保障(Irigoien et al, 2004)。浮游植物分布范围广、生活周期短、对环境变化敏感(唐涛 等, 2002), 其群落结构组成和分布格局主要受环境因子调控, 可反映水质的状况变化, 是评价环境健康的重要指示生物之一(谭香 等, 2011)。虽然许多浮游植物的生长对生态系统健康是有益的, 然而其过量生长(如水华和赤潮)已成为世界范围内的一个主要环境问题。Hallegraeff 等(2021)发现, 赤潮事件的数量与水产养殖规模的扩大之间存在显著联系。众多研究显示赤潮的发生频率和分布范围将随着未来气候变化及人类活动影响而增加(Schläpfer et al, 1999; Barton et al, 2016; Gobler, 2020)。开展浮游植物调查工作对了解海域生态系统稳定性, 监测和防控赤潮藻种的暴发具有重要意义(Reynolds et al, 2002; 孙军 等, 2004)。
南澳岛位于广东省东部沿海, 总面积约为114.74km2, 是广东省唯一的海岛县级旅游城市, 也是中国重要的海洋牧场示范区之一, 养殖方式包括网箱养鱼、贝类底播和海藻养殖等(彭璇 等, 2014)。南澳海域位于南海北部, 是中国乃至世界海洋物种多样性最丰富的地区之一(Ma et al, 2008), 它受到韩江、榕江、莲阳河、黄冈河等径流以及台湾暖流、浙闽沿岸流、南海暖流等大洋环流共同影响(苏纪兰 等, 1990), 地理位置特殊, 生态环境比较脆弱(马华栋 等, 2021)。近几十年在人类活动的影响下, 本海域富营养化状态呈现出越来越严重的趋势(朱小山 等, 2005; 蔡德华 等, 2020; 黎素菊 等, 2022), 且出现过严重的赤潮现象, 多发种为球形棕囊藻(Phaeocystis globosa)(黄长江 等, 1999; 陈炜婷 等, 2023)。赤潮的爆发原因一般是解除了某种营养盐对浮游植物生长的限制作用, 这些营养盐的来源包括河流径流输入、沉积物的释放、上升流及沿岸流和海水养殖等(暨卫东 等, 1990; Lv et al, 2011; Xu et al, 2015)。研究显示, 在南澳周边海域浮游植物生长一般受到磷营养盐的限制(周凯 等, 2002; 陈丹婷 等, 2020; Yu et al, 2022)。
浮游植物群落结构常用于评价生态系统的健康程度。根据以往南澳岛附近海域基于形态学鉴定的调查, 浮游植物物种数量可达322种, 其中硅藻是主要类群(杜虹 等, 2011)。高通量测序技术相比传统方法更加便捷, 并且在低分类单元上有更强的分辨能力, 被广泛认为可以作为形态学检测结果的良好补充(Gilbert et al, 2008; Vandeputte et al, 2017)。鉴于部分浮游植物是微小的单细胞生物, 显微镜观察时难免会忽略 (Field et al, 1998; Esenkulova et al, 2020), 本次研究使用形态学鉴定方法结合高通量测序技术, 对南澳海域浮游植物群落结构及多样性进行分析, 并结合环境因子阐释浮游植物群落时空变化的驱动因素, 可为该海域环境保护和管理提供基础数据。

1 材料与方法

1.1 调查区域

本研究于2022年5月(春季)在汕头南澳海域进行样品采集, 共设置12个站位(图1), 其中S1站位于柘林湾网箱养鱼集中区, S2、S4站附近分布有密集的牡蛎和大型海藻的养殖, S9站周边是海上风电建设区。
图1 南澳海域地图及调查站位分布

该图基于国家测绘地理信息局标准地图服务网站下载的审图号为GS(2016)1609号的标准地图制作, 底图无修改

Fig.1 Map of the Nan’ao coastal region and location of sampling stations

1.2 样品采集和处理

使用水质多参数仪(YSI-6600, 美国)现场记录各站位的水温(T)、盐度(S)、pH和浊度(turbidity, Tur); 表层水样采用有机玻璃采水器从水表以下50cm处采集。取表层海水1L装入样品瓶, 立即加入1%体积的鲁哥试剂固定, 再将样品自然沉降24h后浓缩至50mL, 用于浮游植物形态学鉴定与计数。取1mL浓缩后的样品, 放入Sedgwick计数框内在显微镜下以200倍或400倍下进行形态鉴定和计数, 浮游植物形态学分类方法参照郭玉洁(2003)和林更铭 等(2021)专业书籍。将0.5~2L水样通过0.2μm滤膜过滤, 滤膜在液氮中快速冷冻, 然后保存于-20℃的冰箱, 以用于浮游植物的高通量测序分析(Jiang et al, 2015)。
采取水样0.25~1L, 用孔径为0.7µm的玻璃纤维滤膜(GF/F)过滤。过滤后的滤膜用中性滤纸吸干水分后再用锡箔纸包裹, 将滤膜放入-20℃冰箱保存用于叶绿素a浓度测定, 测定方法为萃取荧光法。过滤后的滤液放入-20℃冰箱保存用于营养盐分析, 溶解态无机营养盐[硝酸盐NO- 3 -N、亚硝酸盐NO- 2-N、氨氮NH+ 4-N、溶解态无机磷酸盐 (dissolved inorganic phosphorus, DIP)、溶解态无机硅酸盐 (dissolved inorganic silicon, DSi)]使用AA3连续流动分析仪(Seal Analytical, 德国)测定; 溶解态无机氮盐(dissolved inorganic nitrogen, DIN)为NO- 3 -N、NO- 2-N和NH+ 4-N的总和。以上操作参照《海洋调查规范 第6部分:海洋生物调查》(GB/T12763.6-2007) (中华人民共和国国家质量监督检验检疫总局 等, 2007)和《近岸海域环境监测规范》(HJ 442.3-2020)(中华人民共和国生态环境部, 2020)执行。

1.3 浮游植物高通量测序

参考刘卫东 等(2017), 采用CTAB法提取样品的宏基因组。对于真核浮游植物18S rDNA, 使用通用V4区引物V4-F(5ʹ-CCAGCASCYGCGGTAATTCC-3ʹ)和V4-R(5ʹ-ACTTTCGTTCTTGATYRATGA-3ʹ)进行扩增。PCR扩增采用TransStart Fastpfu DNA Polymerse (TransGen AP221-02), 反应体系为50μL, 扩增反应在ABI Gene Amp 9700型PCR仪上进行, 反应条件为: 94℃预变形3min; 94℃变形30s, 46℃下退火复性30s, 72℃延伸45s, 共30个循环; 最后于72℃下再延伸5min。每个样本按照上述步骤进行3个重复, 将同一样本的PCR产物混合后用2%琼脂糖凝胶电泳监测, 使用AxyPrepDNA凝胶回收试剂盒(AXYGEN公司)切胶回收PCR产物, 2%琼脂糖电泳检测。将检测合格的产物交给上海凌恩生物公司测序, 利用Illumina PE250平台进行文库构建, 使用Hiseq2500 PE250进行测序。

1.4 数据分析

使用mothur(version 1.30.1)软件对浮游植物物种多样性指数进行分析, 多样性指数有: Shannon-Wiener指数( H ')、Simpson指数(D)、Pielou指数( J ')。采用优势度指数(Y)描述浮游植物群落优势种, 以Y≥0.02确定为优势种。高通量测序结果计算时以质控后的物种序列数对应其丰度。计算公式分别为:
${{H}^{'}}=-\sum\nolimits_{i}^{S}{{{P}_{i}}}\text{lo}{{\text{g}}_{2}}{{P}_{i}}$
$D=1-\sum\nolimits_{i=1}^{s}{P_{i}^{2}}$
${{J}^{'}}=\frac{{{H}^{'}}}{{{\log }_{2}}S}$
$Y=\frac{{{n}_{i}}}{N}\times {{f}_{i}}$
式中: Pi为第i种的丰度与总丰度的比值; N为浮游植物总丰度; S为浮游植物种类数; ni为第i种的丰度; fi为该种在各站中出现的频率。
环境因子分布情况使用Ocean Data View (version 5.6.7)绘制。使用R(version 4.2.1)进行相关性分析与Mantel检验并绘图, 确定环境因素与优势浮游植物分布的结构效应。使用SPSS 25对浮游植物丰度、种类、多样性指数与环境因子进行Pearson相关性分析。 采用CONOCO 5对优势种与环境因子进行冗余分析(redundancy analysis, RDA)。

2 结果

2.1 环境因子

春季南澳海域水体表层温度(T)、盐度(S)、pH、浊度(Tur)平均值分别为23.38℃、29.70‰、8.09、3.05NTU。营养盐DIN、DIP、DSi浓度平均值分别为7.19、0.47、15.88μmol·L-1, 其中硝酸盐(NO- 3 -N)、亚硝酸盐(NO- 2-N)、氨氮(NH+ 4-N)对DIN的贡献率平均分别为49%、6%和45%, 氮磷比(N/P)变化范围为7.51~129.75。根据以上表层环境因子可将调查站位聚类为两组: S1、S2、S3、S4、S10、S12为近岸组; S5、S6、S7、S8、S9、S11为远岸组(图2)。通过检验分析可以看出, 盐度、pH、DIN、DIP、DSi和N/P在近岸和远岸有显著差异(表1), 其中盐度和N/P在远岸水体显著较高(P<0.01), pH、DIN、DIP和DSi在近岸水体显著较高(P<0.05), 温度和浊度在近岸和远岸分布上差异不显著。
图2 表层环境因子聚类的调查站位分布(a)和聚类结果(b) (●为近岸组, ■为远岸组, 审图号同图1)

Fig. 2 Distribution of sampling stations based on surface environmental factors clustering (a, ● represents stations of nearshore group, ■ represents stations of offshore group) and clustering results (b)

表1 2022年5月南澳近海不同海域环境因子差异及检验显著性

Tab. 1 Variability and test significance of environmental factors in the nearshore and offshore waters of Nan’ao in May 2022

因子 温度/℃ 盐度/‰ pH 浊度/NTU DIN/(μmol·L-1) DIP/(μmol·L-1) DSi/(μmol·L-1) 氮磷比
近岸 23.55±0.39 28.04±1.85 8.03±0.09 4.17±2.63 12.31±4.39 0.77±0.59 24.56±4.55 26.13±21.53
远岸 23.22±0.50 31.37±0.78 8.16±0.06 1.93±2.22 2.06±0.64 0.16±0.09 7.20±3.61 105.08±18.47
t-test t=1.528, P=0.187 t=5.126,
P<0.01
t=5.665,
P<0.01
t=1.53,
P=0.187
t=5.81,
P<0.05
t=2.95,
P<0.05
t=8.93,
P<0.01
t=17.45,
P<0.01

2.2 浮游植物群落

2.2.1 浮游植物群落测序结果

对测序获得的18S rRNA基因进行序列拼接、质控过滤后共获得763259条有效序列, 不同样品序列数为33480~86939, 序列平均碱基长度为383bp。从样本中随机抽取一定数量的序列, 统计这些序列数所代表的分类单元 (operational taxonomic unit, OTU)数目, 并以序列数与OTU数目来构建稀释性曲线, 结果显示, 各样本的OUT数目随序列数的增加呈现出逐渐平缓的趋势, 说明测序数据量合理。

2.2.2 浮游植物群落结构

通过形态学鉴定方法, 在调查海域共鉴定浮游植物5门8纲27目39科52属105种, 其中硅藻门(Bacillariophyta)67种, 甲藻门(Dinophyta)32种, 棕鞭藻门(Ochrophyta)4种, 隐藻门(Cryptophyta)1种, 裸藻门(Euglenophyta)1种。通过高通量测序技术共鉴定6门32纲97目155科272属543种, 其中甲藻门219种, 硅藻门155种, 绿藻门(Chlorophyta)71种, 定鞭藻门(Haptophyta)36种, 隐藻门35种, 棕鞭藻门27种。两种方法均鉴定得到的浮游植物有44种, 其中包括硅藻26种、甲藻14种、棕鞭藻3种和隐藻1种。
门水平上, 形态学鉴定结果中, 硅藻门的平均相对丰度最高, 为74.54%, 其次是甲藻门(24.78%), 棕鞭藻门、隐藻门和裸藻门总共占0.69%。从分布上来看, 近岸海域硅藻和甲藻的平均相对丰度相差不大, 分别占53.23%和45.67%; 而远岸海域硅藻则具有显著优势, 平均相对丰度为90.74%(图3)。高通量测序结果中, 甲藻门的平均相对丰度最高, 为67.84%, 其次依次为硅藻门(17.52%)、绿藻门(9.94%)、隐藻门(3.20%)、定鞭藻门(1.32%)和棕鞭藻门(0.18%)。从分布上看, 近岸海域和远岸海域没有明显的差异, 值得注意的是S9站位甲藻和硅藻占据整个浮游植物群落的99.37%。
图3 南澳海域浮游植物在门水平和纲水平上的相对丰度

Fig. 3 Relative abundance of phytoplankton at the phylum and class levels in the coastal waters of Nan’ao

利用形态学鉴定方法得到调查站位浮游植物丰度分布情况(图4a)。调查期间, 南澳海域浮游植物丰度变化范围是0.11×10⁵~6.85×10⁵cells·L-1, 平均值为1.349×10⁵cells·L-1。从空间分布上看, 榕江河口至南澳以南海域浮游植物丰度较高, 其中最高值出现在S9站位; 柘林湾养殖区和远岸海域浮游植物丰度较低, 最低值出现在S4站位。近岸海域叶绿素a浓度[(3.22±2.80)mg·m-3]高于远岸海域[(1.88±1.45)mg·m-3], 最高值出现在S10站位(图4b)。浮游植物丰度与叶绿素a浓度在分布上表现出显著的相关性(P<0.05)。
图4 2022年5月南澳海域浮游植物丰度(a)及叶绿素a浓度(b)分布情况(审图号同图1)

Fig. 4 Distribution of phytoplankton abundance (a) and chlorophyll a concentration (b) in the coastal waters of Nan’ao in May 2022

2.2.3 浮游植物群落多样性

利用形态学鉴定方法和高通量测序技术得到的浮游植物群落多样性结果上有所差异(图5)。形态学鉴定结果(图5a)显示, 近岸组多样性指数略高于远岸组, Shannon指数近岸组均值为3.72, 远岸为3.05; Simpson指数近岸组均值为0.85, 远岸组为0.71; Pielou指数近岸组均值为0.74, 远岸组为0.58; 两组的Shannon、Simpson、Pielou指数差异均不显著(P>0.05)。高通量测序结果(图5b)显示, 近岸组多样性指数略低于远岸组, Shannon指数近岸组均值为4.54, 远岸为5.02; Simpson指数近岸组均值为0.88, 远岸组为0.91; Pielou指数近岸组均值为0.56, 远岸组为0.62; 两组的Shannon和Pielou指数差异显著(P<0.05), Simpson指数差异不显著(P>0.05)。
图5 基于形态学鉴定(a)和高通量测序(b)的南澳海域浮游植物多样性指数(A为近岸组, B为远岸组)

Fig. 5 Diversity indexes of the phytoplankton community in the coastal waters of Nan’ao based on the morphological approach (a) and the molecular approach (b) (A represents nearshore stations, B represents offshore stations)

2.2.4 优势种

将优势度≥0.02的种类定义为优势种, 优势度≥0.1的定义为绝对优势种, 对南澳春季样品进行物种优势度分析(表2)。形态学鉴定结果中, 浮游植物优势种有7种, 其中硅藻门5种、甲藻门2种, 占绝对优势
的是扁面角毛藻(Chaetoceros compressus)(优势度为0.33)和海洋原甲藻(Prorocentrum micans)(优势度为0.13), 优势种的丰度占总丰度的69.50%。从分布上来看, 扁面角毛藻在榕江河口的S10站位和远岸海域的S6、S9站位有较高的相对丰度(图6a), 其中丰度最高值在S9站位, 为4.60×10⁵cells·L-1。海洋原甲藻在近岸海域的S1、S2及S10站位相对丰度较高, 其中丰度最高值在S10站位, 为1.58×10⁵cells·L-1。高通量测序结果中, 浮游植物优势种有7种, 其中硅藻门2种、甲藻门5种、绿藻门1种, 占绝对优势的是球形异帽藻(Heterocapsa rotundata)(优势度为0.23), 优势种的总平均相对丰度为58.34%。从分布上看, 球形异帽藻在S10、S11、S12站位的相对丰度较高, 三个站位均位于榕江河口附近海域(图6b)。
表2 2022年5月南澳海域浮游植物优势种

Tab. 2 Dominant species in the coastal waters of Nan’ao in May 2022

分类水平 优势度 出现频率%
形态学鉴定 高通量测序
硅藻门Bacillariophyta 扁面角毛藻Chaetoceros compressus 0.33 - 83.33
微眼藻Minutocellus sp. - 0.05 100
多形微眼藻Minutocellus polymorphus - 0.03 100
艾氏角毛藻Chaetoceros eibenii 0.02 - 58.33
洛氏菱形藻Nitzschia lorenziana 0.02 - 83.33
尖刺拟菱形藻Pseudo-nitzschia pungens 0.02 - 100
中肋骨条藻Skeletonema costatum 0.02 - 41.67
甲藻门 Dinophyta 球形异帽藻Heterocapsa rotundata - 0.22 100
海洋原甲藻Prorocentrum micans 0.13 - 100
剧毒卡洛藻Karlodinium veneficum - 0.09 100
单眼藻Warnowia sp. - 0.09 100
单眼藻Warnowia spp. 0.07 100
锥状斯氏藻Scrippsiella trochoidea 0.02 - 83.33
绿藻门Chlorophyta 共球藻目Picochlorum sp. - 0.03 100

注: “-”表示在相应航次优势度< 0.02, 未判定为优势种

图6 形态学鉴定(a)和高通量测序(b)的浮游植物优势种相对丰度及分布情况

C. compressus为扁面角毛藻, C. eibenii为艾氏角毛藻, N. lorenziana为洛氏菱形藻, P. pungens为尖刺拟菱形藻, S. costatum为中肋骨条藻, P. micans为海洋原甲藻, S. trochoidea锥状斯氏藻, H. rotundata为球形异帽藻, K. veneficum为剧毒卡洛藻, Warnowia sp.和Warnowia spp.为单眼藻, Minutocellus sp. 为微眼藻, Picochlorum sp. 属于共球藻目, M. polymorphus为多形微眼藻

Fig. 6 Relative abundances and distributions of dominant species by morphological (a) and molecular (b) analyses

2.3 浮游植物群落与环境因子的相关性分析

汕头南澳海域浮游植物群落对各环境因子的响应不同(图7)。在形态学鉴定结果中(图7a), 浮游植物群落的总丰度与盐度显著相关(P<0.05); 硅藻的相对丰度与pH极显著相关(P<0.01); 甲藻的相对丰度与温度极显著相关(P<0.01), 与盐度显著相关(P<0.05)。在高通量测序结果中 (图7b), 硅藻相对丰度与NH+ 4-N显著相关(P<0.05); 甲藻相对丰度与pH、NH+ 4-N、DIP显著相关(P<0.05); 隐藻相对丰度与pH显著相关(P<0.05); 定鞭藻相对丰度与pH显著相关(P<0.05)。浮游植物优势物种与环境因子的冗余分析(RDA)结果显示, 前两轴的环境因子解释了超过80%的物种信息(图8), 说明RDA排序结果能够较好地反映浮游植物优势种与环境因子的关系。形态学鉴定结果显示影响优势种分布的主要环境因子是pH(P<0.01) 、盐度和DIP(P<0.05) (图8a); 高通量测序结果显示影响优势种分布的主要环境因子是DIP(P<0.05) (图8b)。
图7 基于形态学鉴定(a)和高通量测序(b)浮游植物群落门水平上与环境因子的相关性

Fig. 7 Pairwise comparison of the phytoplankton community and environmental factors based on morphological (a) and molecular (b) analyses

图8 基于形态学鉴定(a)和分子鉴定(b)南澳海域浮游植物优势种与环境因子的冗余分析分析

Fig. 8 Redundancy analysis of dominant species of phytoplankton and environmental factors in the coastal waters of Nan’ao based on the morphological approach (a) and the molecular approach (b)

3 讨论

3.1 春季南澳海域浮游植物群落结构和多样性

南澳海域水体比较开放, 河口与外海水体交换通畅(陈丹婷 等, 2020), 浮游植物群落结构在季节上变化明显, 其中春季往往以硅藻为主(杜虹 等, 2011; 刘陈 等, 2019; 李冀刚 等, 2023)。本次研究使用形态学鉴定与高通量测序技术结合的方法对南澳海域春季浮游植物群落进行分析, 以丰富对该海域真核浮游植物多样性的评估。
本研究中, 利用两种方法总共鉴定出浮游植物7个门, 形态学鉴定结果中, 硅藻门平均相对丰度为74.54%, 其次为甲藻门24.78%, 而高通量测序结果中, 甲藻门平均相对丰度为67.84%, 硅藻门为17.52%; 7个门中绿藻门和定鞭藻门在镜检结果中未出现(图3)。纲水平上, 两种方法共鉴定出浮游植物33个纲, 其中除裸藻纲外, 形态学方法鉴定结果中的其余7个纲在高通量测序结果中也出现(图3), 而仅高通量测序鉴定出的25个纲中有11个属于绿藻门。
利用形态学鉴定方法发现, 硅藻在南澳远岸海域有显著优势, 而甲藻在近岸海域有增加的趋势, 纲水平上中型硅藻纲、甲藻纲和硅藻纲的平均相对丰度超过10%。从优势种上看, 绝对优势种为扁面角毛藻, 其细胞密度平均为0.53×10⁵cells·L-1, 主要分布在南澳岛沿岸及榕江河口海域(图6a)。一般认为角毛藻是沿海海域春季赤潮的重要组成部分(陈菊芳 等, 2005; Bosak et al, 2017), 而根据王艳 等(2010)于2006至2007年的调查, 汕头海域的角毛藻种类较少、丰度较高, 表明该海域较广东其他海域浮游植物群落结构不稳定。此外, 尖刺拟菱形藻可能产生软骨藻酸(domoic acid, DA), 这种神经毒素可能通过贝类的富集作用进而对人类产生威胁(Lefebvre et al, 2010; Pednekar et al, 2018), 本次调查中尖刺拟菱形藻主要分布在榕江河口。利用高通量测序技术发现, 甲藻的平均相对丰度最高, 硅藻其次, 它们在分布上差异较形态学鉴定结果不明显, 纲水平上只有甲藻纲的平均相对丰度超过10%。从优势种上看, 绝对优势种为球形异帽藻, 其在本次调查中优势度显著高于其他浮游植物, 在榕江河口处相对丰度较高。球形异帽藻与另一优势种剧毒卡洛藻属于有害藻华类群(harmful algal blooms, HAB) (Oda et al, 2001; Lin et al, 2018), 其中球形异帽藻是一种混合营养型甲藻, 在光照强度降低时将营养方式转向异养并可能形成赤潮 (Millette et al, 2017); 剧毒卡洛藻已被证实了其释放的卡洛藻毒素(karlotoxins)在低浓度上即可对幼鱼产生致死效应(Adolf et al, 2015; Llanos-Rivera et al, 2023), 因此对野生和养殖鱼类造成危害, 本次调查中剧毒卡洛藻相对丰度较高的站位集中在柘林湾养殖区。
利用形态学鉴定方法统计本次调查海域浮游植物丰度发现, 从榕江河口至南澳岛以南的浮游植物丰度较高, 柘林湾养殖区及远岸海域的浮游植物丰度较低, 且丰度分布情况与叶绿素a 浓度具有显著相关性(图4)。通过多样性指数可以较好地反映生态系统稳定性, 形态学鉴定结果可以看出, 近岸海域浮游植物多样性略高于远岸海域(图5), 这与河口的高营养水平有关(Telesh, 2004) 。根据Hendey(1977)将Shannon指数反映的浮游植物群落多样性分为4个等级: [0~1]为高污染, (1~2]为中度污染, (2~3]为轻度污染, (3~4]为轻微污染, 本次调查期间南澳海域浮游植物多样性整体处于轻微污染。高通量测序得到的多样性指数高于形态学鉴定方法, 且Shannon指数和Pielou指数在近岸和远岸海域差异显著, 但与形态学鉴定结果相反, 远岸海域的多样性指数更高, 这可能是由于高通量测序对捕获物种信息更为敏感, 尤其是在营养水平较低的海域, 较小的微型浮游植物在光学显微镜下难以辨别。

3.2 环境因子对浮游植物组成的影响

春季汕头南澳海域环境因子中, 盐度、pH和营养盐水平在近岸海域与远岸海域呈现显著差异(表1)。盐度的分布特征表明近岸水体主要受径流冲淡水影响, DIN、DSi与水体盐度现呈现显著负相关 (P<0.01), 表明陆源输入是该海域营养盐分布的决定性因素之一(Turner et al, 2003)。
DIP与水体盐度的相关性不显著, 有研究发现, 海水养殖区域活性磷酸盐含量超标(宋荪阳 等, 2023), 这与本次调查中柘林湾养殖区的DIP高值一致。
浮游植物组成受各种环境因子的综合影响。形态学鉴定结果的相关性分析发现, 盐度与浮游植物丰度呈现显著负相关(P<0.05)(图7a), 本次调查海域盐度范围在24.96‰~32‰, 一些研究结果显示, 盐度在盐度梯度较大区域是浮游植物群落和多样性的重要驱动因素(Hu et al, 2016; Sprong et al, 2020)。硅藻的相对丰度与pH呈现极显著相关(P<0.01), 这可能是由于较酸性的环境下硅藻外壳的溶解增加, 降低了其结构完整性和保护功能(Johnson et al, 2012; Cyronak et al, 2016)。甲藻的相对丰度与温度呈现极显著正相关(P<0.01), 温度往往主导着浮游植物组成的季节性变化, 以往对南澳海域浮游植物的调查发现, 从冬季到春季甲藻数量和优势种呈增多趋势(刘陈 等, 2019)。形态学鉴定的RDA结果显示, pH与硅藻门优势种的分布呈现明显的正相关, 盐度与优势种分布呈现负相关(图8a), 与门水平上的相关性分析结果一致, 说明优势种在群落结构中有重要影响。此外, 两种方法的RDA结果均显示, 影响浮游植物优势种的主要环境因子是DIP。此前一些研究报道了南澳海域春季的初级生产力受磷的相对限制(王雨 等, 2011; 刘陈 等, 2019; 陈丹婷 等, 2020)。根据Redfield比值即N∶P =16∶1(Redfield et al, 1963), 本次调查结果显示, 除柘林湾养殖区外的其他海域均受不同程度的磷限制。虽然柘林湾不受营养盐的限制作用, 但是该区域的浮游植物丰度反而较其他近岸海域更低, 叶绿素a浓度的测定结果也显示为低值(图4b), 这可能与该区域养殖区贝类的下行调控作用以及养殖龙须菜对浮游植物生长的抑制作用有关(雷光英 等, 2010; 刘旭平 等, 2023), 该结果也能反映出柘林湾养殖密度可能过大, 存在食物供应不足的问题, 需要进一步关注和研究该海域的合理养殖容量。

3.3 形态学鉴定与高通量测序方法比较

传统的形态学鉴定方法在湖泊、河口、外海等不同水体的浮游植物生态学研究中广泛应用(李欣 等, 2012; 吴转璋 等, 2023), 适用于一些较高的分类单元, 但是对于直径小于20μm的微型和微微型浮游植物来说, 仅仅使用光学显微镜进行分类工作十分困难。高通量测序技术不仅使得浮游植物检测变得高效, 而且在低分类水平上也有着更高的分辨率, 同时揭示了一些微微型浮游植物的存在, 对调查区域的生物多样性进行良好补充(Xiao et al, 2014; Akcaalan et al, 2023)。
在本次调查中, 高通量测序结果较好地覆盖了形态学鉴定结果, 在纲水平上仅裸藻纲未检测到(图3)。此外, 高通量测序还补充了绿藻门和定鞭藻门, 其中包含大量微型浮游植物, 如赫氏颗石藻(Emiliania huxleyi)的个体多数小于20μm(孙军, 2007)。在反映生态系统多样性方面, 高通量测序结果显著高于形态学鉴定结果(图5)。但是由于高通量测序一般使用的通用引物, 可能导致结果产生偏移。在一些使用形态学与高通量测序方法结合的研究中均显示, 甲藻的相对丰度在高通量测序结果中明显偏高, 尤其是春季的结果中达到了70%(Bazin et al, 2014; Xu et al, 2017; 黄圆 等, 2024)。导致高通量测序结果产生偏移的原因包括引物的兼容性、基因拷贝数的差异以及不同的克隆效率等。有研究表明, DNA拷贝数与藻类细胞大小之间存在正相关性, 比如甲藻的18S rDNA拷贝数比其他浮游植物高得多(Zhu et al, 2005; Samanta et al, 2016)。本次高通量测序结果中有一部分注释到绿藻门, 而在本次及之前的形态学调查结果中绿藻没有出现或极少出现, 在榕江的汕头港绿藻的物种比例占14.6%(杜虹 等, 2011), 这可能与环境DNA的扩散作用有关。环境DNA主要以溶解、颗粒吸附、细胞内和细胞器内四种状态存在(Mauvisseau et al, 2022), 而且随着海流运动传递到更远的区域, 能使受海流影响较大的区域表现出更高的多样性(Weigand et al, 2019)。此外, 虽然在纲水平上高通量测序结果良好地涵盖了形态学鉴定结果, 但在属水平和种水平上还有相当部分未检测到, 这对引物的兼容性和浮游植物数据库种类的全面性提出了更高的要求, 应该增加一些物种的DNA条形码数量以提高物种注释的准确性(Weigand et al, 2019)。因此, 在未来长时间的高通量测序技术发展过程中, 还利用传统的形态学鉴定方法结合分子生物学技术, 才能更全面地描述浮游植物群落结构及多样性。

4 结论

(1)基于形态学方法鉴定出浮游植物5门8纲27目39科52属105种, 近岸海域以甲藻为主, 远岸海域以硅藻为主, 扁面角毛藻为绝对优势种; 基于高通量测序鉴定出6门32纲97目155科272属543种, 以甲藻为主, 球形异帽藻为绝对优势种。
(2)通过将环境因子聚类分析可将站位分为近岸和远岸区域。基于形态学鉴定结果显示近岸海域浮游植物多样性高于远岸, 近岸海域浮游植物群落以甲藻为主, 远岸以硅藻为主; 基于高通量测序结果显示近岸浮游植物多样性低于远岸。
(3)春季南澳浮游植物丰度平均值为1.35×10⁵ cells·L-1, 与盐度呈现显著相关, 养殖区与远岸海域浮游植物丰度较低; 影响南澳浮游植物群落结构的主要环境因子是pH、盐度和DIP。
(4)通过对两种方法的比较表明将形态学分类和分子生物学的方法加以结合将是未来浮游植物研究的最佳选择。
[1]
蔡德华, 陈振明, 唐书怿, 2020. 南澳岛周边海域海水质量近10年变化趋势浅析[J]. 环境影响评价, 42(2): 63-66.

CAI DEHUA, CHEN ZHENMING, TANG SHUYI, 2020. Analysis on the change trend of sea water quality around Nan’ao Island in recent 10 years[J]. Environmental Impact Assessment, 42(2): 63-66 (in Chinese with English abstract).

[2]
陈丹婷, 柯志新, 谭烨辉, 等, 2020. 汕头南澳-东山海域营养盐季节分布特征及其对浮游植物生长的潜在性限制[J]. 生态科学, 39(4): 41-50.

CHEN DANTING, KE ZHIXIN, TAN YEHUI, et al, 2020. Seasonal distribution of nutrients concentrations and the potential limitation for phytoplankton growth in the coastal region of Nan’ao-Dongshan[J]. Ecological Science, 39(4): 41-50 (in Chinese with English abstract).

[3]
陈菊芳, 齐雨藻, 徐宁, 等, 2005. 大亚湾拟菱形藻水华及其在生物群落中的生态地位[J]. 海洋学报, 27(1): 114-119.

CHEN JUFANG, QI YUZAO, XU NING, et al, 2005. Pseudo-Nitzschia bloom and its ecological role in the biological community in the Daya Bay, the South China Sea[J]. Acta Oceanologica Sinica, 27(1): 114-119 (in Chinese with English abstract).

[4]
陈炜婷, 姜广甲, 邓伟, 等, 2023. 基于GIS的2001-2020年广东近岸海域赤潮时空分布[J]. 环境工程, 41(S2): 49-53.

CHEN WEITING, JIANG GUANGJIA, DENG WEI, et al, 2023. Temporal and spatial distribution of harmful algal blooms in Guangdong province coastal area during 2001-2020 based on GIS[J]. Environmental Engineering, 41(S2): 49-53 (in Chinese with English abstract).

[5]
杜虹, 王亮根, 曹会彬, 等, 2011. 汕头港浮游植物组成特征及其与环境的关系[J]. 生态学杂志, 30(8): 1757-1765.

DU HONG, WANG LIANGGEN, CAO HUIBIN, et al, 2011. Phytoplankton community composition and its relationships with the environment in Shantou Harbor of South China[J]. Chinese Journal of Ecology, 30(8): 1757-1765 (in Chinese with English abstract).

[6]
郭玉洁, 2003. 中国海藻志[M]. 北京: 科学出版社 (in Chinese).

[7]
黄长江, 董巧香, 郑磊, 1999. 1997年底中国东南沿海大规模赤潮原因生物的形态分类与生态学特征[J]. 海洋与湖沼, 30(6): 581-590.

HUANG CHANGJIANG, DONG QIAOXIANG, ZHENG LEI, 1999. Taxonomic and ecological studies on a large scale Phaeocystis pouchetii bloom in the southeast coast of China during late 1997[J]. Oceanologia Et Limnologia Sinica, 30(6): 581-590 (in Chinese with English abstract).

[8]
黄圆, 岑竞仪, 梁芊艳, 等, 2024. 基于高通量测序技术的深圳湾真核浮游植物群落结构研究[J]. 热带海洋学报, 43(2): 21-33.

HUANG YUAN, CEN JINGYI, LIANG QIANYAN, et al, 2024. Study on the community structure of eukaryotic phytoplankton in the Shenzhen Bay based on high-throughput sequencing technology[J]. Journal of Tropical Oceanography, 43(2): 21-33 (in Chinese with English abstract).

[9]
暨卫东, 黄尚高, 1990. 台湾海峡西部营养盐变化特征-Ⅲ. 水系混合及浮游植物摄取转移对磷酸盐含量变化影响的统计分析[J]. 海洋学报, 12(4): 447-454 (in Chinese).

[10]
雷光英, 杨宇峰, 李宵, 2010. 龙须菜对赤潮异弯藻和海洋原甲藻的生长抑制效应[J]. 海洋环境科学, 29(1): 27-31.

LEI GUANGYING, YANG YUFENG, LI XIAO, 2010. Inhibitory effects of Gracilaria lemaneiformis on growth of Heterosigma akashiwo and Prorocentrum micans[J]. Marine Environmental Science, 29(1): 27-31 (in Chinese with English abstract).

[11]
李冀刚, 杨振雄, 葛颂, 等, 2023. 汕头韩江榕江河口近岸海域浮游植物群落结构与环境因子的关系[J]. 海洋湖沼通报, 45(2): 133-141.

LI JIGANG, YANG ZHENXIONG, GE SONG, et al, 2023. Structural characterization of phytoplankton community in adjacent waters of Hanjiang Rongjiang Estuary, Shantou and determination of its relationship with environmental factors[J]. Transactions of Oceanology and Limnology, 45(2): 133-141 (in Chinese with English abstract).

[12]
黎素菊, 洪捷娴, 陈树鹏, 2022. 柘林湾养殖区氮、磷季节分布特征及富营养化评价[J]. 江西水产科技, (4): 45-47, 51 (in Chinese).

[13]
李欣, 孙军, 田伟, 等, 2012. 2009年夏季南海北部的浮游植物群落[J]. 海洋科学, 36(10): 33-39.

LI XIN, SUN JUN, TIAN WEI, et al, 2012. Phytoplankton community in the northern area of South China Sea in summer of 2009[J]. Marine Sciences, 36(10): 33-39 (in Chinese with English abstract).

[14]
林更铭, 杨清良, 2021. 西太平洋浮游植物物种多样性[M]. 北京: 科学出版社.

LIN GENGMING, YANG QINGLIANG, 2021. Species diversity of phytoplankton in the western Pacific[M]. Beijing: Science Press (in Chinese).

[15]
刘陈, 魏南, 王庆, 等, 2019. 广东汕头南澳岛近岸海域浮游植物群落结构与环境特征[J]. 应用与环境生物学报, 25(5): 1091-1098.

LIU CHEN, WEI NAN, WANG QING, et al, 2019. Phytoplankton community and environmental characteristics in the coastal waters of Nanao Island, Shantou, Guangdong[J]. Chinese Journal of Applied Environmental Biology, 25(5): 1091-1098 (in Chinese with English abstract).

[16]
刘卫东, 宋伦, 吴景, 2017. 环境样本中微型和微微型浮游植物高通量测序的引物优化[J]. 生态学报, 37(12): 4208-4216.

LIU WEIDONG, SONG LUN, WU JING, 2017. Optimization of high-throughput sequencing primers for nanophytoplankton and picophytoplankton in environmental samples[J]. Acta Ecologica Sinica, 37(12): 4208-4216 (in Chinese with English abstract).

[17]
刘旭平, 单忠才, 李媛芳, 等, 2023. 滤食性贝类选择性摄食行为研究现状[J]. 特种经济动植物, 26(5): 89-92, 107 (in Chinese).

[18]
马华栋, 王平, 温玉波, 等, 2021. 基于生态足迹分析的南澳岛旅游业可持续发展评估[J]. 海洋开发与管理, 38(8): 61-66.

MA HUADONG, WANG PING, WEN YUBO, et al, 2021. Evaluation of sustainable development of Nan’ao Island tourism based on ecological footprint analysis[J]. Ocean Development and Management, 38(8): 61-66 (in Chinese with English abstract).

[19]
彭璇, 马胜伟, 陈海刚, 等, 2014. 夏季柘林湾-南澳岛海洋牧场营养盐的空间分布及其评价[J]. 南方水产科学, 10(6): 27-35.

PENG XUAN, MA SHENGWEI, CHEN HAIGANG, et al, 2014. Spatial distribution and assessment of nutrients in marine ranching in Zhelin Bay-Nanao Island in summer[J]. South China Fisheries Science, 10(6): 27-35 (in Chinese with English abstract).

[20]
宋荪阳, 黄金臣, 岳强, 等, 2023. 唐山市海水养殖尾水监测及分析[J]. 河北渔业, (7): 23-29.

SONG SUNYANG, HUANG JINCHEN, YUE QIANG, et al, 2023. Water quality monitoring of tail water of marine aquaculture in Tangshan[J]. Hebei Fisheries, (7): 23-29 (in Chinese with English abstract).

[21]
苏纪兰, 王卫, 1990. 南海域台湾暖流源地问题[J]. 东海海洋, 8(3): 1-9.

SU JILAN, WANG WEI, 1990. On the sources of the Taiwan warm current from the South China Sea[J]. Donghai Marine Science, 8(3): 1-9 (in Chinese with English abstract).

[22]
孙军, 刘东艳, 2004. 多样性指数在海洋浮游植物研究中的应用[J]. 海洋学报, 26(1): 62-75.

SUN JUN, LIU DONGYAN, 2004. The application of diversity indices in marine phytoplankton studies[J]. Acta Oceanologica Sinica, 26(1): 62-75 (in Chinese with English abstract).

[23]
孙军, 2007. 今生颗石藻的有机碳泵和碳酸盐反向泵[J]. 地球科学进展, 22(12): 1231-1239.

SUN JUN, 2007. Organic carbon pump and carbonate counter pump of living Coccolithophorid[J]. Advances in Earth Science, 22(12): 1231-1239 (in Chinese with English abstract).

[24]
谭香, 夏小玲, 程晓莉, 等, 2011. 丹江口水库浮游植物群落时空动态及其多样性指数[J]. 环境科学, 32(10): 2875-2882.

TAN XIANG, XIA XIAOLING, CHENG XIAOLI, et al, 2011. Temporal and spatial pattern of phytoplankton community and its biodiversity indices in the Danjiangkou reservoir[J]. Environmental Science, 32(10): 2875-2882 (in Chinese with English abstract).

[25]
唐涛, 蔡庆华, 刘建康, 2002. 河流生态系统健康及其评价[J]. 应用生态学报, 13(9): 1191-1194.

TANG TAO, CAI QINGHUA, LIU JIANKANG, 2002. River ecosystem health and its assessment[J]. Chinese Journal of Applied Ecology, 13(9): 1191-1194 (in Chinese with English abstract).

[26]
王艳, 聂瑞, 李扬, 等, 2010. 广东沿海角毛藻(Chaetoceros)的种类多样性及其地理分布[J]. 海洋科学进展, 28(3): 342-352.

WANG YAN, NIE RUI, LI YANG, et al, 2010. Species diversity and geographical distribution of Chaetoceros in Guangdong coastal waters[J]. Advances in Marine Science, 28(3): 342-352 (in Chinese with English abstract).

[27]
王雨, 林茂, 林更铭, 等, 2011. 闽粤近岸夏季上升流区浮游植物群落组成及其影响因素[J]. 应用生态学报, 22(2): 503-512.

WANG YU, LIN MAO, LIN GENGMING, et al, 2011. Community composition of phytoplankton in Fujian-Guangdong coastal upwelling region in summer and related affecting factors[J]. Chinese Journal of Applied Ecology, 22(2): 503-512 (in Chinese with English abstract).

[28]
吴转璋, 朱超, 唐萍, 等, 2023. 巢湖湖区浮游植物群落与水质因子相关性分析[J]. 生物学杂志, 40(1): 79-84.

WU ZHUANZHANG, ZHU CHAO, TANG PING, et al, 2023. Correlation analysis of phytoplankton community and water quality factors in Chaohu Lake[J]. Journal of biology, 40(1): 79-84 (in Chinese with English abstract).

[29]
中华人民共和国国家质量监督检验检疫总局, 中国国家标准化管理委员, 2007. GB/T12763. 6-2007海洋调查规范第6部分:海洋生物调查 [S]. 北京: 中国标准出版社: 6-37.

General Administration of Quality Supervision, Inspection and Quarantine of the People’s Republic of China, Standardization Administration of the People’s Republic of China, 2007. GB/T12763. 6-2007 Specifications for oceanographic survey—Part 6: Marine biological survey[S]. Beijing: Standards Press of China: 6-37 (in Chinese).

[30]
中华人民共和国生态环境部,2020. 近岸海域环境监测规范(HJ 442. 3-2020)第三部分近岸海域水质监测[S]. 北京: 中国环境出版集团出版.

Ministry of Ecology and Environment of the People’s Republic of China, 2020. Technical specification for offshore environmental monitoring Part 3 offshore seawater quality monitoring[S]. Beijing: China Environmental Science Press.

[31]
周凯, 黄长江, 姜胜, 等, 2002. 2000-2001年柘林湾浮游植物群落结构及数量变动的周年调查[J]. 生态学报, 22(5): 688-698.

ZHOU KAI, HUANG CHANGJIANG, JIANG SHENG, et al, 2002. Annual dynamics of phytoplankton in Zhelin Bay: 2000-2001[J]. Acta Ecologica Sinica, 22(5): 688-698 (in Chinese with English abstract).

[32]
朱小山, 吴玲玲, 杨瑶, 等, 2005. 粤东柘林湾增养殖区氮磷的分布特征及其富营养化状态评价[J]. 海洋湖沼通报, (3): 16-22.

ZHU XIAOSHAN, WU LINGLING, YANG YAO, et al, 2005. Distribution characteristics of a and Pin Zhelin Bay, one of mariculture zones of Guangdong Province, and assessment of its eutrophication[J]. Transactions of Oceanology and Limnology, (3): 16-22 (in Chinese with English abstract).

[33]
AKCAALAN R, OZBAYRAM E G, KALELI A, et al, 2023. Does environmental DNA reflect the actual phytoplankton diversity in the aquatic environment? Case study of marine mucilage in the Sea of Marmara[J]. Environmental Science and Pollution Research, 30(28): 72821-72831.

[34]
ADOLF J E, BACHVAROFF T R, DEEDS J R, et al, 2015. Ichthyotoxic Karlodinium veneficum (Ballantine) J Larsen in the Upper Swan River Estuary (Western Australia): Ecological conditions leading to a fish kill[J]. Harmful Algae, 48: 83-93.

[35]
BARTON A D, IRWIN A J, FINKEL Z V, et al, 2016. Anthropogenic climate change drives shift and shuffle in North Atlantic phytoplankton communities[J]. Proceedings of the National Academy of Sciences of the United States of America, 113(11): 2964-2969.

[36]
BAZIN P, JOUENNE F, FRIEDL T, et al, 2014. Phytoplankton diversity and community composition along the estuarine gradient of a temperate macrotidal ecosystem: combined morphological and molecular approaches[J]. PLoS One, 9(4): e94110.

[37]
BOSAK S, SARNO D, 2017. The planktonic diatom genus Chaetoceros Ehrenberg (Bacillariophyta) from the Adriatic Sea[J]. Phytotaxa, 314(1): 1-44.

[38]
CYRONAK T, SCHULZ K G, JOKIEL P L, 2016. The Omega myth: What really drives lower calcification rates in an acidifying ocean[J]. ICES Journal of Marine Science, 73(3): 558-562.

[39]
ESENKULOVA S, SUTHERLAND B J G, TABATA A, et al, 2020. Comparing metabarcoding and morphological approaches to identify phytoplankton taxa associated with harmful algal blooms[J]. FACETS, 5(1): 784-811.

[40]
FIELD C B, BEHRENFELD M J, RANDERSON J T, et al, 1998. Primary production of the biosphere: integrating terrestrial and oceanic components[J]. Science, 281(5374): 237-240.

[41]
GILBERT J A, FIELD D, HUANG YING, et al, 2008. Detection of large numbers of novel sequences in the metatranscriptomes of complex marine microbial communities[J]. PLoS One, 3(8): e3042.

[42]
GOBLER C J, 2020. Climate change and harmful algal blooms: insights and perspective[J]. Harmful Algae, 91: 101731.

[43]
HALLEGRAEFF G M, ANDERSON D M, BELIN C, et al, 2021. Perceived global increase in algal blooms is attributable to intensified monitoring and emerging bloom impacts[J]. Communications Earth & Environment, 2: 117.

[44]
HENDEY N I, 1977. The species diversity index of some in-shore diatom communities and its use in assessing the degree of pollution insult on parts of the North Coast of Cornwall[J]. Nova Hedwigia, 54(8): 355-378.

[45]
HU Y O O, KARLSON B, CHARVET S, et al, 2016. Diversity of pico- to mesoplankton along the 2000 km salinity gradient of the Baltic Sea[J]. Frontiers in Microbiology, 7: 679.

[46]
IRIGOIEN X, HUISMAN J, HARRIS R P, 2004. Global biodiversity patterns of marine phytoplankton and zooplankton[J]. Nature, 429(6994): 863-867.

[47]
JIANG ZHAOYU, WANG YOUSHAO, CHENG HAO, et al, 2015. Spatial variation of phytoplankton community structure in Daya Bay, China[J]. Ecotoxicology, 24(7-8): 1450-1458.

[48]
JOHNSON M D, CARPENTER R C, 2012. Ocean acidification and warming decrease calcification in the crustose coralline alga Hydrolithon onkodes and increase susceptibility to grazing[J]. Journal of Experimental Marine Biology and Ecology, 434-435: 94-101.

[49]
LEFEBVRE K A, ROBERTSON A, 2010. Domoic acid and human exposure risks: A review[J]. Toxicon, 56(2): 218-230.

[50]
LIN C H, LYUBCHICH V, GLIBERT P M, 2018. Time series models of decadal trends in the harmful algal species Karlodinium veneficum in Chesapeake Bay[J]. Harmful Algae, 73: 110-118.

[51]
LLANOS-RIVERA A, ÁLVAREZ-MUÑOZ K, ASTUYA-VILLALÓN A, et al, 2023. Sublethal effect of the toxic dinoflagellate Karlodinium veneficum on early life stages of zebrafish (Danio rerio)[J]. Environmental Science and Pollution Research, 30(10): 27113-27124.

[52]
LV JIN, WU HONGJUAN, CHEN MENGQIU, 2011. Effects of nitrogen and phosphorus on phytoplankton composition and biomass in 15 subtropical, urban shallow lakes in Wuhan, China[J]. Limnologica, 41(1): 48-56.

[53]
MA CAIHUA, YOU KUI, ZHANG MEIZHAO, et al, 2008. A preliminary study on the diversity of fish species and marine fish faunas of the South China Sea[J]. Journal of Ocean University of China, 7(2): 210-214.

[54]
MAUVISSEAU Q, HARPER L R, SANDER M, et al, 2022. The multiple states of environmental DNA and what is known about their persistence in aquatic environments[J]. Environmental Science & Technology, 56(9): 5322-5333.

[55]
MILLETTE N C, PIERSON J J, ACEVES A, et al, 2017. Mixotrophy in Heterocapsa rotundata: A mechanism for dominating the winter phytoplankton[J]. Limnology and Oceanography, 62(2): 836-845.

[56]
ODA T, SATO Y, KIM D, et al, 2001. Hemolytic activity of Heterocapsa circularisquama (Dinophyceae) and its possible involvement in shellfish toxicity[J]. Journal of Phycology, 37(4): 509-516.

[57]
PEDNEKAR S M, BATES S S, KERKAR V, et al, 2018. Environmental factors affecting the distribution of Pseudo-nitzschia in two monsoonal estuaries of Western India and effects of salinity on growth and domoic acid production by P. pungens[J]. Estuaries and Coasts, 41(5): 1448-1462.

[58]
REDFIELD A C, KETCHUM B H, RECHARDS F A, 1963. The influence of organisms on the composition of sea-water[M]//HILL M N, The Sea, Vol. 2. New York: Interscience: 26-77.

[59]
REYNOLDS C S, HUSZAR V, KRUK C, et al, 2002. Towards a functional classification of the freshwater phytoplankton[J]. Journal of Plankton Research, 24(5): 417-428.

[60]
SAMANTA B, BHADURY P, 2016. A comprehensive framework for functional diversity patterns of marine chromophytic phytoplankton using rbcL phylogeny[J]. Scientific Reports, 6: 20783.

[61]
SCHLÄPFER F, SCHMID B, 1999. Ecosystem effects of biodiversity: a classification of hypotheses and exploration of empirical results[J]. Ecological Applications, 9(3): 893-912.

[62]
SPRONG P A A, FOFONOVA V, WILTSHIRE K H, et al, 2020. Spatial dynamics of eukaryotic microbial communities in the German Bight[J]. Journal of Sea Research, 163: 101914.

[63]
TELESH I V, 2004. Plankton of the Baltic estuarine ecosystems with emphasis on Neva Estuary: a review of present knowledge and research perspectives[J]. Marine Pollution Bulletin, 49(3): 206-219.

[64]
TURNER R E, RABALAIS N N, JUSTIC' D, et al, 2003. Global patterns of dissolved N, P and Si in large rivers[J]. Biogeochemistry, 64(3): 297-317.

[65]
VANDEPUTTE D, KATHAGEN G, D’HOE K, et al, 2017. Quantitative microbiome profiling links gut community variation to microbial load[J]. Nature, 551(7681): 507-511.

[66]
WEIGAND H, BEERMANN A J, FEDOR Č, et al, 2019. DNA barcode reference libraries for the monitoring of aquatic biota in Europe: Gap-analysis and recommendations for future work[J]. Science of the Total Environment, 678: 499-524.

[67]
XIAO XI, SOGGE H, LAGESEN K, et al, 2014. Use of high throughput sequencing and light microscopy show contrasting results in a study of phytoplankton occurrence in a freshwater environment[J]. PLoS One, 9(8): e106510.

[68]
XU DANGHUI, FANG XIANGWEN, ZHANG RENYI, et al, 2015. Influences of nitrogen, phosphorus and silicon addition on plant productivity and species richness in an alpine meadow[J]. AoB PLANTS, 7: plv125.

[69]
XU XIN, YU ZHIMING, CHENG FANGJIN, et al, 2017. Molecular diversity and ecological characteristics of the eukaryotic phytoplankton community in the coastal waters of the Bohai Sea, China[J]. Harmful Algae, 61: 13-22.

[70]
YU LIUQIAN, GAN JIANPING, 2022. Reversing impact of phytoplankton phosphorus limitation on coastal hypoxia due to interacting changes in surface production and shoreward bottom oxygen influx[J]. Water Research, 212: 118094.

[71]
ZHU FEI, MASSANA R, NOT F, et al, 2005. Mapping of picoeucaryotes in marine ecosystems with quantitative PCR of the 18S rRNA gene[J]. FEMS Microbiology Ecology, 52(1): 79-92.

Outlines

/