Marine Environmental Science

Changes and controlling factors of seawater phosphorus in Weizhou Island over the past 30 years: Insights from high-resolution coral records

  • CHEN Yuyue , 1 ,
  • JIANG Wei , 2 ,
  • YANG Haodan 2 ,
  • YU Kefu 2
Expand
  • 1. College of Marine Science and Technology, China University of Geosciences, Wuhan 430070, China
  • 2. Guangxi Laboratory on the Study of Coral Reefs in the South China Sea, School of Marine Sciences, Guangxi University, Nanning 530004, China
JIANG Wei. email:

Copy editor: LIN Qiang

Received date: 2024-06-27

  Revised date: 2024-07-29

  Online published: 2024-08-12

Supported by

National Key Research and Development Program of China(2023YFF0804801)

National Natural Science Foundation of China(41976059)

Abstract

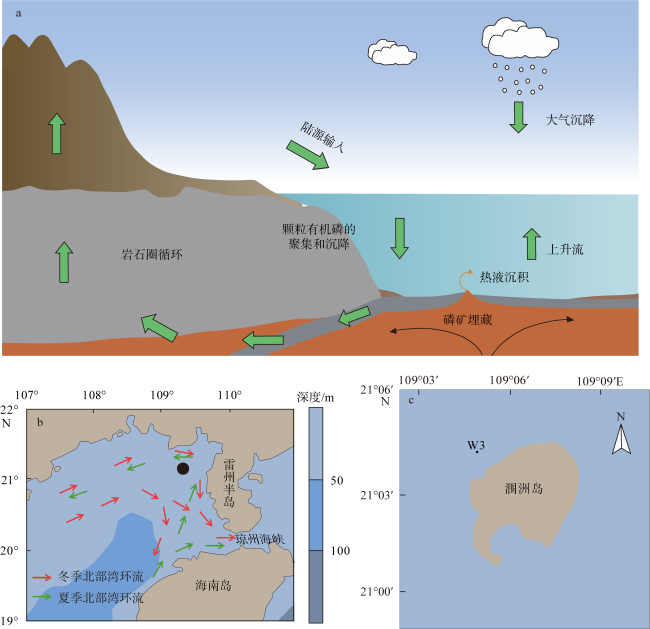
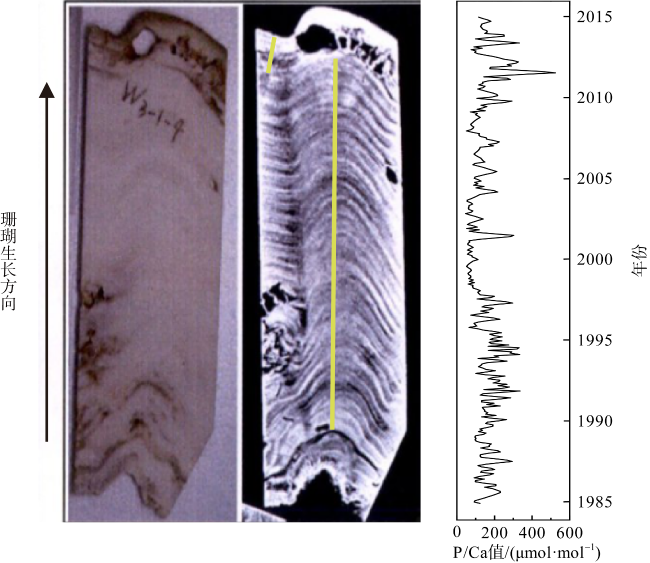
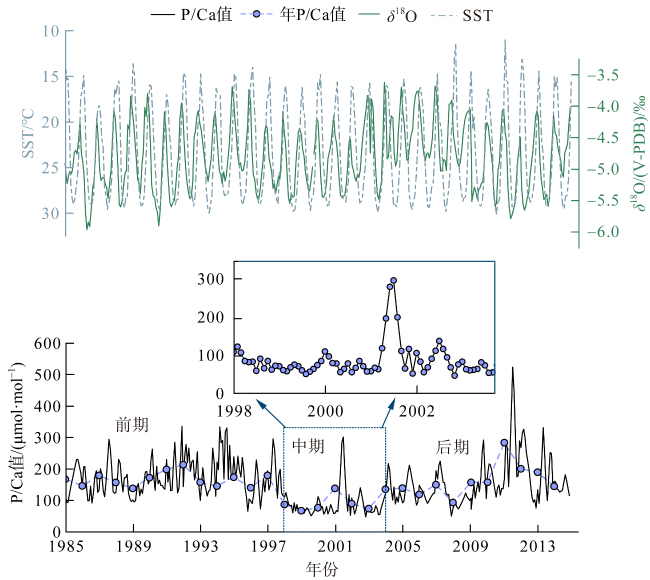
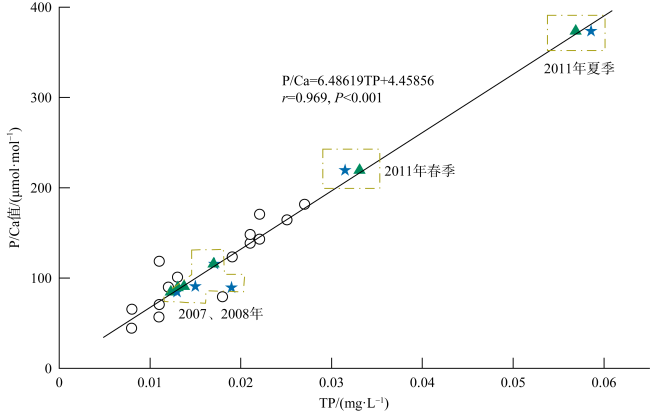
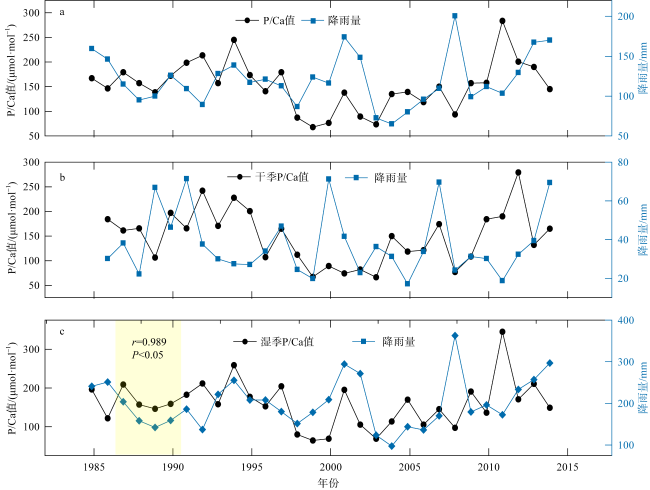
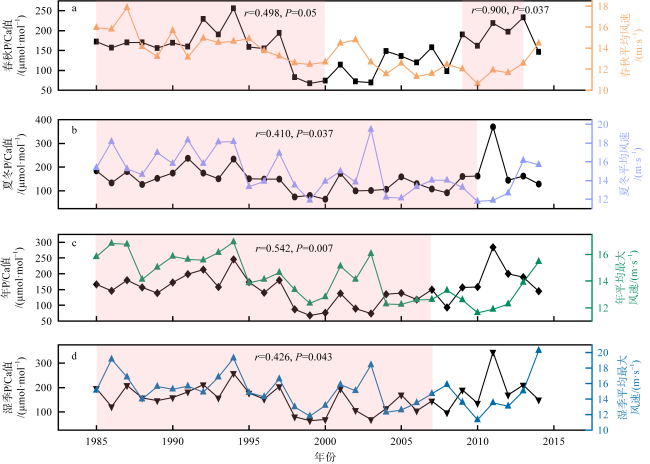
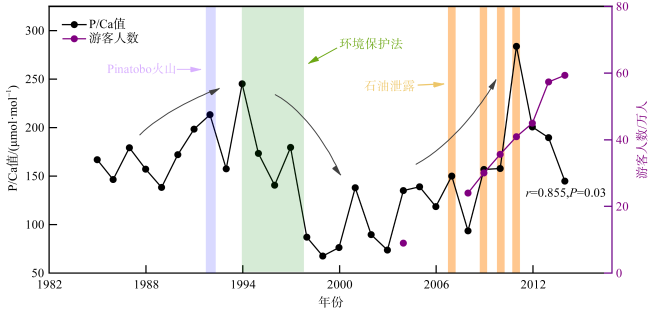
The change in phosphorus (P) content in surface seawater is an important parameter to evaluate the nutrient content of marine ecosystem, and plays a significant role in regulating the evolution of the Earth’s environment. Weizhou Island is the largest and youngest volcanic island in China. The change in surface phosphorus content in seawater over a long time scale is not well documented, and the influencing factors remain unclear. Coral skeleton P/Ca is a reliable index for retrieving seawater phosphorus content and is widely used to reconstruct the high-resolution history of seawater P content. In this study, continuously growing corals from northwest Weizhou Island were taken as the research object, and an age framework was established from 1985 to 2015 based on coral oxygen isotopes to reconstruct the P/Ca change history of surface seawater in monthly resolution from 1985 to 2014. The results showed that the coral P/Ca value varied greatly in different years and seasons, with low P/Ca values observed from 1998 to 2003, generally lower than the annual average. The change in coral P/Ca ratio was highly correlated with the change in monsoon intensity (P<0.05), and the coral P/Ca value increased significantly during the monsoon and typhoon periods, indicating that the sea ~surface wind was the main factor controlling the change in seawater P content in this region. Additionally, volcanic eruptions, oil spills, and tourism can also cause a temporary increase in P content, but the effects are limited. However, there was no significant correlation between the inter-annual variations of rainfall and changes between wet and dry seasons and the P/Ca values, indicating that terrigenous materials had limited influence on the change in P content in seawater.

Cite this article

CHEN Yuyue , JIANG Wei , YANG Haodan , YU Kefu . Changes and controlling factors of seawater phosphorus in Weizhou Island over the past 30 years: Insights from high-resolution coral records[J]. Journal of Tropical Oceanography, 2025 , 44(3) : 206 -216 . DOI: 10.11978/2024132

磷(P)是影响海洋浮游植物生物量和群落结构的关键营养元素, 对海洋初级生产力发挥着一定的抑制和促进作用(Delaney, 1998; Benitez-Nelson et al, 1999)。在地质时间尺度上, P被认为是维持海洋初级生产力的最终限制营养元素(Kolowith et al, 2001; Paytan et al, 2007)。然而, 长期营养记录的缺乏限制了对营养污染程度和生态影响的理解。
热带造礁珊瑚对环境变化十分敏感, 连续生长时间长且珊瑚文石骨骼年际界限清楚, 结合高分辨率氧同位素可以建立精确的年龄框架, 因此热带造礁珊瑚是高分辨率记录海洋环境长时间尺度演化的重要载体(Hoppe, 2003; Lough, 2004; Yu et al, 2005; Yu, 2012)。Dodge等人首先注意到珊瑚骨骼P/Ca值作为营养指标的潜力, 巴拿马湾的多个珊瑚群落说明了骨骼P/Ca值与海水溶解无机磷(dissolved inorganic phosphorus, DIP)之间存在相同的关系(Dodge et al, 1984b; LaVigne et al, 2010)。Chen等(2011)通过南海大亚湾富营养环境下生长的滨珊瑚岩心发现, 在富营养化环境下, 珊瑚的P/Ca值与海水中总磷(total phosphorus, TP; 包括溶解和颗粒态)的线性关系更强。Mallela等(2013)发现珊瑚P/Ca值与海水磷酸盐的强相关关系, 并建立了珊瑚P/Ca值与海水磷酸盐的线性关系, 随后通过大堡礁的多个珊瑚岩芯研究表明, 珊瑚P/Ca值的时间变异性与附近河流向珊瑚礁排放的总颗粒P呈强烈共变。Chen等(2019)在此基础上进一步证实了珊瑚P/Ca值跟踪反演海水DIP变化的可靠性。以上研究都表明, 珊瑚骨骼P/Ca值与海水中各种形式的P有很强的相关性, 可以作为海水中P营养物质的代用指标。
涠洲岛是我国最大最年轻的火山岛, 也是广西面积最大的海岛, 表层海水温度平均24.6℃, 光照充足, 造礁石珊瑚分布广泛(况雪源 等, 2007), 其珊瑚礁生态区是浮游植物生长受到P限制较明显的海区(何本茂 等, 2013)。海水混合层P含量变化缺乏长时间尺度记录, P含量演化的影响因子尚未明确。虽然前人对涠洲岛的海水化学性质和造礁珊瑚开展过一些研究, 但主要集中于古气候研究(Yu et al, 2001; Chen et al, 2009; Yu, 2012)。本研究利用涠洲岛1985—2014年高分辨率的珊瑚骨架地球化学数据(P/Ca、δ18O等)研究1985—2014年浅海珊瑚礁区海水P的变化规律, 通过分析P/Ca值与降雨量、海表风速、人类活动、火山爆发等的相关关系, 探讨了海水P的影响因素及其影响程度。本文的研究结果有助于了解涠洲岛营养污染程度和海水P对生态系统的影响, 从而为涠洲岛珊瑚礁区保护和发展提供科学依据。

1 研究区域、材料与方法

1.1 研究区域

涠洲岛(20°50´—21°10´N, 109°00´—109°15´E)隶属于广西北海市, 与雷州半岛、海南岛、越南相邻, 长约7.5km, 宽约5.5km, 全岛陆地面积约24.98km2(刘敬合 等, 1991)(图1)。涠洲岛是我国形成时间最晚, 由火山岩堆积成的岛屿, 环境承载能力和恢复能力十分有限(刘敬合 等, 1991; 况雪源 等, 2007)。受亚热带海洋性季风气候的影响, 涠洲岛夏季盛行偏南风, 冬季盛行偏北风, 春秋两季处于季风转换期, 风速较低(Gai et al, 2020)。根据涠洲岛月平均降水量, 5—10月为雨季, 11月至次年4月为干季(李嘉琪 等, 2018)。近年来, 涠洲岛人为活动的增加导致附近海水的营养通量显著增加, 过量的营养物质会影响珊瑚礁的健康程度, 出现珊瑚礁退化现象(McCook, 1999; Cloern, 2001; Glibert et al, 2006; Wang et al, 2018)。
图1 研究区位置示意图

a. 海洋磷循环示意图, 修改自Benitez-Nelson (2000)和周强 等(2021); b. 北部湾环流图, 黑色圆点为采样站位, 基于自然资源部标准地图服务网站下载的审图号为GS(2022)4309号的标准地图制作; c. 采样站位图

Fig. 1 Schematic diagram of the marine phosphorus cycle (a) and diagram of circulation of the Beibu Gulf (b) and the sampling site (c)

1.2 材料与方法

分析的活体橙黄滨珊瑚W3于2015年10月采自涠洲岛西北部(21°04′07″N, 109°05′24″E) (图1), 没有出现白化或疾病的迹象。样品运输至实验室后, 首先用清水冲刷去除珊瑚礁表面藻类、软体动物外壳等杂质, 使用高速切割机沿主要生长轴把W3珊瑚切割成10mm厚, 80~100mm宽的薄板, 然后使用医用X光透视机获取X射线成像。为了去除表面污染物, 将珊瑚薄板放置在10%H2O2中浸泡48h, 再加入超纯水(Milli-Q)超声清洗珊瑚薄板3次, 之后放置于40℃鼓风干燥箱烘干。根据X射线成像和珊瑚骨骼一年内形成一个高密度段和一个低密度段的特征确定时间序列(Knutson et al, 1972; 龙雅婷 等, 2022)。为了测定珊瑚中的P/Ca值, 沿珊瑚最大生长轴连续取样, 每个样品约10mg, 样品数量为416个。称取0.5~1mg粉状样品与100%H3PO4在75℃的自动碳酸盐装置中反应, 并将提取出来的CO2导入Finnigan MAT-253稳定同位素质谱仪, 采用GBW04405标准(δ18O=-8.49‰)标准化为V-PDB, 该标准的多次测量(n=15)得到δ18O的标准偏差为0.08%, 并用月分辨率δ18O对年龄框架进行交叉验证。然后称取3mg的珊瑚骨骼粉末到离心管中, 加入900μL内标(115In、187Re配置为100ppb)消除Ca的基体效应, 然后用2%HNO3溶解稀释约3000倍至6ppb。最后使用电感耦合等离子体质谱仪(ICP-MS)对获得的溶液进行P、Ca元素的测试。在ICP-MS测试前首先使用ICP分析专用标准溶液制作标准曲线, 测量中对所有样品进行三次测量, 每次测量结果的标准偏差普遍小于5%, 有效减小了测试结果的误差。
本文所用到的涠洲岛降雨量、风速数据来自美国国家海洋和大气管理局自然科学部(www.esrl.noaa.gov/psd/data/), 涠洲岛溢油事件来自广西海洋局环境公报, 海水TP含量来自韦蔓新 等(2013)和吴敏兰(2014)。

2 结果

2.1 年代学框架

密度带成像结果显示W3珊瑚生长时间跨度为1985—2015年, 拥有30年珊瑚骨骼同位素记录(Xu et al, 2018)(图2)。由于取样过程中, 沿着珊瑚最大生长轴均匀取12~15个样品, 所得数据不利于分析P干湿季的变化及季节特征, 因此利用δ18O最大值与温度周期最低值相对应的特点, 即涠洲岛一年中SST最低的1月份对应于δ18O最大值的月份, 对仪器测试数据进行12个月的插值处理, 处理后的数据以12个月均匀分布的形式呈现(图2)。
图2 W3珊瑚薄板和X射线照片及P/Ca值
Slab photograph, X-ray image, and P/Ca ratios of Porites coral from the W3 site, Weizhou Island 骨架内的年带状由高(暗)密度和低(亮)密度的周期表示, 黄线表示珊瑚的最大生长轴。

Fig. 2

2.2 P/Ca值测试结果

ICP-MS会检测骨骼内所有形式(有机、无机、可溶、不可溶)的P, 因此, 本研究中P/Ca值信号反映了有机相和无机相的结合。全球平均P/Ca值和溶解无机磷DIP的线性关系表明, 珊瑚P/Ca值对低于(4.9±1.4)μmol·mol-1的海水DIP不敏感, 且珊瑚骨骼P/Ca值的分析不确定度和异质性产生1.4μmol·mol-1的额外误差。因此, 珊瑚P/Ca值接近或小于6.3μmol·mol-1时, 不能精确反演海水DIP(Chen et al, 2019)。本研究中W3珊瑚P/Ca值在1985—2014年期间的范围为67.6~283.7μmol·mol-1, 平均值为152.3μmol·mol-1, 大大超过6.3μmol·mol-1, 可以作为海水P的可靠代表。残余珊瑚组织内有大量P有机物的存在, 导致2015年珊瑚P/Ca值偏离正常轨迹(Dodge et al, 1984a; Alibert et al, 2003; LaVigne et al, 2008), 位于较高的状态, 因此忽略对该数据的分析。
1985—2014年W3珊瑚的P/Ca值波动较大, 可以划分为三个时期, 分别是1985—1997、1998—2003和2004—2014年, 平均值分别为174.48、88.76和160.87μmol·mol-1, 分别称为前期、中期和后期。将一年内所有样品获取的P/Ca结果求平均可得到年平均P/Ca值, 三个时期的年平均P/Ca值的最大值分别位于1992、2001和2011年, 分别为213.29、138.11和283.69μmol·mol-1。前期年平均P/Ca值普遍较高, 从1992年开始出现一个下降的趋势, 在1997年有一个急剧的下降, 由179.51μmol·mol-1下降到87.05μmol·mol-1。中期为珊瑚P/Ca值低值期, P/Ca年平均值低至88.7μmol·mol-1, 除个别月份外, 大多数月份珊瑚P/Ca值都低于总体平均值。2003年后珊瑚P/Ca值开始升高, 由73.74μmol·mol-1上升到135.18μmol·mol-1。后期珊瑚P/Ca值缓慢增大, 2011年急剧上升, 出现最大值, 随后P/Ca值不断下降(图3)。
图3 W3珊瑚骨骼中基于珊瑚δ18O(V-PDB, ‰)构建的P/Ca值时间序列(1985—2014年)

Fig. 3 P/Ca time series based on coral δ18O (V-PDB, ‰) values in W3 coral skeletons over the period (1985-2014)

3 讨论

3.1 珊瑚P/Ca值代表海水P的变化

与其他珊瑚礁区相比, 涠洲岛W3珊瑚P/Ca值较高, 在其他已发表的研究范围之内(Montagna et al, 2006; Chen et al, 2011), 但显著高于公海和人类活动较少的海域中的珊瑚P/Ca值(Alibert et al, 2003; Chen et al, 2019)(表1)。Chen研究大亚湾珊瑚表明P/Ca值与海水TP具有较强的线性关系(P<0.001, r=0.9, n=16), 本文通过对该数据进行线性回归, 得到P/Ca-TP回归方程(Chen et al, 2011)。通过该方程推测海水TP含量, 绝大部分与涠洲岛实地采样所记录的海水TP含量相近, 随后将W3珊瑚P/Ca与海水实测数据与大亚湾数据进行相关性分析, 表明骨骼P/Ca值与TP之间存在较强的线性关系(P<0.001, r=0.969, n=22) (图4)。进一步证实了该线性关系的可靠性以及在涠洲岛等高营养盐通量的地区珊瑚P/Ca值可以作为海水P的直接代理。
表1 不同海域珊瑚P/Ca值对比

Tab. 1 P/Ca comparison from worldwide studies of scleractinian corals

海域 物种 P/Ca值/(μmol·mol-1) 数据来源
涠洲岛 Porites 93.37~283.58 本研究
地中海COBAS97a Desmophyllum dianthus 125.8~139.4 Montagna et al, 2006
西太平洋G16505 714.1~731.2
大亚湾 Porites sp. 38.6~190.8 Chen et al, 2011
巴拿马湾 Pavona gigantea 4.1~10.3 Chen et al, 2019
列斯库拉索岛 Montastrea 11.4~52.7
澳大利亚大堡礁 Porites 65.4 Alibert et al, 2003
图4 涠洲岛W3珊瑚与大亚湾珊瑚与海水TP的关系

黑色圆圈表示大亚湾珊瑚P/Ca值与海水TP, 蓝色星形表示涠洲岛W3珊瑚P/Ca值与海水实测TP, 绿色三角形表示涠洲岛W3珊瑚P/Ca值与由经验公式反演得到的海水TP

Fig. 4 Relationship between seawater TP and corals from Weizhou Island (W3) and Daya Bay

3.2 珊瑚骨骼P/Ca值与自然变量的关系

3.2.1 陆源输入

海洋中P来源主要有陆源输入、大气沉降、热液输送和火山喷发(图1), 以下将从这几方面探讨影响珊瑚骨骼P/Ca值变化的自然因素(Moore et al, 2000; Slomp et al, 2004; Paytan et al, 2006)。河流和地下水是将物质从陆地运输到海洋的主要渠道, 降雨增加的季节径流承载入海的物质通量也相应增加(Shiller et al, 1987; Deng et al, 2009)。W3珊瑚采样位置距离河流入海口较远, 最近的陆地为距离51.66 km的北海市(刘敬合 等, 1991), 且涠洲岛向海洋输送的河流少、流量小, 由涠洲岛河流输送入海的P含量小, 因此该海域海水P的径流输入较小。地下水是沿海海洋营养物质的重要和持续来源(Moore, 2010), 对珊瑚的丰度和多样性有潜在影响(Fabricius, 2005; Prouty et al, 2010)。一些沿海地区地下水陆源化合物含量高于河水(Slomp et al, 2004; Boehm et al, 2006; Santos et al, 2008)或者与河流流量相当(Burnett et al, 2003)。涠洲岛有丰富的地下水资源, 降雨是涠洲岛地下水资源的唯一天然来源(刘江宜 等, 2020)。W3珊瑚骨骼δ18O值和涠洲岛年降雨量与珊瑚P/Ca值相关性不显著(P=0.075, r=-0.330; P=0.988, r=0.003)(图3图5), 表明来自地下水输入的营养盐对海水P变化的影响较小。涠洲岛受海洋气团和极地大陆气团的交替影响, 根据月平均降雨量, 可以将5—10月划分为湿季, 11月至次年4月划分为干季(李嘉琪 等, 2018)。珊瑚骨骼P/Ca值干季的均值为146.4μmol·mol-1, 湿季P/Ca均值为158.1μmol·mol-1。珊瑚P/Ca值变化受到干湿季降雨的影响十分有限, 仅在1987—1991年, 湿季P/Ca值与降雨量呈正相关(P=0.001, r=0.989); 在1985—2015年, 干、湿季珊瑚P/Ca值与涠洲岛降雨量不相关(P=0.966, r=0.008; P=0.695, r=0.075)(图5)。进一步说明了W3珊瑚骨骼P/Ca值和海水P含量受到陆地径流以及地下水的影响较小。
图5 涠洲岛珊瑚骨骼P/Ca值和降雨量对比(1985—2014)

a. 珊瑚骨骼P/Ca值和年降雨量对比; b. 干季W3珊瑚骨骼P/Ca值和干季降雨量对比; c. 湿季W3珊瑚骨骼P/Ca值与湿季降雨量的变化

Fig. 5 Comparison of P/Ca of coral skeletons and annual rainfall in Weizhou Island (1985-2014)

3.2.2 大气沉降、热液输入和火山喷发

大气沉降是近海生态系统重要的营养来源, 且湿沉降是近海水体P的重要来源, 但大气湿沉降相对于其他因素(人为和自然)对P投入比例较低, 并且涠洲岛海域降雨量与珊瑚P/Ca值不相关, 因此大气沉降过程对该海域海水P的贡献较低(Lu et al, 2018)。在一个世纪以内, 涠洲岛附近没有火山喷发的记录(Li et al, 2018), 排除热液输入对海水P变化的影响。菲律宾吕宋岛的皮纳图博火山(120.35°E, 15.13°N)在1991年6月12日至15日爆发, 大量火山气溶胶被带入平流层(Hayashida et al, 1993), 同年底, 珊瑚骨骼P/Ca值逐渐升高, 在1992年达到前期(1985—1997年)的最高值(图3), 火山喷发通过大气远距离输送的影响时长较短, 经过一定时间的调整后逐渐恢复到正常海洋环境(魏浩天 等, 2020)。

3.2.3 海表风速

在东亚季风的控制下, 南海受到冬季干燥寒冷季风和夏季温暖潮湿季风的交替影响, 使得冬季风环流和夏季风降水均表现出较强的时空变异性(Deng et al, 2017; Gai et al, 2020)。南海夏季(6—8月)盛行西南风, 表层海水易在该海域形成反气旋环流, 同时在沿岸地区形成离岸上升流, 冬季盛行东北风, 最大风速较夏季小。春秋两季处于季风转换期, 风速较低(Yu et al, 2005)。季风会驱动海水的垂直混合和水平混合, 且垂直混合强于水平混合, 因此在季风盛行期间, 海洋底部的P会被带到海表, 表层海水中P含量大大增加(李敏, 2009; Lao et al, 2023)。本研究中, 春秋两季P/Ca值在1985—2000年以及2009—2013年与平均风速呈现出明显的正相关关系(P=0.05, r=0.498; P=0.037, r=0.900), 且这种现象在风速较高的夏冬季节更加明显, 其P/Ca值在1985—2010年与平均风速具有正相关的关系(P=0.037, r=0.410)(图6)。证实了该时段内季风是影响海水P含量变化的主导因素, 影响时间长且效果显著。尽管涠洲岛海域受到季风的主要影响, 但珊瑚P/Ca值季节性变化特征不明显, 因此还需考虑其他因素对海水P季节变化影响。热带气旋主要发生在湿季, 通过引起海水垂直混合将海水底部P带到海表(Walker et al, 2005; Gao et al, 2021), 从而影响海水表层P含量。本研究中, 1985—2007年, 珊瑚年平均P/Ca值与年平均最大风速以及湿季平均P/Ca值与湿季平均最大风速存在显著相关性(P=0.007, r=0.542; P=0.043, r=0.426), 说明热带气旋也是影响海水P含量的主要原因。
图6 W3珊瑚P/Ca值与风速的变化

a. 春秋季珊瑚P/Ca值与平均风速; b. 夏冬季珊瑚P/Ca值与平均风速; c.珊瑚年平均P/Ca值与年平均最大风速; d. 珊瑚湿季平均P/Ca值与湿季平均最大风速。阴影部分表示二者相关性显著

Fig. 6 Changes in P/Ca of W3 corals and wind speed. The shaded part is the range for which the P/Ca of W3 corals is significantly correlated with the wind speed

为了进一步判断海表风速对海水P的影响, 我们将研究自然状态(1998—2003年)海表风速对珊瑚骨骼P/Ca值变化的影响, 该时段涠洲岛人为活动少, 可以忽略人为因素对海水P的影响。该时间段内珊瑚骨骼P/Ca值较低, 平均值为88.87μmol·mol-1, 低于总体平均值。且除个别月份外, 大多数月份珊瑚P/Ca值都低于总体平均值。值得注意的是, 2001年6—9月珊瑚P/Ca值异常高, 变化幅度非常大。4月该比值较低, 仅为64.7μmol·mol-1, 但从4月份开始, 该比值开始大幅度上升, 幅值约为80.0μmol·mol-1, 同年7月份, 已经达到285.48μmol·mol-1(图3)。根据中央气象台台风网, 2001年7月2日, 0103号台风“榴莲”经过涠洲岛海域; 同年, 7月7日, 0104号台风“尤特”经过涠洲岛海域; 7月26日, 0107号台风“玉兔”吹过北部湾涠洲岛海域; 8月11日, 0110号热带风暴“天兔”经过研究区域; 8月31日, 0114号热带风暴“菲特”经过研究海域; 9月21日, 0116号热带低压“百合”经过研究区域。台风会推动海水的水平运动, 以及加强水体的垂直混合, 因此在台风盛行期间, 台风影响区域的海水会产生强烈的混合。综上所述, 在自然状态下, 影响研究海域珊瑚骨骼P/Ca值变化的主导因素是海表风。

3.3 珊瑚骨骼P/Ca值与人类活动的关系

旅游业发展会极大地影响海水P含量变化。人类活动影响较强烈的海洋面积约占全球海洋面积的41%(Halpern et al, 2008), 为了减轻环境污染和避免生态破坏, 1989年12月26日, 会议通过了《中华人民共和国环境保护法》。根据P/Ca值时间序列, 1994年后珊瑚P/Ca值呈现出明显下降趋势, 并在1998—2003年期间处于低值状态, 年平均值为88.7μmol·mol-1。这六年的珊瑚P/Ca年平均值都处于总体年平均P/Ca值水平以下, 这与环境保护方法的实施是密不可分的(图3)。
随着经济发展和旅游资源不断开发, 涠洲岛吸引了越来越多游客的参观。2004年, 涠洲岛游客为9万人/年, 到2014年, 上岛游客已经增加到59.3万人/年(王文欢 等, 2016)。2004年到2014年涠洲岛上游客人数增长率为5.03万人/年, 污染物对附近海域也造成了明显的影响(郭芳, 2015)。值得注意的是, 2004—2012年, W3珊瑚P/Ca值与涠洲岛每年的游客人数具有显著的正相关性(P=0.03, r=0.855)(图7)。与此同时, 根据海水实测数据, 从2007年到2011年涠洲岛海域海水TP含量不断增加, 从0.013mg·L-1增加到0.058mg·L-1(韦蔓新 等, 2013; 吴敏兰, 2014)。以上研究都表明人类活动是引起周围海域海水P变化的重要原因之一。
图7 珊瑚骨骼P/Ca值(1985—2014)与游客人数(2004—2014)变化(Moore et al, 2000)

Fig. 7 Changes in P/Ca of coral skeletons (1985-2014) and number of tourists (2004-2014) (Moore et al, 2000)

石油是一种生物来源的天然产物, 富含碳、氢、磷等元素, 石油泄漏的海域海水磷含量较正常海水磷含量高(Medina-Bellver et al, 2005; 刘慧杰 等, 2012)。W3珊瑚P/Ca值在2007、2009、2010和2011年(分别为116.3、131.4、197.5和219.8μmol·mol-1)都比相邻年份的P/Ca值高, 与涠洲岛海域发生石油污染的时间相对应(图7)。2006年7月, 北海发生了严重的溢油事故, 污染物主要为黑色块状油污(陈圆 等, 2013), 受到石油泄漏事故的影响, 珊瑚岩芯P/Ca值大约增加了24.6μmol·mol-1。2008年, 涠洲岛西南部海域发生了4次溢油事故, 污染物主要为黑色油块, 黏性较强, 其中污染最严重的溢油事故发生于8月份, 总溢油量高达750吨, 将近129.96km2的海域面积都遭受了污染(李君光, 2009), 与此对应的是, 2008年珊瑚骨骼P/Ca值增加了49.23μmol·mol-1。2009年, 一艘拖网渔船在北海码头沉没并出现溢油现象。2011年8月5日, 涠洲镇也发生了一次石油溢油事故, 在西北方向距岸边约5km处出现大量漂浮油污(陈圆 等, 2013), 受到油污中有机物的影响, 2011年W3珊瑚岩芯P/Ca值增加了97.51μmol·mol-1, 增加幅度较大。由于珊瑚钙化过程由多种机制参与进行, 最初钙化集中在表面, 随后经过缓慢的沉积逐渐增厚, 可能相对环境有一定的滞后性(Barnes et al, 1993; Taylor et al, 1995), 因此珊瑚P/Ca值出现峰值的时间滞后于溢油事故的时间。综上所述, 旅游业的发展和石油泄漏对海水P变化的相对影响较大。

4 结论

本次研究利用涠洲岛1985—2014年高分辨率珊瑚骨架的地球化学数据(P/Ca值、δ18O等), 描述了珊瑚骨骼P/Ca值的变化和1985—2014年浅海珊瑚礁区海水P变化的影响因素, 主要研究结果如下。
1) W3珊瑚骨骼P/Ca值作为海水表层P含量变化的有效代用指标, 能够可靠反演1985—2014年涠洲岛海域P含量变化, 涠洲岛海域海水P含量变化受陆源输入和大气沉降的影响较小, 可忽略不计。
2) 环境保护法的落实有利于缓解涠洲岛海域海水的污染程度。随着经济的发展, 游客人数增加和海上工程造成的溢油事故都是造成涠洲岛海域海水P含量增加的重要原因, 如果不加强对该海域的管理, 未来海水中的P可能会成为威胁珊瑚礁生存的重要因子。
3) 春秋季和秋冬季珊瑚P/Ca值与平均风速具有显著的相关性, 该海域海水P含量的变化受季风的强烈影响。台风盛行期间, 珊瑚P/Ca值也相应升高。因此海表风是影响海水P含量变化的主控因素, 而火山爆发、石油泄露以及旅游业的发展都是造成P含量短暂性升高的主要因素。
[1]
陈圆, 青尚敏, 2013. 广西北部湾海洋油污染影响与应急管理浅析[J]. 海洋开发与管理, 30(3): 104-108 (in Chinese).

[2]
郭芳, 2015. 广西涠洲岛是如何成为“违建岛”的[J]. 中国经济周刊, (43): 34-37 (in Chinese).

[3]
何本茂, 黎广钊, 韦蔓新, 等, 2013. 涠洲岛珊瑚礁海域氮磷比值季节变化与浮游生物结构的关系[J]. 热带海洋学报, 32(4): 64-72.

DOI

HE BENMAO, LI GUANGZHAO, WEI MANXIN, et al, 2013. Relationship between the seasonality of seawater N: P ratio and the structure of plankton on the reefs of Weizhou Island, northern South China Sea[J]. Journal of Tropical Oceanography, 32(4): 64-72 (in Chinese with English abstract).

[4]
况雪源, 苏志, 涂方旭, 2007. 广西气候区划[J]. 广西科学, 14(3): 278-283.

KUANG XUEYUAN, SU ZHI, TU FANGXU, 2007. Climate regionalization of Guangxi[J]. Guangxi Sciences, 14(3): 278-283 (in Chinese with English abstract).

[5]
李嘉琪, 白爱娟, 蔡亲波, 2018. 西沙群岛和涠洲岛气候变化特征及其与近岸陆地的对比[J]. 热带地理, 38(1): 72-81.

DOI

LI JIAQI, BAI AIJUAN, CAI QINBO, 2018. Climate change characteristics of the Xisha Islands and Weizhou Island in China and the comparison with the coastal land[J]. Tropical Geography, 38(1): 72-81 (in Chinese with English abstract).

[6]
李君光,2009-06-08(001). 环境状况有喜有忧[N]. 北海日报 (in Chinese).

[7]
李敏, 2009. 南海海洋叶绿素α时空分布及对季风变动响应的研究[D]. 北京: 中国气象科学研究院.

LI MIN, 2009. A study on the spatial and temporal Chl-α distribution in the South China Sea and a response to the South China Sea monsoon[D]. Beijing: Chinese Academy of Meteorological Sciences (in Chinese with English abstract).

[8]
刘慧杰, 张虎山, 2012. 海洋石油污染及治理措施[J]. 广州环境科学, 27(4): 35-38.

LIU HUIJIE, ZHANG HUSHAN, 2012. Marine petroleum pollution and treatment measures[J]. Guangzhou Environmental Science, 27(4): 35-38 (in Chinese with English abstract).

[9]
刘江宜, 窦世权, 牟德刚, 2020. 海岛资源环境承载能力评价研究——以广西涠洲岛为例[J]. 中国渔业经济, 38(6): 109-120.

LIU JIANGYI, DOU SHIQUAN, MOU DEGANG, 2020. Study on evaluation of resources and environment carrying capacity of islands: a case of Weizhou Island in Guangxi[J]. Chinese Fisheries Economics, 38(6): 109-120 (in Chinese with English abstract).

[10]
刘敬合, 黎广钊, 农华琼, 1991. 涠洲岛地貌与第四纪地质特征[J]. 广西科学院学报, 7(1): 27-36.

LIU JINGHE, LI GUANGZHAO, NONG HUAQIONG, 1991. Features of geomorphy and quaternary geology of the Weizhou Island[J]. Journal of Guangxi Academy of Sciences, 7(1): 27-36 (in Chinese with English abstract).

[11]
龙雅婷, 余克服, 王瑞, 等, 2022. 涠洲岛珊瑚礁的发育过程及其与气候的对应关系[J]. 海洋地质与第四纪地质, 42(1): 184-193.

LONG YATING, YU KEFU, WANG RUI, et al, 2022. Development of coral reefs around Weizhou Island and its bearing on climate[J]. Marine Geology & Quaternary Geology, 42(1): 184-193 (in Chinese with English abstract).

[12]
王文欢, 余克服, 王英辉, 2016. 北部湾涠洲岛珊瑚礁的研究历史、现状与特色[J]. 热带地理, 36(1): 72-79.

DOI

WANG WENHUAN, YU KEFU, WANG YINGHUI, 2016. A review on the research of coral reefs in the Weizhou Island, beibu gulf[J]. Tropical Geography, 36(1): 72-79 (in Chinese with English abstract).

DOI

[13]
魏浩天, 刘刚, 韩孝辉, 等, 2020. 珊瑚礁对热液流体的地球化学记录——来自南海西沙永兴岛珊瑚礁稀土元素的证据[J]. 海洋地质与第四纪地质, 40(4): 78-95.

WEI HAOTIAN, LIU GANG, HAN XIAOHUI, et al, 2020. Geochemical records of hydrothermal fluids in corals: Evidence of rare earth elements from coral reefs in the Yongxing Island, Xisha, South China Sea[J]. Marine Geology & Quaternary Geology, 40(4): 78-95 (in Chinese with English abstract).

[14]
韦蔓新, 黎广钊, 何本茂, 等, 2013. 涠洲岛珊瑚礁生态区各种形态磷含量的季节变化及其影响因素[J]. 应用海洋学学报, 32(2): 258-265.

WEI MANXIN, LI GUANGZHAO, HE BENMAO, et al, 2013. Seasonal variation of different forms of phosphorus and the influential factors in coral reef ecoregion of Weizhou Island[J]. Journal of Applied Oceanography, 32(2): 258-265 (in Chinese with English abstract).

[15]
吴敏兰, 2014. 北部湾北部海域营养盐的分布特征及其对生态系统的影响研究[D]. 厦门: 厦门大学.

WU MINLAN, 2014. The distribution feature of nutrients and the study of their influence on ecosystem in the northern Beibu Gulf[D]. Xiamen: Xiamen University (in Chinese with English abstract).

[16]
周强, 姜允斌, 郝记华, 等, 2021. 磷的生物地球化学循环研究进展[J]. 高校地质学报, 27(2): 183-199.

ZHOU QIANG, JIANG YUNBIN, HAO JIHUA, et al, 2021. Advances in the study of biogeochemical cycles of phosphorus[J]. Geological Journal of China Universities, 27(2): 183-199 (in Chinese with English abstract).

DOI

[17]
ALIBERT C, KINSLEY L, FALLON S J, et al, 2003. Source of trace element variability in great barrier reef corals affected by the Burdekin flood plumes[J]. Geochimica et Cosmochimica Acta, 67(2): 231-246.

[18]
BARNES D J, LOUGH J M, 1993. On the nature and causes of density banding in massive coral skeletons[J]. Journal of Experimental Marine Biology and Ecology, 167(1): 91-108.

[19]
BENITEZ-NELSON C R, BUESSELER K O, 1999. Variability of inorganic and organic phosphorus turnover rates in the coastal ocean[J]. Nature, 398(6727): 502-505.

[20]
BENITEZ-NELSON C R, 2000. The biogeochemical cycling of phosphorus in marine systems[J]. Earth-Science Reviews, 51(1-4): 109-135.

[21]
BOEHM A B, PAYTAN A, SHELLENBARGER G G, et al, 2006. Composition and flux of groundwater from a California beach aquifer: Implications for nutrient supply to the surf zone[J]. Continental Shelf Research, 26(2): 269-282.

[22]
BURNETT W C, BOKUNIEWICZ H, HUETTEL M, et al, 2003. Groundwater and pore water inputs to the coastal zone[J]. Biogeochemistry, 66(1-2): 3-33.

[23]
CHEN MENGLI, MARTIN P, GOODKIN N F, et al, 2019. An assessment of P speciation and P:Ca proxy calibration in coral cores from Singapore and Bali[J]. Geochimica et Cosmochimica Acta, 267: 113-123.

[24]
CHEN TIANRAN, YU KEFU, SHI QI, et al, 2009. Twenty-five years of change in scleractinian coral communities of Daya Bay (northern South China Sea) and its response to the 2008 AD extreme cold climate event[J]. Chinese Science Bulletin, 54( 12): 2107-2117.

[25]
CHEN TIANRAN, YU KEFU, 2011. P/Ca in coral skeleton as a geochemical proxy for seawater phosphorus variation in Daya Bay, northern South China Sea[J]. Marine Pollution Bulletin, 62(10): 2114-2121.

DOI PMID

[26]
CLOERN J E, 2001. Our evolving conceptual model of the coastal eutrophication problem[J]. Marine Ecology Progress Series, 210: 223-253.

[27]
DELANEY M L, 1998. Phosphorus accumulation in marine sediments and the oceanic phosphorus cycle[J]. Global Biogeochemical Cycles, 12(4): 563-572.

[28]
DENG SHULIN, LI MANCHUN, SUN HAN, et al, 2017. Exploring temporal and spatial variability of precipitation of Weizhou Island, South China Sea[J]. Journal of Hydrology: Regional Studies, 9: 183-198.

[29]
DENG WENFENG, WEI GANGJIAN, LI XIANHUA, et al, 2009. Paleoprecipitation record from coral Sr/Ca and δ18O during the mid Holocene in the northern South China Sea[J]. The Holocene, 19(6): 811-821.

[30]
DODGE R E, GILBERT T R, 1984a. Chronology of lead pollution contained in banded coral skeletons[J]. Marine Biology, 82(1): 9-13.

[31]
DODGE R E, JICKELLS T D, KNAP A H, et al, 1984b. Reef-building coral skeletons as chemical pollution (phosphorus) indicators[J]. Marine Pollution Bulletin, 15(5): 178-187.

[32]
FABRICIUS K E, 2005. Effects of terrestrial runoff on the ecology of corals and coral reefs: review and synthesis[J]. Marine Pollution Bulletin, 50(2): 125-146.

DOI PMID

[33]
GAI CONGCONG, LIU QINGSONG, ROBERTS A P, et al, 2020. East Asian monsoon evolution since the late Miocene from the South China Sea[J]. Earth and Planetary Science Letters, 530: 115960.

[34]
GAO XIAOFEI, CHEN HUIHUANG, GU BINHE, et al, 2021. Particulate organic matter as causative factor to eutrophication of subtropical deep freshwater: role of typhoon (tropical cyclone) in the nutrient cycling[J]. Water Research, 188: 116470.

[35]
GLIBERT P M, HARRISON J, HEIL C, et al, 2006. Escalating worldwide use of urea: a global change contributing to coastal eutrophication[J]. Biogeochemistry, 77(3): 441-463.

[36]
HALPERN B S, WALBRIDGE S, SELKOE K A, et al, 2008. A global map of human impact on marine ecosystems[J]. Science, 319(5865): 948-952.

DOI PMID

[37]
HAYASHIDA S, SASANO Y, 1993. Stratospheric aerosol change in the early stage of volcanic disturbance by the Pinatubo eruption observed over Tsukuba, Japan[J]. Geophysical Research Letters, 20(7): 575-578.

[38]
HOPPE H G, 2003. Phosphatase activity in the sea[J]. Hydrobiologia, 493(1-3): 187-200.

[39]
KNUTSON D W, BUDDEMEIER R W, SMITH S V, 1972. Coral chronometers: seasonal growth bands in reef corals[J]. Science, 177(4045): 270-272.

PMID

[40]
KOLOWITH L C, INGALL E D, BENNER R, 2001. Composition and cycling of marine organic phosphorus[J]. Limnology and Oceanography, 46(2): 309-320.

[41]
LAO QIBIN, LU XUAN, CHEN FAJIN, et al, 2023. A comparative study on source of water masses and nutrient supply in Zhanjiang Bay during the normal summer, rainstorm, and typhoon periods: insights from dual water isotopes[J]. Science of the Total Environment, 903: 166853.

[42]
LAVIGNE M, FIELD M P, ANAGNOSTOU E, et al, 2008. Skeletal P/Ca tracks upwelling in Gulf of Panama coral: evidence for a new seawater phosphate proxy[J]. Geophysical Research Letters, 35(5): L05604.

[43]
LAVIGNE M, MATTHEWS K A, GROTTOLI A G, et al, 2010. Coral skeleton P/Ca proxy for seawater phosphate: multi-colony calibration with a contemporaneous seawater phosphate record[J]. Geochimica et Cosmochimica Acta, 74(4): 1282-1293.

[44]
LI FUCHENG, SUN ZHEN, YANG HONGFENG, 2018. Possible spatial distribution of the Mesozoic volcanic arc in the present‐day South China Sea continental margin and its tectonic implications[J]. Journal of Geophysical Research: Solid Earth, 123(8): 6215-6235.

[45]
LOUGH J M, 2004. A strategy to improve the contribution of coral data to high-resolution paleoclimatology[J]. Palaeogeography, Palaeoclimatology, Palaeoecology, 204(1-2): 115-143.

[46]
LU HELI, ZHANG CHUANRONG, LIU GUIFANG, et al, 2018. Mapping China’s ghost cities through the combination of nighttime satellite data and daytime satellite data[J]. Remote Sensing, 10(7): 1037.

[47]
MALLELA J, LEWIS S E, CROKE B, 2013. Coral skeletons provide historical evidence of phosphorus runoff on the Great Barrier Reef[J]. PLoS One, 8(9): e75663.

[48]
MCCOOK L J, 1999. Macroalgae, nutrients and phase shifts on coral reefs: scientific issues and management consequences for the Great Barrier Reef[J]. Coral Reefs, 18(4): 357-367.

[49]
MEDINA-BELLVER J I, MARÍN P, DELGADO A, et al, 2005. Evidence for in situ crude oil biodegradation after the Prestige oil spill[J]. Environmental Microbiology, 7(6): 773-779.

[50]
MONTAGNA P, MCCULLOCH M, TAVIANI M, et al, 2006. Phosphorus in cold-water corals as a proxy for seawater nutrient chemistry[J]. Science, 312(5781): 1788-1791.

PMID

[51]
MOORE J K, ABBOTT M R, RICHMAN J G, et al, 2000. The Southern Ocean at the last glacial maximum: a strong sink for atmospheric carbon dioxide[J]. Global Biogeochemical Cycles, 14(1): 455-475.

[52]
MOORE W S, 2010. The effect of submarine groundwater discharge on the ocean[J]. Annual Review of Marine Science, 2: 59-88.

PMID

[53]
PAYTAN A, SHELLENBARGER G G, STREET J H, et al, 2006. Submarine groundwater discharge: an important source of new inorganic nitrogen to coral reef ecosystems[J]. Limnology and Oceanography, 51(1): 343-348.

[54]
PAYTAN A, MCLAUGHLIN K, 2007. The oceanic phosphorus cycle[J]. Chemical Reviews, 107(2): 563-576.

PMID

[55]
PROUTY N G, FIELD M E, STOCK J D, et al, 2010. Coral Ba/Ca records of sediment input to the fringing reef of the southshore of Moloka’i, Hawai’i over the last several decades[J]. Marine Pollution Bulletin, 60(10): 1822-1835.

[56]
SANTOS I R, NIENCHESKI F, BURNETT W, et al, 2008. Tracing anthropogenically driven groundwater discharge into a coastal lagoon from southern Brazil[J]. Journal of Hydrology, 353(3-4): 275-293.

[57]
SHILLER A M, BOYLE E A, 1987. Dissolved vanadium in rivers and estuaries[J]. Earth and Planetary Science Letters, 86(2-4): 214-224.

[58]
SLOMP C P, VAN CAPPELLEN P, 2004. Nutrient inputs to the coastal ocean through submarine groundwater discharge: controls and potential impact[J]. Journal of Hydrology, 295(1-4): 64-86.

[59]
TAYLOR R B, BARNES D J, LOUGH J M, 1995. On the inclusion of trace materials into massive coral skeletons. 1. Materials occurring in the environment in short pulses[J]. Journal of Experimental Marine Biology and Ecology, 185(2): 255-278.

[60]
WALKER N D, LEBEN R R, BALASUBRAMANIAN S, 2005. Hurricane‐forced upwelling and chlorophyll a enhancement within cold‐core cyclones in the Gulf of Mexico[J]. Geophysical Research Letters, 32(18): L18610.

[61]
WANG BAODONG, XIN MING, WEI QINSHENG, et al, 2018. A historical overview of coastal eutrophication in the China Seas[J]. Marine Pollution Bulletin, 136: 394-400.

DOI PMID

[62]
XU SHENDONG, YU KEFU, WANG YINGHUI, et al, 2018. Oil spill recorded by skeletal δ13C of Porites corals in Weizhou Island, Beibu Gulf, northern South China Sea[J]. Estuarine, Coastal and Shelf Science, 207: 338-344.

[63]
YU KEFU, CHEN TEGU, HUANG DINGCHENG, et al, 2001. The high-resolution climate recorded in the δ18O of Porites lutea from the Nansha Islands of China[J]. Chinese Science Bulletin, 46(24): 2097-2102.

[64]
YU KEFU, ZHAO JIANXIN, WEI GANGJIAN, et al, 2005. Mid-late Holocene monsoon climate retrieved from seasonal Sr/Ca and δ18O records of Porites lutea corals at Leizhou Peninsula, northern coast of South China Sea[J]. Global and Planetary Change, 47(2-4): 301-316.

[65]
YU KEFU, 2012. Coral reefs in the South China Sea: their response to and records on past environmental changes[J]. Science China Earth Sciences, 55(8): 1217-1229.

Outlines

/