
Journal of Tropical Oceanography >
Study on the influence of steering flows on the track of Hurricane Paulette (2020)
Editor: YIN Bo
Received date: 2025-05-28
Revised date: 2025-07-28
Online published: 2025-08-19
Supported by
Natural Science Foundation of Anhui Province(2308085QD129)
Natural Science Foundation of Anhui Province(2408085MD102)
Joint Open Project of Anhui Province Key Laboratory of Physical Geographic Environment(2023PGE05)
Outstanding Youth Science Fund for Universities in Anhui Province(2022AH020093)
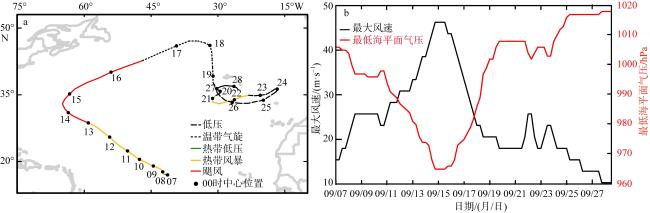
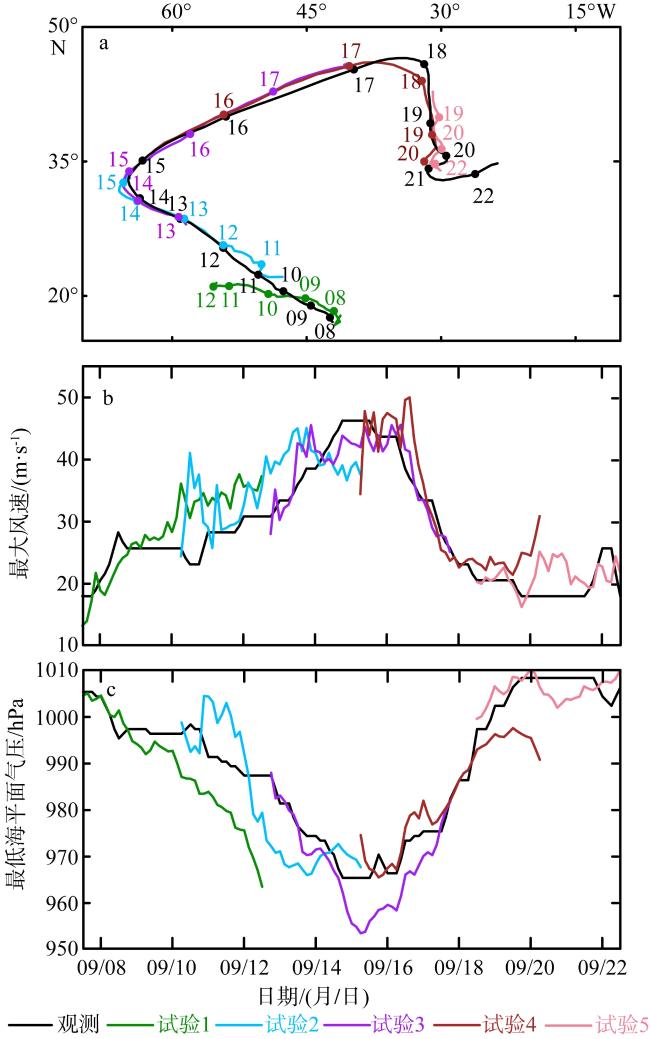
Hurricane Paulette (2020) underwent two critical track shifts over the North Atlantic: first, a turn from northwestward movement toward North America to northeastward movement, followed by extratropical transition; second, a shift from a northeastward track to a southward track, subsequently regenerating into a tropical storm. To investigate the influence of multi-level steering flows and surrounding circulation systems on these two turning processes, numerical simulations of Paulette were conducted using the Weather Research and Forecasting (WRF) model. The results show that: 1) The regeneration of Paulette was closely associated with its anomalous southward turning, during which it moved into a region of warm sea surface temperature, acquiring favorable conditions for redevelopment. 2) During the movement of Paulette, the steering flow exhibited significant vertical variation and evolution. The northwestward movement was primarily governed by low- to mid-level steering flows, while upper-level steering flows became more dominant during the northeastward turn and northeastward movement. During the southward-turning stage, low-level steering flows shifted from westerlies to northerlies, gradually extending upward to the upper levels and forming a deep northerly flow, ultimately leading to an abnormal southward turning of the hurricane's track. 3) In its early developmental stage, Paulette was located to the southern periphery of the subtropical high and moved northwestward under its blocking influence. As the hurricane intensified, the subtropical high weakened and broke, allowing Paulette to move northward into a mid-latitude westerly trough and turn northeastward under the influence of southwesterly flow ahead of the trough. However, as the high-pressure ridge to the south of Paulette continued to strengthen with a significant increase in meridional extent, the hurricane ultimately turned southward ahead of the ridge.
SHOU Zehui , LIU Qiao , HU Feng , WANG Gen . Study on the influence of steering flows on the track of Hurricane Paulette (2020)[J]. Journal of Tropical Oceanography, 2026 , 45(2) : 71 -80 . DOI: 10.11978/2025070
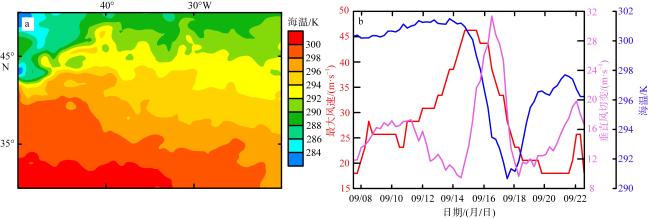
图2 9月21日00时海温场(a)和飓风“保莱特”00时中心最大风速、区域平均海温和垂直风切变时序变化图(b)Fig. 2 Sea surface temperature field at 00:00 UTC on 21 September (a) and time series of the maximum central wind speed at the center of Hurricane Paulette, regional average sea surface temperature, and vertical wind shear at 00:00 UTC (b) |
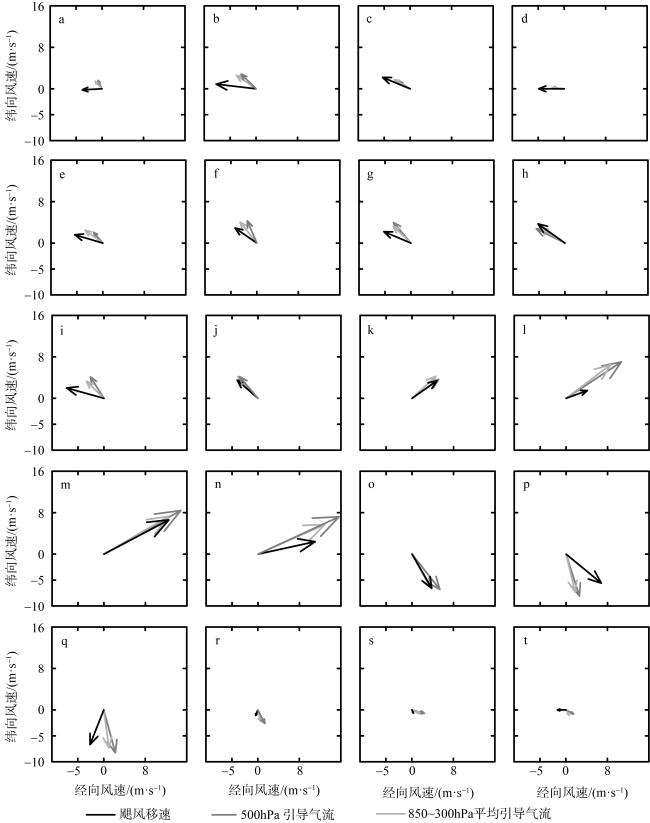
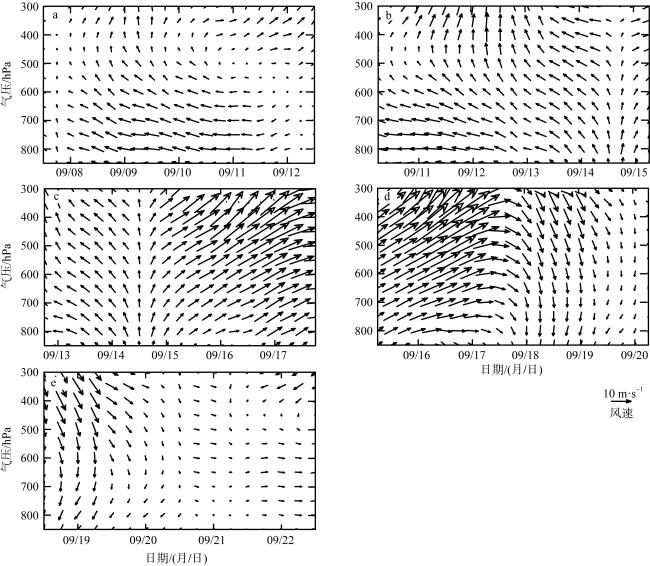
图4 WRF试验中引导气流与飓风移速的对比a. 08日00时; b. 09日00时; c. 10日00时; d. 11日00时; e. 11日00时; f. 12日00时; g. 13日00时; h. 14日00时; i. 13日00时; j. 14日00时; k. 15日00时; l. 16日00时; m. 16日00时; n. 17日00时; o. 18日00时; p. 19日00时; q. 19日00时; r. 20日00时; s. 21日00时; t. 22日00时。a—d为试验1; e—h为试验2; i—l为试验3; m—p为试验4; q—t为试验5 Fig. 4 Comparison of steering flows and hurricane moving speeds in the WRF experiments |
图5 WRF试验中850~300hPa间不同层次引导气流分量(单位: m∙s-1)演变a. 试验1; b. 试验2; c. 试验3; d. 试验4; e. 试验5 Fig. 5 Evolution of the components of steering flows (units: m∙s-¹) at different levels between 850 and 300 hPa in the WRF experiments. (a) experiment 1; (b) experiment 2; (c) experiment 3; (d) experiment 4; (e) experiment 5 |
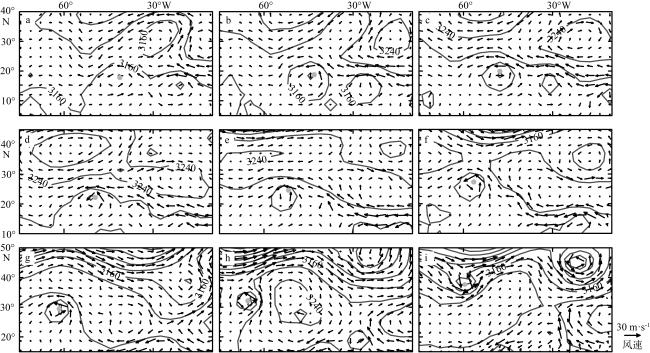
图6 WRF试验中700hPa位势高度场(单位: gpm)及风场(单位: m∙s-1)a. 07日12时; b. 08日12时; c. 09日12时; d. 10日12时; e.11日12时; f. 12日12时; g. 13日12时; h. 14日12时; i. 15日12时。图中曲线为等高线; 灰色圆点为飓风“保莱特”中心位置 Fig. 6 The 700 hPa geopotential height (units: gpm) and wind (units: m∙s-1) fields in the WRF experiments. (a) 12:00 UTC 07; (b) 12:00 UTC 08; (c) 12:00 UTC 09; (d) 12:00 UTC 10; (e) 12:00 UTC 11; (f) 12:00 UTC 12; (g) 12:00 UTC 13; (h) 12:00 UTC 14; (i) 12:00 UTC 15. The curves represent the geopotential height contours; the gray dots indicate the center positions of Hurricane Paulette |
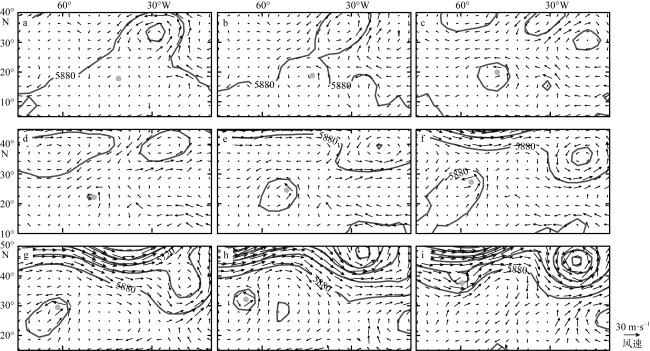
图7 WRF试验中500hPa位势高度场(单位: gpm)及风场(单位: m∙s-1)a. 07日12时; b. 08日12时; c. 09日12时; d. 10日12时; e. 11日12时; f. 12日12时; g. 13日12时; h. 14日12时; i. 15日12时。图中曲线为等高线; 灰色圆点为飓风“保莱特”中心位置 Fig. 7 The 500 hPa geopotential height (units: gpm) and wind (units: m∙s-1) fields in the WRF experiments. (a) 12:00 UTC 07; (b) 12:00 UTC 08; (c) 12:00 UTC 09; (d) 12:00 UTC 10; (e) 12:00 UTC 11; (f) 12:00 UTC 12; (g) 12:00 UTC 13; (h) 12:00 UTC 14; (i) 12:00 UTC 15. The curves represent the geopotential height contours; the gray dots indicate the center positions of Hurricane Paulette |
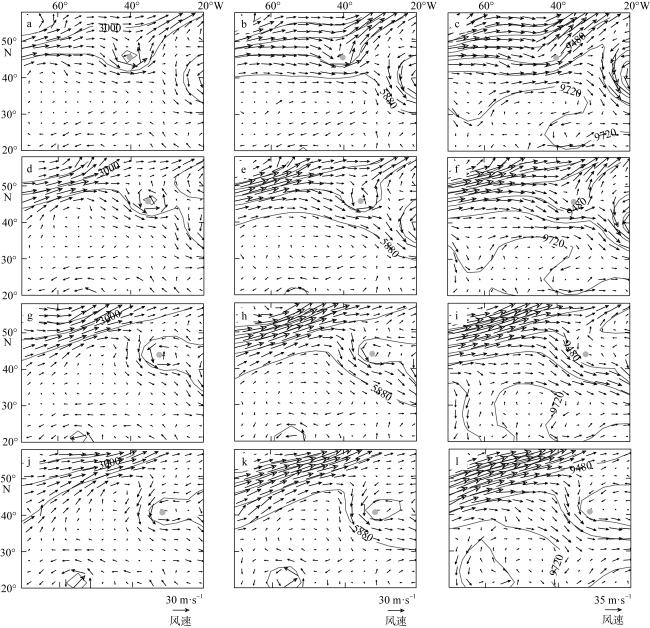
图8 试验4中不同时次700hPa (a、d、g、j)、500hPa (b、e、h、k)和300hPa (c、f、i、l)位势高度场(单位: gpm)及风场(单位: m∙s-1)a. 17日00时; b. 17日00时; c. 17日00时; d. 17日12时; e. 17日12时; f. 17日12时; g. 18日00时; h. 18日00时; i. 18日00时; j. 18日12时; k. 18日12时; l. 18日12时。图中曲线为等高线; 灰色圆点为飓风“保莱特”中心位置 Fig. 8 The geopotential height (units: gpm) and wind (units: m∙s-1) fields at 700 hPa (a, d, g, j), 500 hPa (b, e, h, k), and 300 hPa (c, f, i, l) at different times in Experiment 4. (a) 12:00 UTC 17; (b) 00:00 UTC 17; (c) 00:00 UTC 17; (d) 12:00 UTC 17; (e) 12:00 UTC 17; (f) 12:00 UTC 17; (g) 00:00 UTC 18; (h) 00:00 UTC 18; (i) 00:00 UTC 18; (j) 12:00 UTC 18; (k) 12:00 UTC 18; (l) 12:00 UTC 18. The curves represent the geopotential height contours; the gray dots indicate the center positions of Hurricane Paulette |
| [1] |
韩峰, 储可宽, 谈哲敏, 等, 2019. 双台风 “玛娃(2005)” 和 “古超(2005)” 移动路径与强度的伴随敏感性分析[J]. 地球物理学报, 62(9): 3247-3258.
|
| [2] |
|
| [3] |
|
| [4] |
|
| [5] |
|
| [6] |
|
| [7] |
|
| [8] |
|
| [9] |
|
| [10] |
|
| [11] |
|
| [12] |
|
| [13] |
|
| [14] |
|
| [15] |
|
| [16] |
|
| [17] |
|
| [18] |
|
| [19] |
|
| [20] |
|
| [21] |
|
| [22] |
|
| [23] |
|
| [24] |
|
| [25] |
|
| [26] |
|
| [27] |
|
| [28] |
|
| [29] |
|
| [30] |
|
| [31] |
|
| [32] |
|
/
| 〈 |
|
〉 |
