
Journal of Tropical Oceanography >
Experimental study on changes of cross-shore beach profile by regular waves under the influence of mangroves
Received date: 2016-01-28
Request revised date: 2016-06-30
Online published: 2017-01-19
Supported by
Key Projects of National Natural Science Foundation of China (51239001)
National Natural Science Foundation of China (51409022)
Scientific Research Fund of Hunan Provincial Education Department (13B130, YB2015B034)
Program for Key Laboratory of Water Science and Engineering of Ministry of Water Resources (YK914013)
Program for Ministry of Transport Key Laboratory of Port, Waterway and Sedimentation Engineering
Graduate Student Research Innovation Project of Hunan Province (CX2015B360)
Application Basic Research Project of Ministry of Transport (2015319825080)
Copyright
Mangroves are widely distributed in the coastal areas of South China, which can effectively reduce the damage by waves to the beach; therefore, it is significant to study the effect of the changes on the beach profile under the influence of regular waves. Based on the wave flume experiment, the PVC tubes are generally chosen to simulate mangroves, and cohesionless sand is selected to generate the beach whose combination slope is 1/10~1/20. The results of the experiment show that when there are mangroves, it has a large influence on the beach slope change under the action of regular waves; and the steepness of regular waves, as well as the distribution density and the arrangement of mangroves, are analyzed. Based on the experimental data, the relationships among the beach erosion scale, deposition scale, the maximum scour depth, the maximum deposition height, and the steepness of regular waves, the distribution density, the arrangement of the mangroves are established, whose relationship is an exponential function. The function reveals the relationship between the variation of beach profile and the hydrodynamic characteristics of regular waves, mangroves, the sediment particles, and the beach slope. With the introduction of the comprehensive coefficient of the plants, the characteristic value of beach erosion and deposition under a given regular wave is predicted, which provides a scientific basis for the construction of coastal protection engineering.
JIANG Changbo , GUAN Zhe , CHEN Jie , XIAO Yu , GAO Qingyang , CUI Yiqiu , CAO Cheng . Experimental study on changes of cross-shore beach profile by regular waves under the influence of mangroves[J]. Journal of Tropical Oceanography, 2017 , 36(1) : 95 -105 . DOI: 10.11978/2016013
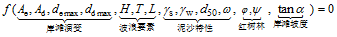 (3)
(3)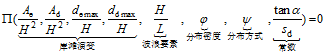 (4)
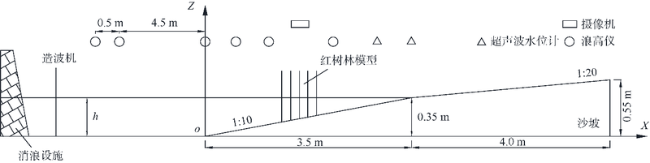
(4)Fig. 1 Experimental setup图1 实验布置图 |
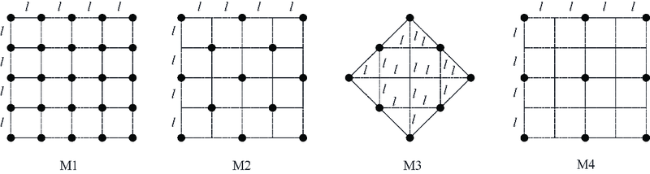
Fig. 2 Design of different models of mangroves图2 植物模型的设计方案 |
Tab. 1 Description of models表1 模型方案说明 |
| 模型 | 植物排列方式 | a、b取值(l=2.5cm) | 植物平均间距/cm | 植物分布密度φ | 植物排列系数 |
|---|---|---|---|---|---|
| M1 | 矩形排列方式 | (a=b=l) | 2.50 | 0.1243 | 60.80 |
| M2 | 矩形排列方式 | (a=2l, b=l) | 3.54 | 0.0621 | 15.16 |
| M3 | 菱形排列方式 | (a=l, b=l) | 2.97 | 0.0475 | 16.44 |
| M4 | 矩形排列方式 | (a=b=2l) | 5.00 | 0.0311 | 3.80 |
Tab. 2 Experiment cases表2 实验工况 |
| 组次 | 模型 | 波高/m | 波陡H/L | 密度φ | 排列系数ψ |
|---|---|---|---|---|---|
| 1 | 无 | 0.06 | 0.0421 | — | — |
| 2 | 无 | 0.09 | 0.0632 | — | — |
| 3 | 无 | 0.12 | 0.0843 | — | — |
| 4 | M1 | 0.06 | 0.0421 | 0.1243 | 60.80 |
| 5 | M1 | 0.09 | 0.0632 | 0.1243 | 60.80 |
| 6 | M1 | 0.12 | 0.0843 | 0.1243 | 60.80 |
| 7 | M2 | 0.06 | 0.0421 | 0.0621 | 15.16 |
| 8 | M2 | 0.09 | 0.0632 | 0.0621 | 15.16 |
| 9 | M2 | 0.12 | 0.0843 | 0.0621 | 15.16 |
| 10 | M3 | 0.06 | 0.0421 | 0.0475 | 16.44 |
| 11 | M3 | 0.09 | 0.0632 | 0.0475 | 16.44 |
| 12 | M3 | 0.12 | 0.0843 | 0.0475 | 16.44 |
| 13 | M4 | 0.06 | 0.0421 | 0.0311 | 3.80 |
| 14 | M4 | 0.09 | 0.0632 | 0.0311 | 3.80 |
| 15 | M4 | 0.12 | 0.0843 | 0.0311 | 3.80 |
Fig. 3 Experimental results on beach profile under the effect of regular waves图3 规则波作用下岸滩剖面变化的实验结果 |
Fig. 4 Experimental results on the variation of regular waves’ height along the beach图4 波高沿程变化实验结果 |
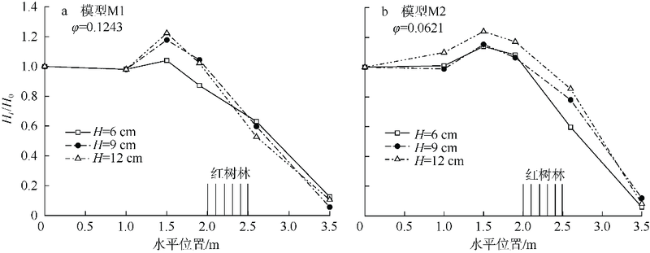
Fig. 5 Comparison of the experimental results under the effects of different heights of regular waves图5 H/L对岸滩剖面变化的影响 |
Fig. 6 Comparison of the experimental results between different densities of mangroves图6 分布密度和排列方式对岸滩剖面变化的影响 |
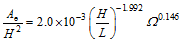
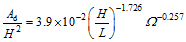
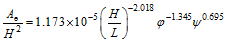 (5)
(5) (6)
(6) 随着波陡H/L、红树林分布密度φ的增大而减小, 随着排列系数
  随着波陡H/L、排列系数
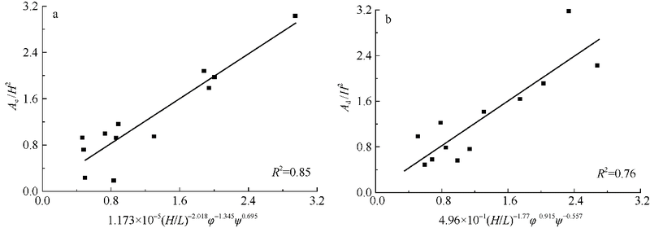
 Fig. 7 The relationship between dimensionless beach erosion / deposition of sand bar and vegetation parameters, dimensionless wave height, dimensionless specific weight parameter, beach slope图7 岸滩冲刷坑/淤积沙坝的尺度与植物、波高、泥沙和岸滩坡度之间的关系 |
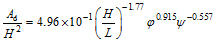
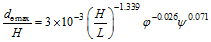 (7)
(7)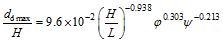 (8)
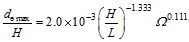
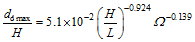
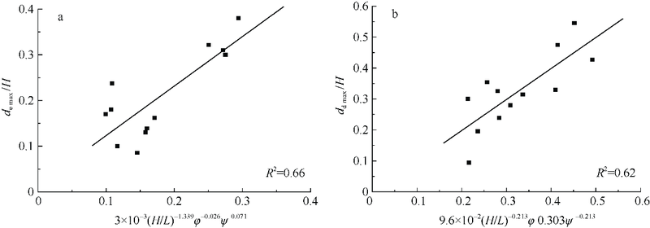
(8)Fig. 8 The relationship between dimensionless maximum depth of beach erosion / deposition and vegetation parameters, dimensionless wave height, dimensionless specific weight parameter, beach slope图8 岸滩最大冲刷/淤积高度与植物、波高、泥沙和岸滩坡度之间的关系 |
Tab. 3 Error analysis of fitting results表3 模拟结果误差分析 |
| 组次 | 岸滩冲刷坑尺度Ae/H2 | 岸滩淤积沙坝尺度Ad/H2 | 最大冲刷深度de max/H | 最大淤积高度dd max/H | ||||||||||||
|---|---|---|---|---|---|---|---|---|---|---|---|---|---|---|---|---|
| 实测值 | 拟合值 | 绝对误差 | 实测值 | 拟合值 | 绝对误差 | 实测值 | 拟合值 | 绝对误差 | 实测值 | 拟合值 | 绝对误差 | |||||
| 4 | 1.976 | 2.005 | 0.030 | 1.913 | 2.030 | 0.117 | 0.380 | 0.294 | 0.086 | 0.475 | 0.415 | 0.060 | ||||
| 5 | 1.163 | 0.885 | 0.278 | 0.564 | 0.990 | 0.426 | 0.162 | 0.171 | 0.009 | 0.239 | 0.284 | 0.045 | ||||
| 6 | 0.237 | 0.495 | 0.258 | 0.488 | 0.595 | 0.107 | 0.100 | 0.116 | 0.016 | 0.094 | 0.217 | 0.122 | ||||
| 7 | 1.788 | 1.942 | 0.154 | 3.181 | 2.331 | 0.850 | 0.310 | 0.271 | 0.039 | 0.545 | 0.452 | 0.093 | ||||
| 8 | 0.924 | 0.857 | 0.067 | 0.761 | 1.137 | 0.377 | 0.130 | 0.158 | 0.028 | 0.280 | 0.309 | 0.029 | ||||
| 9 | 0.722 | 0.480 | 0.242 | 0.580 | 0.684 | 0.103 | 0.180 | 0.107 | 0.073 | 0.196 | 0.236 | 0.040 | ||||
| 10 | 3.033 | 2.947 | 0.086 | 1.641 | 1.744 | 0.103 | 0.300 | 0.275 | 0.025 | 0.330 | 0.410 | 0.080 | ||||
| 11 | 0.947 | 1.300 | 0.353 | 0.787 | 0.851 | 0.064 | 0.139 | 0.160 | 0.021 | 0.326 | 0.280 | 0.046 | ||||
| 12 | 0.995 | 0.728 | 0.267 | 0.986 | 0.511 | 0.474 | 0.238 | 0.109 | 0.129 | 0.300 | 0.214 | 0.086 | ||||
| 13 | 2.079 | 1.882 | 0.197 | 2.225 | 2.676 | 0.451 | 0.322 | 0.251 | 0.071 | 0.427 | 0.492 | 0.065 | ||||
| 14 | 0.190 | 0.830 | 0.641 | 1.417 | 1.306 | 0.111 | 0.086 | 0.146 | 0.060 | 0.314 | 0.336 | 0.022 | ||||
| 15 | 0.930 | 0.465 | 0.465 | 1.224 | 0.785 | 0.439 | 0.170 | 0.099 | 0.071 | 0.354 | 0.257 | 0.097 | ||||
| 误差 统计 | Ae/H2 | Ad/H2 | de max/H | dd max/H | ||||||||||||
| 误差平方和 | 均方根误差 | 误差平方和 | 均方根误差 | 误差平方和 | 均方根误差 | 误差平方和 | 均方根误差 | |||||||||
| 1.101 | 0.303 | 1.730 | 0.380 | 0.047 | 0.063 | 0.062 | 0.072 | |||||||||
 (10)
(10) (11)
(11) (12)
(12) (13)
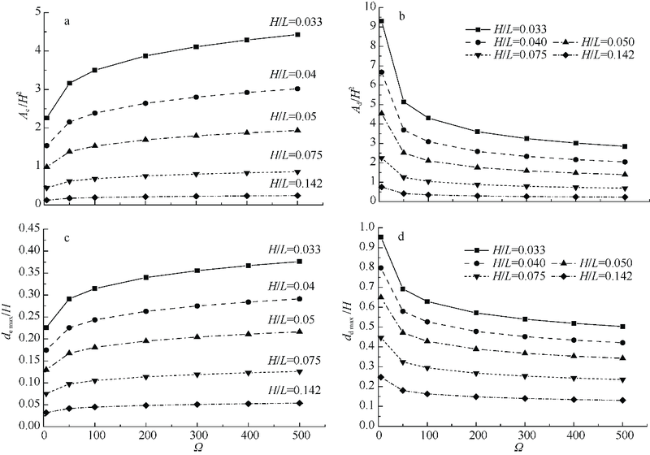
(13)Fig. 9 Prediction results of beach profile’s variation with the plant comprehensive coefficient under a given wave steepness H/L图9 给定波陡H/L下岸滩演变特征值随植物综合系数的预测结果 |
The authors have declared that no competing interests exist.
| [1] |
|
| [2] |
|
| [3] |
|
| [4] |
|
| [5] |
|
| [6] |
|
| [7] |
|
| [8] |
|
| [9] |
|
| [10] |
|
| [11] |
|
| [12] |
|
| [13] |
|
| [14] |
|
| [15] |
|
| [16] |
|
| [17] |
|
| [18] |
|
| [19] |
|
| [20] |
|
| [21] |
|
| [22] |
|
| [23] |
|
| [24] |
|
| [25] |
|
| [26] |
|
| [27] |
|
| [28] |
|
| [29] |
|
| [30] |
|
| [31] |
|
| [32] |
UMROH,
|
/
| 〈 |
|
〉 |


