
Journal of Tropical Oceanography >
Comparative analysis on four recurrence levels of joint distribution of wave height and period*
Received date: 2017-10-30
Request revised date: 2018-02-10
Online published: 2018-07-16
Supported by
National Natural Science Foundation of China (41371498)
Copyright
In this study, we comparatively analyzed four designed wave recurrence levels of bivariate joint distribution of wave height and wave period by using Archimedean copula function, Kendall distribution function and survival Kendall distribution function. The annual maximum wave height and corresponding wave period of US Army Corps of Civil Engineers Field Research Facility (FRF) at Duck of North Carolina, US as an example, the “OR” primary return periods, “AND” primary return periods, Kendall return periods and survival Kendall return periods of bivariate joint distribution and the most likely designed wave quantiles were computed by using the optimally fitted Gumbel-Hougaard copula. The main conclusions of this study are summarized as follows: Comparing different specific wave return periods, the Kendall return periods can more accurately reflect wave risks relative to “OR” primary return periods, while the survival Kendall return periods can more accurately reflect wave risks when two wave variables are supercritical at the same time with respect to “AND” primary return periods. The univariate wave height or wave period designed value has reached a higher design standard according to the relevant specifications of the current design requirements. The estimated wave design quantiles of the “OR” primary return periods and two variables with the same frequency are obviously higher than those of univariate wave elements. The most-likely design realizations of the Kendall return periods and the survival Kendall return periods can serve as the new selections for safety and risk management of coastal engineering projects.
CHEN Zhishen , SHI Weiyong , LU Jianfei . Comparative analysis on four recurrence levels of joint distribution of wave height and period*[J]. Journal of Tropical Oceanography, 2018 , 37(4) : 18 -23 . DOI: 10.11978/2017116
Tab. 1 Parameters of the marginal distribution, and values of goodness of fit test表1 波高、周期概率分布参数与拟合优度检验值 |
| 样本 | 边缘 分布 | 位置 参数 | 尺度 参数 | 形态 参数 | RMSE | PPCC |
|---|---|---|---|---|---|---|
| H/m | GNO | 5.017 | 0.868 | -0.464 | 0.228 | 0.984 |
| GEV | 4.756 | 0.712 | -0.082 | 0.224 | 0.985 | |
| GLO | 5.037 | 0.492 | -0.224 | 0.223 | 0.986 | |
| P-Ⅲ | 3.744 | 2.189 | 1.473 | 0.239 | 0.981 | |
| T/s | GNO | 12.177 | 2.506 | -0.429 | 0.479 | 0.984 |
| GEV | 11.413 | 2.082 | -0.058 | 0.503 | 0.983 | |
| GLO | 12.230 | 1.421 | -0.208 | 0.589 | 0.976 | |
| P-Ⅲ | 8.213 | 2.538 | 0.561 | 0.439 | 0.987 |
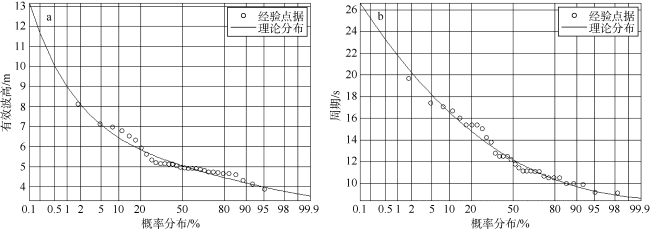
Fig. 1 Diagrams of Generalized Logistic distribution of annual maximum wave heights (a) and Pearson type Ⅲ distribution of wave periods (b).图1 年最大波高GLO分布(a)与周期P-Ⅲ型分布(b) |
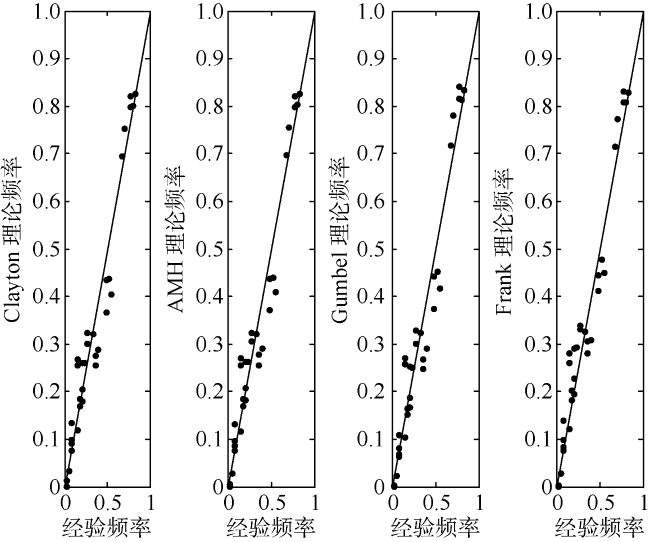
Fig. 2 Comparison of theoretical and empirical joint probabilities with four copulas图2 copula函数拟合对比图 |
Tab. 2 Results of parameter estimation and goodness- of-fit tests for four Copulas表2 波高周期联合分布的参数估计与拟合优度评价结果 |
| Archimedean Copula | θ | RMSE | AIC |
|---|---|---|---|
| Clayton | 0.763 | 0.423 | -53 |
| A-M-H | 0.897 | 0.062 | -176 |
| Gumbel-Hougaard | 1.382 | 0.059 | -179 |
| Frank | 4.000 | 0.064 | -176 |
Tab. 3 Comparison of return periods and hazard rates for the joint distribution of wave heights and periods表3 波高周期联合分布重现期 |
| 重现期/a | P | Tor | P | Tand | P | TK | P | TSK | P |
|---|---|---|---|---|---|---|---|---|---|
| 100 | 0.01 | 60.8 | 0.0165 | 282.6 | 0.0035 | 215.3 | 0.0046 | 106.4 | 0.0094 |
| 50 | 0.02 | 30.5 | 0.0328 | 139.2 | 0.0072 | 105.7 | 0.0095 | 57.5 | 0.0174 |
| 20 | 0.05 | 12.3 | 0.0812 | 53.3 | 0.0188 | 40.2 | 0.0249 | 22.2 | 0.0451 |
| 10 | 0.10 | 6.3 | 0.1597 | 24.8 | 0.0403 | 18.6 | 0.0539 | 10.5 | 0.0952 |
| 5 | 0.20 | 3.2 | 0.3082 | 10.9 | 0.0918 | 8.1 | 0.1237 | 4.7 | 0.2113 |
Tab. 4 Design values of wave height and period at different return periods表4 不同重现期下波高与周期的设计值 |
| 重现期/a | 边缘分布 设计值 | “或”重现期 设计值 | “且”重现期 设计值 | Kendall重现期设计值 | 生存Kendall重现期设计值 | 同频率设计值 | ||||||
|---|---|---|---|---|---|---|---|---|---|---|---|---|
| H/m | T/s | Hor/m | Tor/s | Hand/m | Tand/s | HK/m | TK/s | HSK/m | TSK/s | Htp/m | Ttp/s | |
| 100 | 8.99 | 21.79 | 9.64 | 23.00 | 7.54 | 19.52 | 7.96 | 20.28 | 8.43 | 21.27 | 9.73 | 22.86 |
| 50 | 8.09 | 20.27 | 8.65 | 21.50 | 6.82 | 18.30 | 7.24 | 18.80 | 7.79 | 20.15 | 8.73 | 21.36 |
| 20 | 7.09 | 18.19 | 7.55 | 19.45 | 6.14 | 16.34 | 6.45 | 16.83 | 6.83 | 18.30 | 7.61 | 19.32 |
| 10 | 6.43 | 16.55 | 6.83 | 17.83 | 5.69 | 14.85 | 5.95 | 15.35 | 6.25 | 16.65 | 6.88 | 17.70 |
| 5 | 5.84 | 14.80 | 6.19 | 16.09 | 5.32 | 13.21 | 5.51 | 13.84 | 5.77 | 15.19 | 6.23 | 15.97 |
The authors have declared that no competing interests exist.
| 1 |
|
| 2 |
|
| 3 |
|
| 4 |
|
| 5 |
|
| 6 |
|
| 7 |
|
| 8 |
|
| 9 |
|
| 10 |
|
| 11 |
|
| 12 |
|
| 13 |
|
| 14 |
|
/
| 〈 |
|
〉 |
