
Journal of Tropical Oceanography >
Assessment of eutrophication status by using the Pressure-Status-Response Model in Xiangshan Bay, China
Received date: 2017-07-07
Request revised date: 2017-09-08
Online published: 2018-07-16
Supported by
National Marine Special Founds for Public Welfare Project (201105010-14);Shanghai Committee of Science and Technology Research Plan Project (12231203401);Marine Environmental Resources to Repair the Special Subsidy Funds of 2014 (Ningbo Ocean [2014] 46)
Copyright
Due to its unique geographical position and marine functional zoning, Xiangshan Bay (XSB) has suffered severe eutrophication for many years. Nutrients-based indices have been widely used to assess eutrophication status; however, they cannot comprehensively reflect the true state, and the actual eutrophication status of the bay remains unclear. According to the assessment of eutrophication framework and with the consideration of practical situation in XSB, we modified the assessment framework and optimized partial indices to make the assessment method more suitable for XSB. Using this new assessment framework and field monitoring data from 2001 to 2015, we analyzed the eutrophication pressure and the grade of overall eutrophic conditions, including using chlorophyll as primary symptom and using dissolved oxygen in the bottom layer and red-tide occurrence as secondary symptoms, and predicted the eutrophication trend by taking into consideration of the coastal zone management policy for comprehensive water cleaning activities, and drainage control of total amount of pollutants. The results showed that the integrated eutrophic grade, the eutrophication pressure and the degree of eutrophication status and its response were all at moderate level, based on a scheme of five categories: Superior, Superior-Moderate, Moderate, Moderate-Poor, and Poor. Our results showed that the comprehensive assessment of eutrophication status would remain at the moderate level in next several years. The results reflect the overall degree of eutrophication in the Bay, which is more in accordance with reality. Thus, these results will be helpful for making better new regulations and management plans of eutrophication in XSB.
Key words: Xiangshan Bay; Pressure-Status-Response; eutrophication; forecast
XU Guofeng , CUI Yongping , LIU Lian . Assessment of eutrophication status by using the Pressure-Status-Response Model in Xiangshan Bay, China[J]. Journal of Tropical Oceanography, 2018 , 37(4) : 52 -60 . DOI: 10.11978/2017078
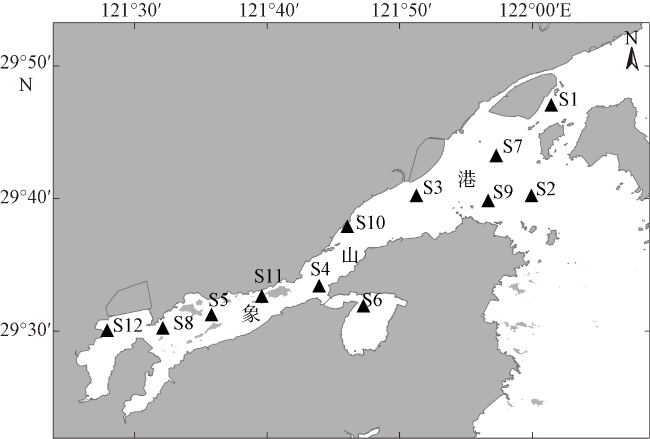
Fig. 1 Study area and sampling sites in Xiangshan Bay图1 象山港水体富营养化研究区域及站位 |
Tab. 1 Assessment of eutrophic pressure表1 水体富营养化压力(P)评价 |
| 序号 | 等级 | 压力范围 | 赋值 |
|---|---|---|---|
| 1 | 高 | P>1.0 | 1 |
| 2 | 中高 | 0.8<P≤1.0 | 2 |
| 3 | 中 | 0.6<P≤0.8 | 3 |
| 4 | 中低 | 0.4<P≤0.6 | 4 |
| 5 | 低 | P≤0.4 | 5 |
Tab. 2 Assessment using chlorophyll a as the primary symptom表2 叶绿素a初级症状评判标准 |
| 序号 | 质量浓度/(μg•L-1) | 出现频率/% | 等级 | 赋值 |
|---|---|---|---|---|
| 1 | >20 | f>80 | 高 | 1 |
| 2 | 60<f≤80 | 中高 | 2 | |
| 3 | 40<f≤60 | 中 | 3 | |
| 4 | 20<f≤40 | 中低 | 4 | |
| 5 | f≤20 | 低 | 5 | |
| 6 | 5<chl a≤20 | f>80 | 中高 | 2 |
| 7 | 40<f≤80 | 中 | 3 | |
| 8 | f≤40 | 中低 | 4 | |
| 9 | ≤5 | f>60 | 中低 | 4 |
| 10 | f≤60 | 低 | 5 |
注: 出现频率指浓度值达到90%累积百分数所对应的站位数所占比例 |
Tab. 3 Assessment criteria by using dissolved oxygen in the bottom layer as a secondary symptom表3 底层溶解氧次级症状评价标准 |
| 序号 | 质量浓度/(mg•L-1) | 出现频率/% | 等级 | 赋值 |
|---|---|---|---|---|
| 1 | ≤2 | f>80 | 高 | 1 |
| 2 | 60<f≤80 | 中高 | 2 | |
| 3 | 40<f≤60 | 中 | 3 | |
| 4 | 20<f≤40 | 中低 | 4 | |
| 5 | f≤20 | 低 | 5 | |
| 6 | 2<DO≤5 | f>80 | 中高 | 2 |
| 7 | 40<f≤80 | 中 | 3 | |
| 8 | f≤40 | 中低 | 4 | |
| 9 | >5 | — | 低 | 5 |
注: 出现频率指浓度值达到10%累积百分数所对应的站位数所占比例; —表示在底层溶解氧质量浓度>5mg•L-1的情况下, 不再进行出现频率划分 |
Tab. 4 Assessment criteria by taking red tide incidence as a secondary symptom表4 赤潮次级症状指标评价标准 |
| 序号 | 持续时间 | 出现频率 | 等级 | 赋值 |
|---|---|---|---|---|
| 1 | 持续1月以上 | 周期性 | 高 | 1 |
| 2 | 持续2月以上 | 偶发性 | 高 | 1 |
| 3 | 持续1月之内 | 周期性 | 中高 | 2 |
| 4 | 持续2月之内 | 偶发性 | 中高 | 2 |
| 5 | 持续2周之内 | 周期性 | 中 | 3 |
| 6 | 累计1月之内 | 偶发性 | 中 | 3 |
| 7 | 持续1周之内 | 周期性 | 中低 | 4 |
| 8 | 累计2周之内 | 偶发性 | 中低 | 4 |
| 9 | 持续3天之内 | 周期性 | 低 | 5 |
| 10 | 累计1周之内 | 偶发性 | 低 | 5 |
注: 周期性主要指季节性, 偶发性指随机性 |
Tab. 5 The criteria of assessments in terms of responses to eutrophication表5 富营养化响应评价 |
| 序号 | 等级 | 变化趋势 | 赋值 |
|---|---|---|---|
| 1 | 高 | 高度恶化 | 1 |
| 2 | 中高 | 略有恶化 | 2 |
| 3 | 中 | 维持不变 | 3 |
| 4 | 中低 | 略有改善 | 4 |
| 5 | 低 | 显著改善 | 5 |
注: 维持不变指入海通量的年变化率在10%以内; 略有恶化与略有改善指入海通量的年变化率在10%~40%; 高度恶化和显著改善指入海通量的年变化率在40%以上 |
Tab. 6 The assessment matrix for classifying overall eutrophic grade表6 水体富营养化评价划分矩阵表 |
| 指标 | 排列组合 | 最终等级 | |||||||||
|---|---|---|---|---|---|---|---|---|---|---|---|
| P | 555444 | 优5% | |||||||||
| S | 555555 | ||||||||||
| R | 543543 | ||||||||||
| P | 555555544444333333 | 良19% | |||||||||
| S | 554444455444555444 | ||||||||||
| R | 215432121543543543 | ||||||||||
| P | 555554444444333333322222222211 | 中32% | |||||||||
| S | 333334433333554433344444333233 | ||||||||||
| R | 215432154321212154354321543554 | ||||||||||
| P | 44444333333322222211111 | 差24% | |||||||||
| S | 22222332222233222233322 | ||||||||||
| R | 54321215432121432132154 | ||||||||||
| P | 333332222211111111 | 劣19% | |||||||||
| S | 111111111122211111 | ||||||||||
| R | 543215432132154321 | ||||||||||
注: P表示压力, S表示状态, R表示响应 |
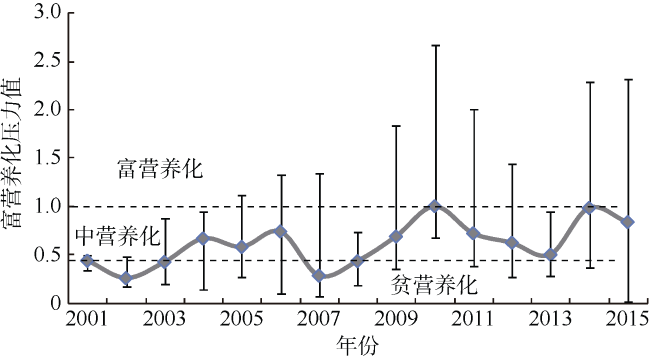
Fig. 2 Eutrophication pressure in Xiangshan Bay between 2001 and 2015图2 2001年—2015年间象山港水体富营养化压力变化 |
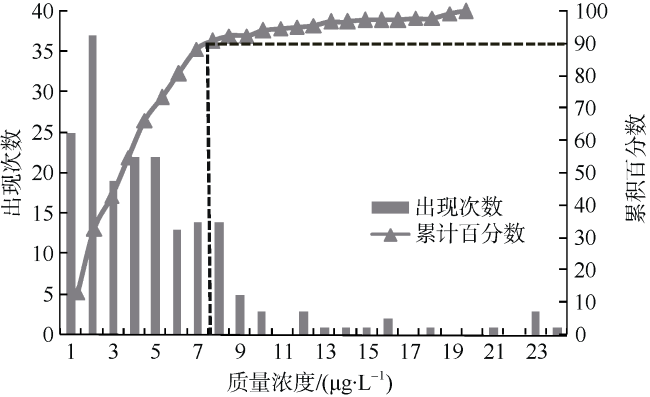
Fig. 3 Frequency and the cumulative curve of the chlorophyll a concentration in Xiangshan Bay from 2001 to 2015图3 2001年—2015年象山港叶绿素a浓度频次分布与累计曲线 |
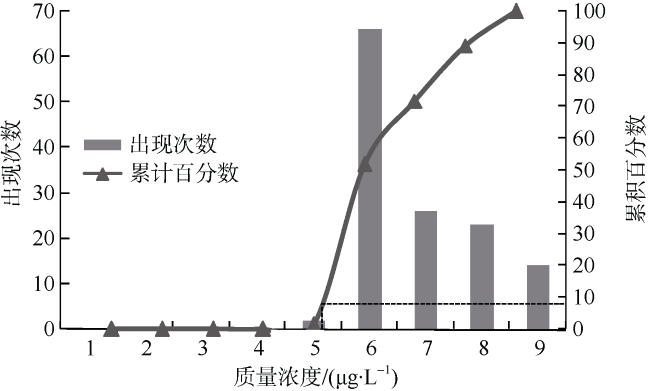
Fig. 4 Frequency and cumulative curve of dissolved oxygen concentration in the bottom layer of Xiangshan Bay from 2001 to 2015图4 2001年—2015年间象山港底层溶解氧浓度频次分布与累计曲线 |
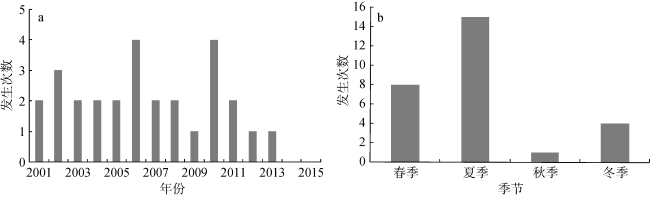
Fig. 5 Frequency of red-tide occurrence in Xiangshan Bay in each year between 2001 and 2015 and seasonal distribution over the study period图5 2001年—2015年间象山港赤潮发生情况 |
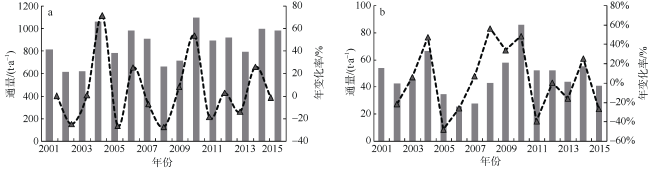
Fig. 6 Yearly fluxes of nitrogen and phosphorous in Xiangshan Bay between 2001 and 2015图6 2001年—2015年间象山港氮(a)、磷(b)营养盐入海通量及年际变化 |
The authors have declared that no competing interests exist.
| 1 |
|
| 2 |
|
| 3 |
|
| 4 |
国家环境保护局, 2004. GB 3097-1997 海水水质标准[S]. 北京: 环境科学出版社: 15-16 (in Chinese).
|
| 5 |
|
| 6 |
|
| 7 |
|
| 8 |
|
| 9 |
|
| 10 |
|
| 11 |
|
| 12 |
|
| 13 |
|
| 14 |
|
| 15 |
宁波海洋环境监测中心站, 2009. 浙江大唐乌沙山发电厂厂址前沿海域海洋环境影响跟踪监测报告[R]. 85-86 (in Chinese).
|
| 16 |
宁波市海洋与渔业局, 2016. 2015. 2015年宁波市海洋环境公报[R]. 5-16. in Chinese).
|
| 17 |
宁波市人民政府, 2013. 象山港区域保护和利用规划纲要(2012—2030)[R]. 19-26. html (in Chinese).
|
| 18 |
|
| 19 |
|
| 20 |
|
| 21 |
|
| 22 |
|
| 23 |
|
| 24 |
|
| 25 |
|
| 26 |
|
| 27 |
|
| 28 |
|
| 29 |
|
| 30 |
|
| 31 |
|
| 32 |
|
| 33 |
|
| 34 |
|
| 35 |
中华人民共和国国家质量监督检验检疫总局, 中国国家标准化管理委员会, 2008. GB/T 12763.4-2007 海洋调查规范第4部分: 海水化学要素调查[S]. 北京: 中国标准出版社: 16-23 (in Chinese).
|
| 36 |
中华人民共和国国家质量监督检验检疫总局, 中国国家标准化管理委员会, 2008. GB 17378.4-2007 海洋监测规范第4部分: 海水分析[S]. 北京: 中国标准出版社: 99-101 (in Chinese).
|
| 37 |
|
| 38 |
|
| 39 |
|
| 40 |
|
| 41 |
|
| 42 |
|
/
| 〈 |
|
〉 |
