
Journal of Tropical Oceanography >
Study on the seasonal and interannual variability of river plume in the Pearl River Estuary based on a high-resolution ocean dynamic model
Copy editor: LIN Qiang
Received date: 2018-09-29
Request revised date: 2018-12-04
Online published: 2019-06-17
Supported by
Fundamental Research Funds for the Central Universities(17lgzd20)
State Key Laboratory of Tropical Oceanography, South China Sea Institute of Oceanology, Chinese Academy of Sciences(LTO1605)
National Natural Science Foundation of China(41306105)
Copyright
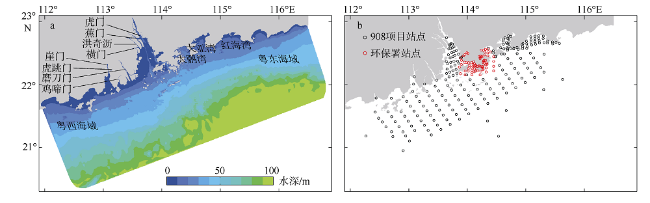
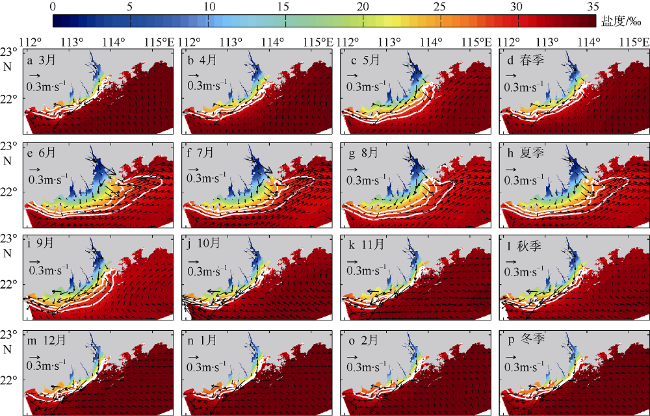
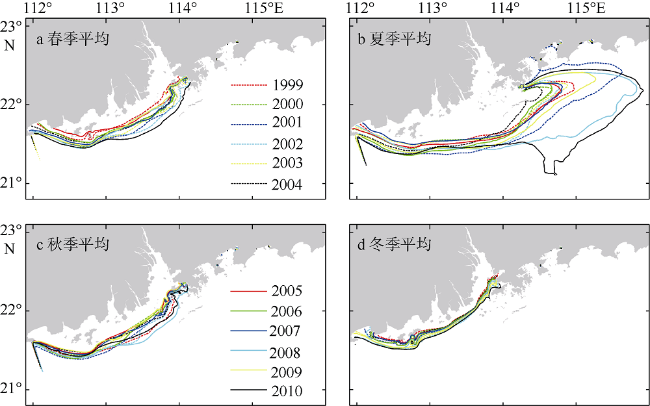
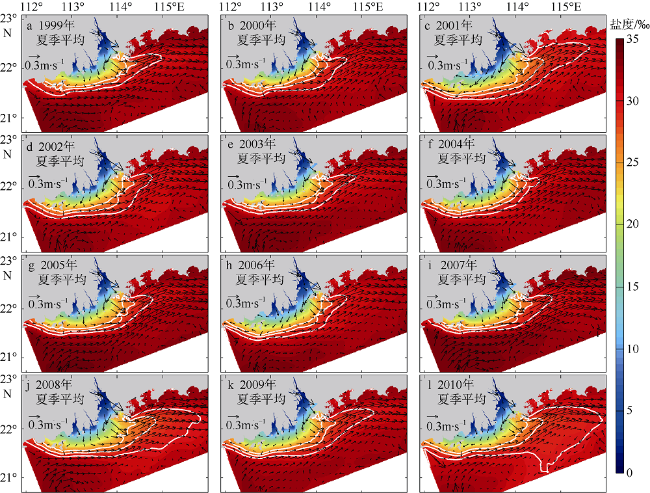
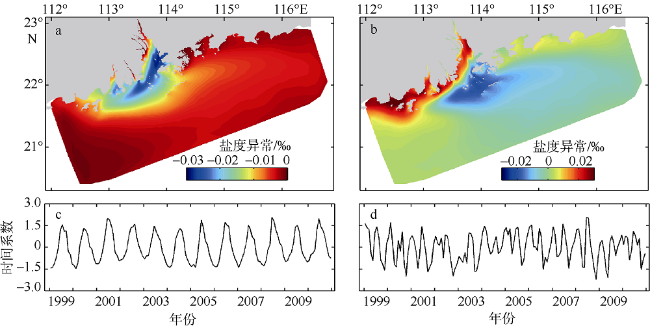
Based on the sea surface salinity data from 1999 to 2010 simulated by the high-resolution Finite-Volume Community Ocean Model (FVCOM), the seasonal and interannual variability of river plume in the Pearl River Estuary was analyzed and the main dynamic factors related to the variability were also discussed in combination with Empirical Orthogonal Function (EOF) analysis in this study. The field observation data during the simulation period were used to verify the simulation results for the 12 years, and the verification results showed that the model had higher accuracy and simulated the extension and variability of the plume fairly well. The simulated results showed that the plume exhibited significant seasonal variability. Affected by the high river discharge and southwesterly wind, the summertime plume exhibited a bidirectional structure with the plume extending westward attaching to the coast and eastward detaching from the coast. The extension area of the summertime plume was the largest. In winter, the river discharge attenuated to a minimum and the wind field changed into strong northeasterly wind. Consequently, the plume was squeezed to the western coast tightly to form a narrow band with the smallest extension area. The spring and autumn periods were transitional seasons, and the plume in these two seasons exhibited westward alongshore spreading. The summertime plume exhibited significant interannual variability with three main patterns, namely, the eastward extension dominated, approximately symmetric extension and westward extension dominated. In spring, the interannual variability of the plume was followed by that in summer and the variability mostly occurred in the western region and river estuary. The interannual variability in autumn and winter was not significant, especially in winter. The first EOF mode could explain 91.2% of the total variance, corresponding to the change in river discharge. The second EOF mode could explain 4.1% of the total variance, corresponding to the change in prevailing wind.
XU Chuang , XU Yongji , HU Jiatang , LI Shiyu , LIU Jintao . Study on the seasonal and interannual variability of river plume in the Pearl River Estuary based on a high-resolution ocean dynamic model[J]. Journal of Tropical Oceanography, 2019 , 38(3) : 43 -52 . DOI: 10.11978/2018098
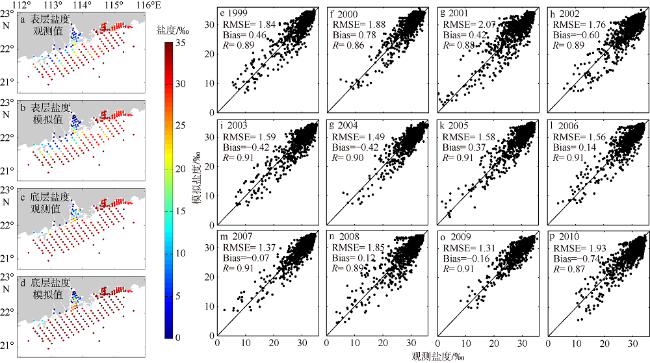
图2 盐度验证结果a—d为2006年7、8月珠江口表、底层盐度模拟值和观测值比对结果, e—p为1999—2010年香港环保署逐年观测盐度和模拟盐度比对结果 Fig. 2 Validation results of salinity. (a-d) The comparison results of simulated and observed salinity at both surface and bottom in Pearl River Estuary during July-August 2006. (e-p) The comparison results of observed and simulated salinity collected from Hong Kong Environmental Protection Department from 1999 to 2010 |
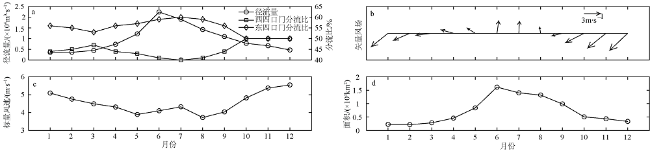
图3 1999—2010年多年平均的各个月份的径流量及口门分流比(a)、矢量风场(b)、标量风速(c)和30‰等盐度线围成的羽状流扩展面积(d)Fig. 3 Twelve-year-averaged river discharge and distribution ratios of the four western and eastern outlets (a), vector wind (b), scalar wind speed (c), and plume area enclosed by 30‰ isohaline in each month (d) |
图5 1999—2010年各个季节季均径流(a)、矢量风场(b)、标量风速(c)和30‰等盐度线围成的羽状流面积(d)Fig. 5 Twelve-year-averaged river discharge (a), vector wind (b), scalar wind speed (c), and plume area (d) in each season |
图8 1999-2010年月均珠江口表层盐度异常场EOF分解的第一空间模态(a)、第二空间模态(b)、第一时间模态(c)和第二时间模态(d)第一模态可以解释整体变化的91.2%, 第二模态可以解释整体变化的4.1% Fig. 8 First spatial mode (a), 2nd spatial mode (b), 1st temporal mode (c), and 2nd temporal mode (d) of EOF analysis of monthly mean sea surface salinity anomaly (‰) field during 1999-2010. The first mode can explain 91.2% of the total variance, and the second mode can explain 41.2% of the total variance |
The authors have declared that no competing interests exist.
作者已声明无竞争性利益关系。
| [1] |
胡嘉镗, 李适宇 , 2008. 珠江三角洲一维盐度与三维斜压耦合模型[J]. 水利学报, 39(11):1174-1182.
|
| [2] |
庞海龙 , 2006. 珠江冲淡水扩散路径分析[D]. 青岛: 中国海洋大学.
|
| [3] |
杨阳, 孟强, 夏华永 , 等, 2010. 2006年夏季珠江冲淡水扩展及生态响应[J]. 热带海洋学报, 29(6):15-21.
|
| [4] |
|
| [5] |
|
| [6] |
|
| [7] |
|
| [8] |
|
| [9] |
|
| [10] |
|
| [11] |
|
| [12] |
|
| [13] |
|
| [14] |
|
| [15] |
|
| [16] |
|
| [17] |
|
| [18] |
|
| [19] |
|
| [20] |
|
| [21] |
|
| [22] |
|
/
| 〈 |
|
〉 |

