
Journal of Tropical Oceanography >
Response of tidal dynamics to the variation of water depth: case study of Guadiana estuary in Portugal
Received date: 2019-04-09
Request revised date: 2019-05-31
Online published: 2020-01-09
Supported by
National Key Research and Development Program of China(2016YFC0402600)
National Natural Science Foundation of China(5170928)
Open Research Found of State Key Laboratory of Estuarine and Coastal Research(SKLEC-KF201809)
Guangdong Provincial Natural Science Foundation of China(2017A030310321)
the Water Resource Science and Technology Innovation Program of Guangdong Province(2016-20)
Copyright
Quantifying the impacts of human-induced (such as dredging for navigational channels) or natural (such as global sea level rise) interventions on estuarine environment is an important issue for estuary and coastal studies. For given simplified geometry and dynamics, analytical models are capable of rapidly identify the influence of human-induced or natural interventions on estuarine environment, which are invaluable tools for exploring response of tidal dynamics to external forcing. In this study, a one-dimensional hydrodynamic analytical model was used to explore the response of tidal dynamics in terms of different constituents to variation of tidally averaged water depth (mimicking the channel dredging and deposition) in the Guadiana estuary in Portugal, building on previous studies on nonlinear frictional interaction between different tidal constituents. The results show that the influence of variable depth on tidal dynamics in the seaward reach (x=0-60 km) is stronger compared to that in the landward reach (x=60-78 km). In particular, the influence of variable depth on the predominant semi-diurnal tides (M2, S2, N2) is larger than that on diurnal tides (K1, O1). Analytical results also indicate that the basic tidal dynamic pattern along the estuary is more or less the same for a less intensive dredging of less than 2 m, while the pattern may substantially change for an intensive dredging activity. In addition, the channel bed deposition will weaken the tidal dynamics with a decrease of tidal amplitude, velocity amplitude, tidal wave celerity, and the phase lag between velocity and the elevation also decreases.
ZHANG Ping , XIE Meifang , YANG Hao , CAI Huayang , Ou Suying , YANG Qingshu . Response of tidal dynamics to the variation of water depth: case study of Guadiana estuary in Portugal[J]. Journal of Tropical Oceanography, 2020 , 39(1) : 1 -11 . DOI: 10.11978/2019037
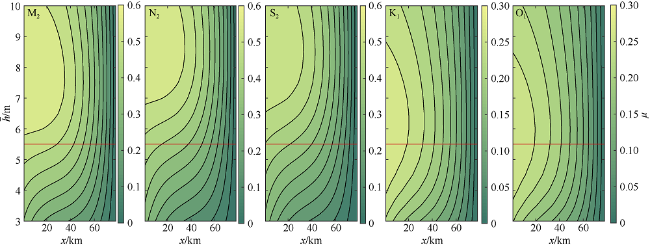
图2 Guadiana河口主要天文分潮(M2、S2、N2、K1、O1)流速振幅参数μ随着平均水深变化的等值线分布图红色实线代表实际平均水深$\overline{h}$=5.5m Fig. 2 Contour plot of velocity number μ for main tidal constituents (M2, S2, N2, K1, O1)under different mean water depth conditions with the red line indicating the actual mean depth $\overline{h}$=5.5 m |
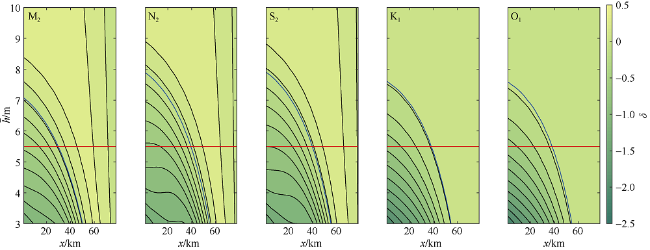
图3 Guadiana河口主要天文分潮(M2、S2、N2、K1、O1)衰减率参数δ随平均水深变化的等值线分布图红色实线代表河口实际平均水深$\bar{h}$=5.5m; 蓝色线条为δ=0 Fig. 3 Contour plot of damping number{Invalid MML}δ for main tidal constituents (M2, S2, N2, K1, O1) under different mean water depth conditions. The red line indicates the actual mean depth $\overline{h}$=5.5 m, and the blue line indicates δ=0 |
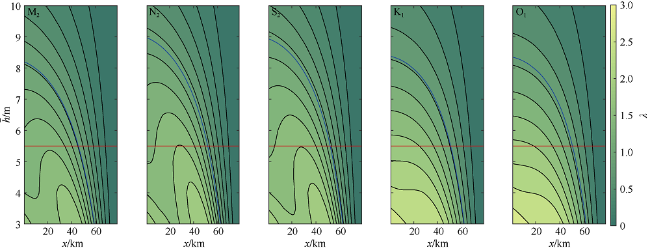
图4 Guadiana河口主要天文分潮(M2、S2、N2、K1、O1)波速参数λ随平均水深变化的等值线分布图红色实线代表河口实际平均水深$\overline{h}$=5.5m。蓝色线条为λ=1 Fig. 4 Contour plot of celerity number λ for main tidal constituents (M2, S2, N2, K1, O1) under different mean water conditions. The red line indicates the actual mean depth $\overline{h}$=5.5 m, and the blue line indicates λ=1 |
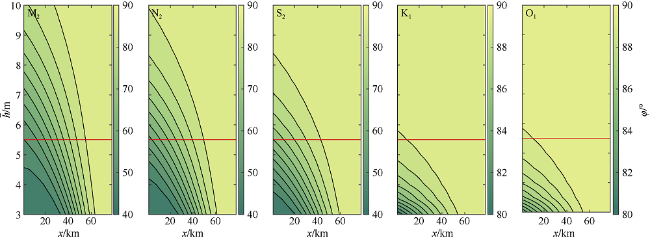
图5 Guadiana河口主要天文分潮(M2、S2、N2、K1、O1)流速与水位之间的相位差ϕ随着平均水深变化的等值线分布图红色实线代表河口实际平均水深$\overline{h}$=5.5m Fig. 5 Contour plot of phase difference between current and elevation for main tidal constituents (M2, S2, N2, K1, O1)under different mean water depth condition. The red line indicates the actual mean depth $\overline{h}$=5.5 m |
表1 Guadiana河口主要天文分潮(M2、S2、N2、K1、O1)无量纲潮波变量参数相对河口实际平均水深条件下的变化量ψ(单位: m)和变化率σ(单位: %)Tab. 1 Change range (units: m) and relative change (units: %) in the main dimensionless parameters due to the depth variation when compared with the cause of actual mean water depth for different tidal constituents (M2, S2, N2, K1, O1) |
| 半日分潮 | 全日分潮 | |||||
|---|---|---|---|---|---|---|
| M2 | N2 | S2 | K1 | O1 | ||
| 流速参数(μ) | ψ1/σ1 | -0.14/-35.89 | -0.13/-39.92 | -0.12/-39.07 | -0.04/-21.07 | -0.03/-18.30 |
| ψ2/σ2 | 0.04/10.74 | 0.06/17.90 | 0.05/16.36 | 0.002/0.78 | -0.001/-0.36 | |
| ψ3/σ3 | 0.06/14.76 | 0.10/30.82 | 0.08/27.34 | -0.003/-1.75 | -0.007/-3.49 | |
| ψ4/σ4 | 0.02/4.99 | 0.10/31.15 | 0.08/25.88 | -0.02/-12.55 | -0.03/-14.48 | |
| 潮波振幅衰减率参数(δ) | ψ1/σ1 | -0.37/-15.95* | -0.40/-3.01* | -0.41/-2.91* | -0.49/-4.87* | -0.48/-5.16* |
| ψ2/σ2 | 0.13/5.66* | 0.17/1.259* | 0.17/0.18* | 0.12/-1.22* | 0.12/-1.23* | |
| ψ3/σ3 | 0.22/9.46* | 0.30/2.27* | 0.29/2.10* | 0.19/1.93* | 0.18/1.92* | |
| ψ4/σ4 | 0.29/12.36* | 0.44/3.32* | 0.43/3.04* | 0.25/2.47* | 0.23/2.45* | |
| 波速参数(λ) | ψ1/σ1 | 0.28/28.96 | 0.28/24.86 | 0.30/25.90 | 0.56/46.13 | 0.60/48.86 |
| ψ2/σ2 | -0.17/-16.81 | -0.16/-14.14 | -0.17/-14.67 | -0.26/-21.12 | -0.26/-21.57 | |
| ψ3/σ3 | -0.34/-34.19 | -0.34/-30.07 | -0.35/-30.87 | -0.48/-39.70 | -0.49/-40.23 | |
| Ψ4/σ4 | -0.67/-68.13 | -0.732/-65.03 | -0.75/-65.48 | -0.87/-71.11 | -0.87/-71.41 | |
| 水位与流速之间的 相位差(ϕ) | ψ1/σ1 | -9.50/-12.85 | -11.84/-15.08 | -12.45/-15.04 | -1.50/-1.67 | -1.07/-1.19 |
| ψ2/σ2 | 4.27/5.76 | 4.32/5.50 | 3.28/3.97 | 0.16/0.18 | 0.12/0.13 | |
| ψ3/σ3 | 7.79/10.53 | 7.15/9.10 | 4.99/6.03 | 0.24/0.27 | 0.42/0.19 | |
| ψ4/σ4 | 12.86/17.39 | 10.04/12.78 | 6.51/7.86 | 0.32/0.35 | 0.23/0.26 | |
注: “*”表示倍数关系。 |
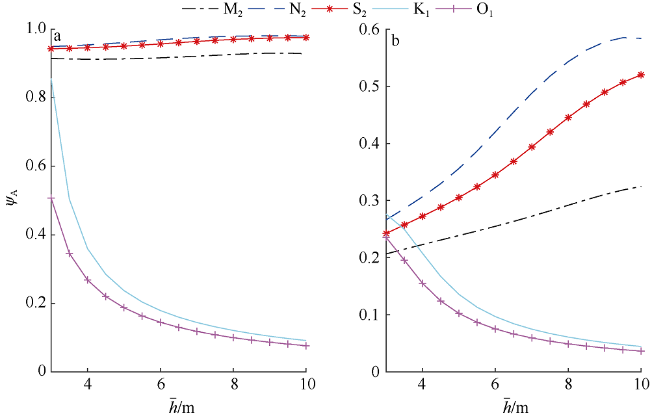
图7 Guadiana河口主要天文分潮(M2、S2、N2、K1、O1)反射系数ΨA在河口上游(x=78km)(a) 和沿程平均值 (b) 随平均水深增大的变化图Fig. 7 Variations of the reflection coefficient ΨA in the upstream boundary (x=78km) (a) and its spatially averaged value (b) for the main tidal constituents (M2, S2, N2, K1, O1) with increase of mean water depth |
| [1] |
丁芮, 陈学恩, 曲念东 , 2016. 珠江口及邻近海域潮汐环流数值模拟Ⅱ——河口水交换和物质输运分析[J]. 中国海洋大学学报, 46(7):1-10.
|
| [2] |
李薇, 苏正华, 徐弋琅 , 等, 2018. 考虑泥沙减阻效应的潮波理论模型及其在钱塘江河口的应用[J]. 应用基础与工程科学学报, 26(5):954-964.
|
| [3] |
刘伟东, 张心凤, 蒋星科 , 2007. 珠海港高栏港区疏浚对港区泥沙回淤的影响分析[J]. 人民珠江, 28(2):15-16, 42.
|
| [4] |
刘俊勇, 徐峰俊 , 2006. 广州港出海航道疏浚工程对珠江口水动力及河势稳定影响研究[J]. 人民珠江, 27(4):11-14.
|
| [5] |
庞启秀, 徐金环 , 2005. 河口疏浚对环境的影响[J]. 中国港湾建设, (2):8-10.
|
| [6] |
郑志华, 徐碧华 , 2008. 航道疏浚中悬浮泥沙对海水水质和海洋生物影响的数值研究[J]. 上海船舶运输科学研究所学报, 31(2):105-110.
|
| [7] |
|
| [8] |
|
| [9] |
|
| [10] |
|
| [11] |
|
| [12] |
|
| [13] |
|
| [14] |
|
| [15] |
|
| [16] |
|
| [17] |
|
| [18] |
|
| [19] |
|
| [20] |
|
| [21] |
|
| [22] |
|
| [23] |
|
| [24] |
|
| [25] |
|
| [26] |
|
| [27] |
|
| [28] |
|
| [29] |
|
| [30] |
|
| [31] |
|
| [32] |
|
| [33] |
|
| [34] |
|
| [35] |
|
| [36] |
|
| [37] |
|
| [38] |
|
| [39] |
|
/
| 〈 |
|
〉 |

