Journal of Tropical Oceanography
Home
Journal
About journal
Editorial board
Indexed-in
Scope
Academic ethics
Honor
Fee and remuneration standards
Open access policy
Copyright Statement
Articles
Current issue
Volumes
Accepted
Archive
Special topics
Most access
Most read
Most cited
Authors
Submission guidelines
Paper template
FAQ
Map examination
Manuscript progress inquiry
Online submission
Review progress
Review
Review policy
Editor-in-chief
Peer review
Editor Login
Staff Login
Download
Subscribe
Contact
中文
Search
E-mail
RSS
Online submission
Editor-in-chief
Peer review
Staff Login
Image/Table Caption
Advanced options
Journals
Article DOI
ALL
Journal of Tropical Oceanography
Publication Year From
Publication Year To
FromYear
2009
2010
2011
2012
2013
2014
2015
2016
2017
2018
2019
2020
2021
2022
2023
2024
2025
ToYear
2025
2024
2023
2022
2021
2020
2019
2018
2017
2016
2015
2014
2013
2012
2011
2010
2009
Volume
Issue
Author
Institution
Journals
Publication Years
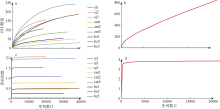
Fig. 1 Rarefaction curves of natural algal (a) and ATS system algal (b), and Shannon curves of natural algal (c) and ATS system algal (d)
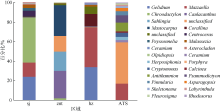
Fig. 2 Distributions of dominant alga on the genus level
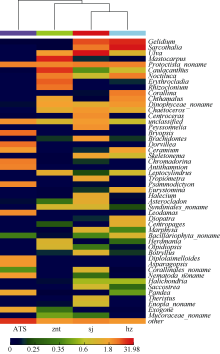
Fig. 3 Heatmap of the algal community on the genus level
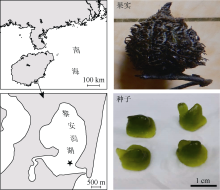
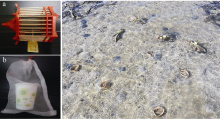
Fig. 1 Planting location (black star), fruit and seeds of
Enhalus acoroides
in Li’an Lagoon
Fig. 2 Planting unit of
Enhalus acoroides
seeds: a) grasshopper cage, b) planting unit by mesh bag protection and c) planting plot
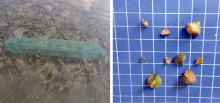
Fig. 3 The bitten seeds of
Enhalus acoroides
in the fish traps
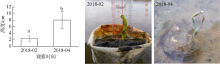
Fig. 4 Variation in seedling height of
Enhalus acoroides
Tab. 1 PCR primers information for different ribosomal RNA gene fragments and Genbank accessions
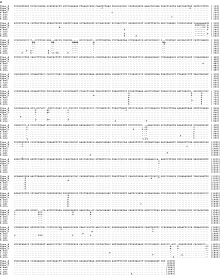
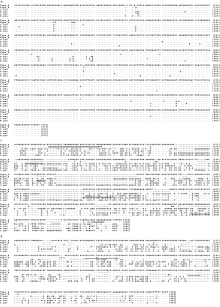
Fig. 1 Comparison of different types of four ribosomal RNA gene fragments from
Crossorhombus kobensis
with four species from family Bothidae. a) Three types of 18S rDNA; * showed the indel sites and differential sites among Types A, B and C; b) two types of 28S rDNA; * showed the indel sites in Type A and Type B; c) two types of ITS1 sequences; the grey shadow presents deleted fragments in Type B; d) two types of ITS2 sequences; the loci with underlines were microsatellites. A. mac presented
A. macrolophus;
C. azu presented
C. azureus;
E. gra presented
E. grandisquama;
L. gal presented
L. gallus
续图一
Tab. 2 Information of ribosomal RNA gene sequences in
Crossorhombus kobensis
genome
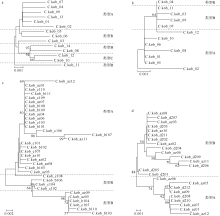
Fig. 2 The cluster trees constructed based on 18S rDNA (a), 28S rDNA (b), ITS1 (c), and ITS2 (d) sequences in
Crossorhombus kobensis
by neighbor-joining method. Numbers on internal branches indicate support values (≥50%)
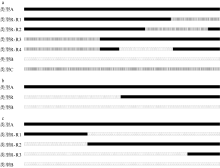
Fig. 3 The recombination patterns of ribosomal RNA genes in
C. kobensis.
a) Four recombination types of 18S rDNA; b) one recombination type of 28S rDNA; c) three recombination types of ITS1. Type A was presented by black; Type B was presented by dark dot; Type C was presented by vertical lines
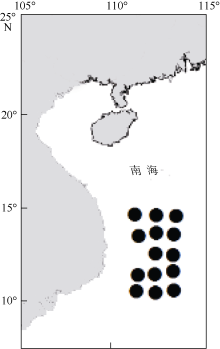
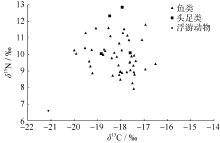
Fig.1 The central western South China Sea, and sampling stations
Tab. 1 The length range,
δ
13
C value,
δ
15
N value, and trophic level (TL) of fishery organisms in the central western South China Sea
Fig. 2 Stable isotope biplots of
δ
13
C and
δ
15
N values of major fishery species in the central western South China Sea
Tab. 2 Stable isotope metrics values of main fishery in the central western South China Sea
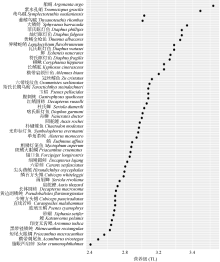
Fig. 3 The trophic levels of major fishery species in the central western South China Sea
Tab. 3 Different body length (mantle length) of fishery biological trophic level ( TL)
Tab. 1 Microanalysis instruments for single-grain detrital minerals
page
Page 1 of 328
Total 6548 records
First page
Prev page
Next page
Last page