
Journal of Tropical Oceanography ›› 2023, Vol. 42 ›› Issue (1): 124-134.doi: 10.11978/2022021CSTR: 32234.14.2022021
Previous Articles Next Articles
Anisotropic structure in the back arc region, Taranaki, New Zealand*
CAO Lingmin1,2( ), ZHAO Liang3,4, ZHAO Minghui1,2,4, QIU Xuelin1,2,4, YUAN Huaiyu5,6
- 1. Key Laboratory of Ocean and Marginal Sea Geology, South China Sea Institute of Oceanology, Chinese Academy of Sciences, Guangzhou 510301, China
2. Southern Marine Science and Engineering Guangdong Laboratory (Guangzhou), Guangzhou 511458, China
3. State Key Laboratory of Lithospheric Evolution, Institute of Geology and Geophysics, Chinese Academy of Sciences, Beijing 100029, China
4. University of Chinese Academy of Sciences, Beijing 100049, China
5. ARC Centre of Excellence for Core to Crust Fluid Systems, Department of Earth and Environmental Sciences, Macquarie University, North Ryde NSW 2109, Australia
6. Centre for Exploration Targeting, University of Western Australia, Crawley Perth WA 6009, Australia
-
Received:2022-01-31Revised:2022-04-12Online:2023-01-10Published:2022-04-08 -
Contact:CAO Lingmin. email:cao_lingmin@126.com -
Supported by:Strategic Priority Research Program of the Chinese Academy of Sciences(XDB42020103); National Natural Science Foundation of China(42076068); National Natural Science Foundation of China(91858212); National Natural Science Foundation of China(91958212); Key Special Project for Introduced Talents Team of Southern Marine Science and Engineering Guangdong Laboratory (Guangzhou)(GML2019ZD0204)
Cite this article
CAO Lingmin, ZHAO Liang, ZHAO Minghui, QIU Xuelin, YUAN Huaiyu. Anisotropic structure in the back arc region, Taranaki, New Zealand*[J].Journal of Tropical Oceanography, 2023, 42(1): 124-134.
share this article
Add to citation manager EndNote|Reference Manager|ProCite|BibTeX|RefWorks
图a
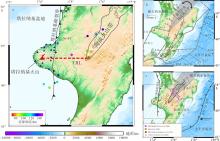
Regional tectonic setting of the Hikurangi subduction zone and locations of 41 broadband seismometers used in this study. (a) Triangles represent all the seismometers among which the blue ones yield final reliable splitting measurements. Local events are shown as circles, and colored according to the depth ranging from 70 km to 150 km. The TRL (Taranaki-Ruapehu Line) is marked by the dashed red line. (b) Predicted relative motion (indicated by arrows) across block boundaries (in mm·a-1) made by Wallace and Beavan (2004). Ellipses show the uncertainties of the estimates; plus and minus signify extension and contraction, respectively. (c) Regional tectonic setting of the North Island of New Zealand. Dotted contours of plate interface (in km) are taken from Williams et al (2013). Colored bars represent previous XKS splitting results (Marson-Pidgeon et al, 1999; Greve et al, 2008; Zal, 2020). The black arrow shows the absolute plate motion vector (Beavan et al, 2002). The black rectangle marks the study area"

图a
Tab. 1
List of 41 broadband seismometer stations in the Taranaki region used in this study"
| 台站 | 东经/° | 南纬/° | 台站 | 东经/° | 南纬/° | |
|---|---|---|---|---|---|---|
| ALBT | 174.13 | 39.15 | NOPT | 174.49 | 38.95 | |
| AOTT | 174.80 | 39.25 | NOWT | 174.29 | 39.61 | |
| BRET | 174.48 | 39.32 | OMUT | 174.02 | 39.54 | |
| BROT | 174.19 | 38.99 | OPUT | 173.84 | 39.41 | |
| CART | 174.02 | 39.19 | PIKT | 174.46 | 39.07 | |
| CHET | 174.35 | 39.40 | PITT | 174.14 | 39.07 | |
| CLMT1 | 174.24 | 39.37 | PUET | 173.91 | 39.51 | |
| CROT | 174.24 | 39.06 | PUKT1 | 174.59 | 39.04 | |
| DOVT | 173.91 | 39.19 | PUNT | 174.02 | 39.29 | |
| HOLT | 174.56 | 39.43 | SAUT | 173.94 | 39.25 | |
| INGT | 174.46 | 39.60 | STAT | 174.35 | 39.32 | |
| INST | 174.18 | 39.54 | TAVT | 174.46 | 39.51 | |
| KERT | 174.25 | 39.09 | TIRT | 174.33 | 39.51 | |
| LHUT | 174.24 | 39.45 | TOET1 | 174.36 | 39.13 | |
| LTET | 174.61 | 39.34 | TORT | 174.45 | 39.14 | |
| LWHT | 174.07 | 39.47 | UNGT | 173.95 | 39.33 | |
| MAGT | 174.61 | 39.34 | WANT | 173.97 | 39.45 | |
| MATT1 | 174.57 | 39.14 | WAST | 174.33 | 39.00 | |
| MOKT1 | 174.58 | 38.97 | WINT | 174.13 | 39.58 | |
| MTET1 | 174.61 | 39.34 | YORT | 174.25 | 39.28 | |
| NGAT | 174.11 | 39.24 |
Tab. 1
Tab. 2
Information of local events"
| 序号 | 发震时间 | 南纬 /° | 东经 /° | 深度/km | 深度误差/km | 震级 | |
|---|---|---|---|---|---|---|---|
| 日期 | 时刻 | ||||||
| 1 | 2002-04-14 | 23:49:43 | 39.94 | 174.55 | 110.7 | 2.7 | 3.8 |
| 2 | 2002-04-21 | 7:23:13 | 40.08 | 174.30 | 92.6 | 3.9 | 3.9 |
| 3 | 2002-05-06 | 20:51:48 | 39.77 | 174.59 | 132.1 | 3.6 | 3.8 |
| 4 | 2002-05-16 | 17:16:12 | 38.73 | 175.83 | 126.2 | 2.3 | 5.0 |
| 5 | 2002-05-26 | 13:05:23 | 39.15 | 175.54 | 99.7 | 1.9 | 4.0 |
| 6 | 2002-07-25 | 14:02:09 | 39.25 | 175.02 | 149.7 | 2.8 | 3.9 |
| 7 | 2002-07-27 | 20:36:20 | 38.77 | 175.55 | 133.4 | 3.1 | 4.0 |
| 8 | 2002-08-12 | 9:10:32 | 38.60 | 176.05 | 132.8 | 2.4 | 4.0 |
| 9 | 2002-08-22 | 17:51:17 | 39.99 | 174.11 | 113.4 | 3.2 | 3.5 |
Tab. 2

图a
An example of local S-wave splitting measurement using the MFAST program at station NOPT: (a) S phase on incoming polarization direction (p) and its perpendicular value (p⊥) before anisotropic correction; (b) the waveforms after correction; (c) and (d) normalized fast (solid lines) and slow (dashed lines) shear-wave waveforms before and after the splitting correction, respectively; (e) particle motion in the selected window (gray zones in (a)); (f) particle motion in the selected window (gray zones in (b)); (g) results of grid search for optimal φ and δt (cross). Event information and values of splitting measurements are shown at the top right. Location of the station is shown in Fig. 1"
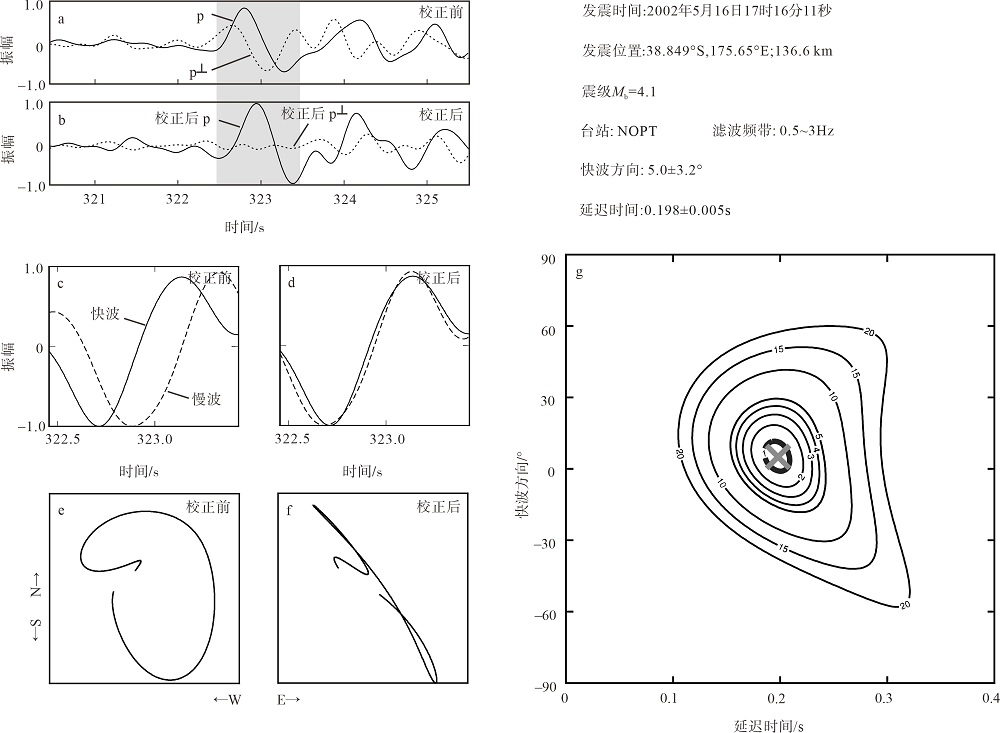
图a
Tab. 3
Summary of local S splitting parameters by station"
| 台站 | 地震序号 | Δt/s | δt误差/s | φ/° | φ误差/° | 台站 | 地震序号 | Δt/s | δt误差/s | φ/° | φ误差/° | |
|---|---|---|---|---|---|---|---|---|---|---|---|---|
| ALBT | 4 | 0.16 | 0.027 | 21 | 6.5 | NOWT | 2 | 0.08 | 0.008 | 49 | 8 | |
| BROT | 4 | 0.13 | 0.007 | 40 | 2.75 | OMUT | 2 | 0.27 | 0.008 | 27 | 6.5 | |
| CHET | 5 | 0.12 | 0.009 | 73 | 2.75 | OPUT | 9 | 0.10 | 0.009 | 70 | 6.5 | |
| DOVT | 2 | 0.11 | 0.015 | 77 | 4 | PIKT | 5 | 0.17 | 0.004 | 40 | 1 | |
| LWHT | 2 | 0.22 | 0.003 | 12 | 5.5 | PITT | 6 | 0.12 | 0.006 | 73 | 5 | |
| MOKT1 | 7 | 0.14 | 0.005 | 4 | 2 | STAT | 1 | 0.11 | 0.050 | 31 | 6.25 | |
| MOKT1 | 8 | 0.33 | 0.016 | 1 | 1.75 | STAT | 3 | 0.06 | 0.004 | 17 | 9.25 | |
| NOPT | 4 | 0.20 | 0.005 | 5 | 3.25 | TOET1 | 5 | 0.12 | 0.018 | 39 | 4.75 | |
| NOPT | 6 | 0.19 | 0.007 | 14 | 2.25 | TORT | 7 | 0.32 | 0.003 | 10 | 2.25 |
Tab. 3
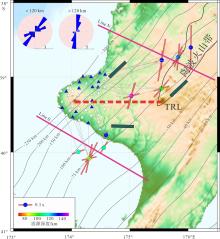
Fig. 3
All the S-phase splitting measurement results in the Taranaki region. Triangles represent all the stations used in this study, in which the blue ones yield final reliable splitting measurements. Each red-orange bar is plotted at the location of the event (circle colored according to the depth) and represents a single measurement. Orientation of each bar is parallel to measured fast polarization; length is scaled according to delay time. Raypaths between events and stations are delineated with dotted grey lines. Equal-area rose diagrams of S-phase polarizations of results from events above and below the depth of 120 km are shown in the top left corner of the map, respectively. Sectors are drawn every 15°, with areas proportional to the number of polarizations in those directions. The number to the bottom right of each circle represents maximum petal length (the number of polarizations in the corresponding direction). Dotted contours of plate interface (in km) are from Williams et al (2013). Dark green bars show SHmax orientations calculated from focal mechanisms (Townend et al, 2012). TRL marked as a red dotted line is labeled in Fig. 1. Pink lines (Line N and Line S) denote location of schematic model profiles in Fig. 5"

Fig. 3
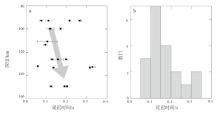
Fig. 4
Plots of depth versus delay time (a) and histogram of magnitudes of delay times (b). In (a), black rectangles with black bars denote the delay times and their errors. Grey arrow indicates that delay times increase with depths"
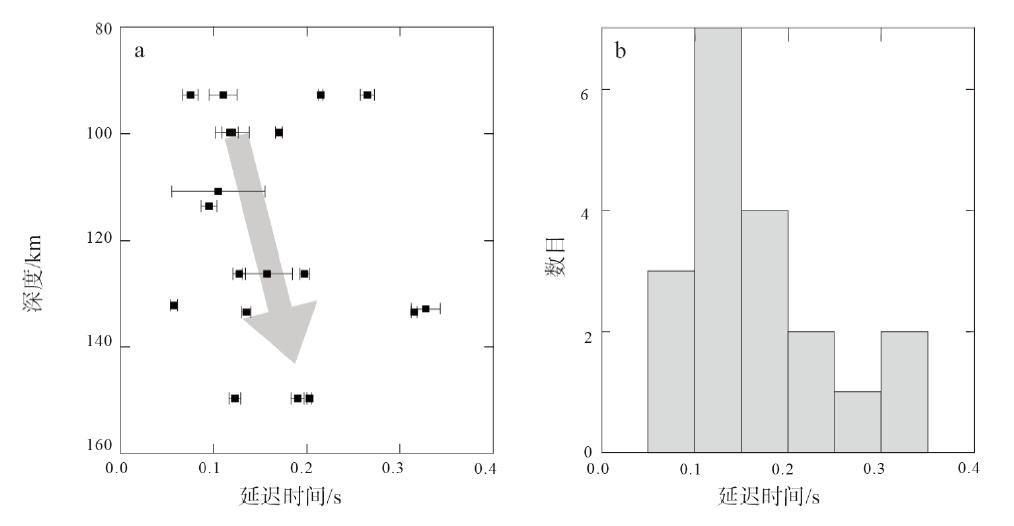
Fig. 4

Fig. 5
Schematic of possible anisotropic models along Line N and Line S. Locations of the profiles are shown in Fig. 3. Solid and dotted lines represent raypaths from part of events with depth >120 km and <120 km (within a 30 km width of each profile), respectively. “?” in (b) indicates that deep mantle wedge deformation is unknown due to small delay time from only one event with depth >120 km to the south of TRL"
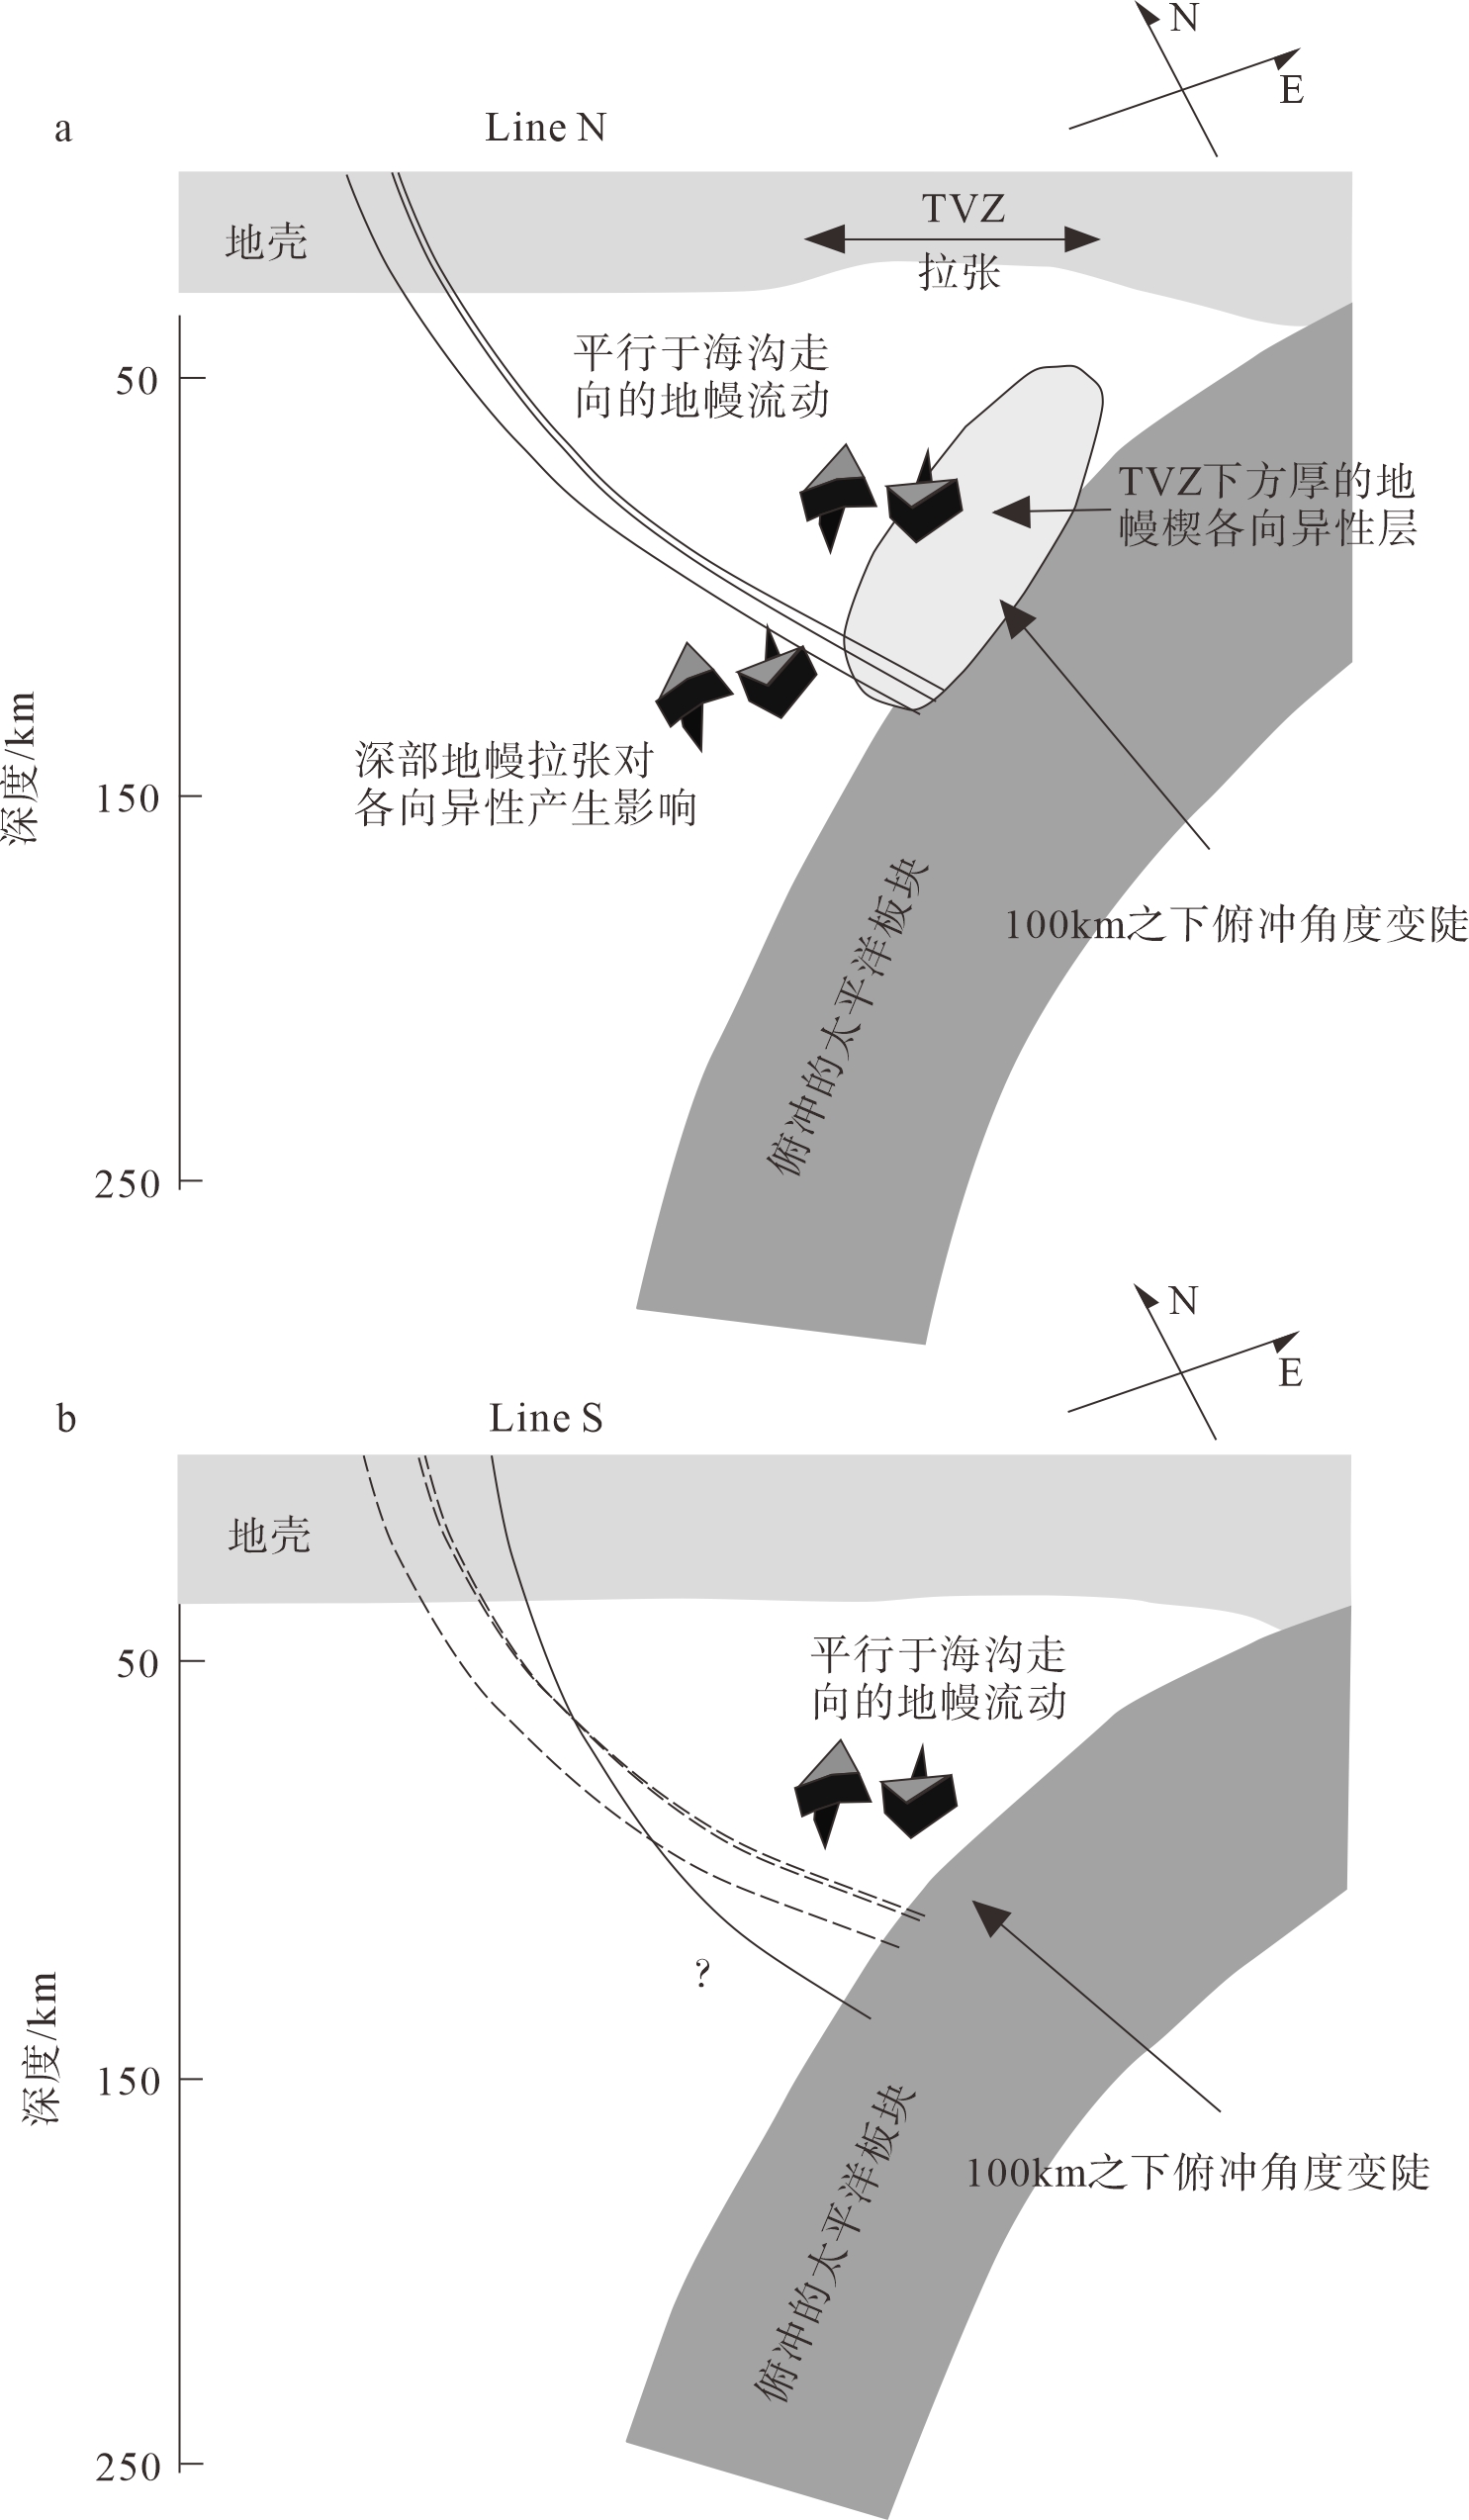
Fig. 5
| [1] |
常利军, 王椿镛, 丁志峰, 2006. 云南地区SKS波分裂研究[J]. 地球物理学报, 49(1): 197-204.
|
|
|
|
| [2] |
高原, 刘希强, 梁维, 等, 2004. 剪切波分裂系统分析方法(SAM)软件系统[J]. 中国地震, 20(1): 101-107.
|
|
|
|
| [3] |
宋晓晓, 李春峰, 2016. 西太平洋科学大洋钻探的地球动力学成果[J]. 热带海洋学报, 35(1): 17-30.
doi: 10.11978/2014121 |
|
doi: 10.11978/2014121 |
|
| [4] |
doi: 10.1029/2003JB002932 |
| [5] |
doi: 10.1029/2001JB000282 |
| [6] |
doi: 10.1111/j.1365-246X.1984.tb05025.x |
| [7] |
doi: 10.1111/gji.1978.53.issue-3 |
| [8] |
doi: 10.1016/0165-2125(81)90026-3 |
| [9] |
doi: 10.1111/j.1365-246X.2009.04491.x |
| [10] |
doi: 10.1130/G38476.1 |
| [11] |
doi: 10.1111/gji.2008.174.issue-1 |
| [12] |
|
| [13] |
doi: 10.1016/0031-9201(95)03118-9 |
| [14] |
doi: 10.1016/j.tecto.2007.07.011 |
| [15] |
doi: 10.1038/203629a0 |
| [16] |
doi: 10.1016/j.pepi.2004.08.022 |
| [17] |
doi: 10.1029/2019GC008529 |
| [18] |
doi: 10.1016/S0191-8141(01)00005-0 |
| [19] |
doi: 10.1126/science.1062235 |
| [20] |
doi: 10.1146/earth.2008.36.issue-1 |
| [21] |
doi: 10.1130/G20805.1 |
| [22] |
|
| [23] |
doi: 10.1126/science.1150809 pmid: 18202286 |
| [24] |
doi: 10.1016/j.epsl.2010.06.036 |
| [25] |
doi: 10.1002/jgrb.50063 |
| [26] |
|
| [27] |
doi: 10.1029/2004gl021190 |
| [28] |
doi: 10.1080/00288306.1989.10425711 |
| [29] |
doi: 10.1029/2006TC002090 |
| [30] |
|
| [31] |
doi: 10.1785/BSSA0510020237 |
| [32] |
|
| [33] |
doi: 10.1111/gji.2012.188.issue-3 |
| [34] |
doi: 10.1111/gji.2011.186.issue-1 |
| [35] |
doi: 10.1029/2010JB007722 |
| [36] |
|
| [37] |
doi: 10.1111/gji.2005.162.issue-2 |
| [38] |
|
| [39] |
doi: 10.1111/gji.1994.119.issue-3 |
| [40] |
|
| [41] |
doi: 10.1111/j.1365-246X.1987.tb01674.x |
| [42] |
doi: 10.1130/G34028.1 |
| [43] |
doi: 10.1080/00288306.1987.10552618 |
| [44] |
doi: 10.1111/bre.1992.4.issue-3-4 |
| [45] |
|
| [46] |
doi: 10.1111/gji.2006.166.issue-1 |
| [47] |
doi: 10.1785/0120030123 |
| [48] |
|
| [49] |
doi: 10.1029/JB084iB03p01049 |
| [50] |
|
| [51] |
|
| [52] |
doi: 10.1007/s000240050291 |
| [53] |
|
| [54] |
doi: 10.1785/0220130035 |
| [55] |
doi: 10.1016/0012-821X(86)90116-0 |
| [56] |
|
| [57] |
doi: 10.1038/375774a0 |
| [58] |
|
| [1] | Jiazheng ZHANG, Jianping ZHOU, Minghui ZHAO, Xuelin QIU. Progress and prospect of anisotropic study of hydrothermal field (49º39'E) on the Southwest Indian Ridge [J]. Journal of Tropical Oceanography, 2017, 36(6): 71-81. |
|
||