

Journal of Tropical Oceanography ›› 2026, Vol. 45 ›› Issue (4): 153-161.doi: 10.11978/2025163CSTR: 32234.14.2025163
• Marine Environmental Science • Previous Articles Next Articles
Distribution characteristics and main sources of nitrate in the waters of Qinzhou Bay*
LOU Zhifeng1,2,3( ), LI Yuchen1,2,3, YIN Xuehua1,2,3, SUN Rong1,2, TIAN Chongguo1,2,4()
- 1
Key Laboratory of Coastal Environmental Processes and Ecological Remediation ,Yantai Institute of Coastal Zone Research, Chinese Academy of Sciences
2Shandong Key Laboratory of Coastal Environmental Processes
3University of Chinese Academy of Sciences
4Key Laboratory of Land and Sea Ecological Governance and Systematic Regulation ,Shandong Academy for Environmental Planning
-
Received:2025-09-10Revised:2025-10-20Online:2026-07-10Published:2026-07-31 -
Contact:TIAN Chongguo. email: cgtian@yic.ac.cn -
Supported by:National Natural Science Foundation of China(42177089); Instrument Function Development and Technological Innovation Project of the Chinese Academy of Sciences(E32P030301)

CLC Number:
- P734
Cite this article
LOU Zhifeng, LI Yuchen, YIN Xuehua, SUN Rong, TIAN Chongguo. Distribution characteristics and main sources of nitrate in the waters of Qinzhou Bay*[J].Journal of Tropical Oceanography, 2026, 45(4): 153-161.
share this article
Add to citation manager EndNote|Reference Manager|ProCite|BibTeX|RefWorks
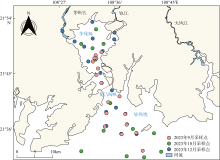
Fig. 1
Geographical locations of sampling sites"
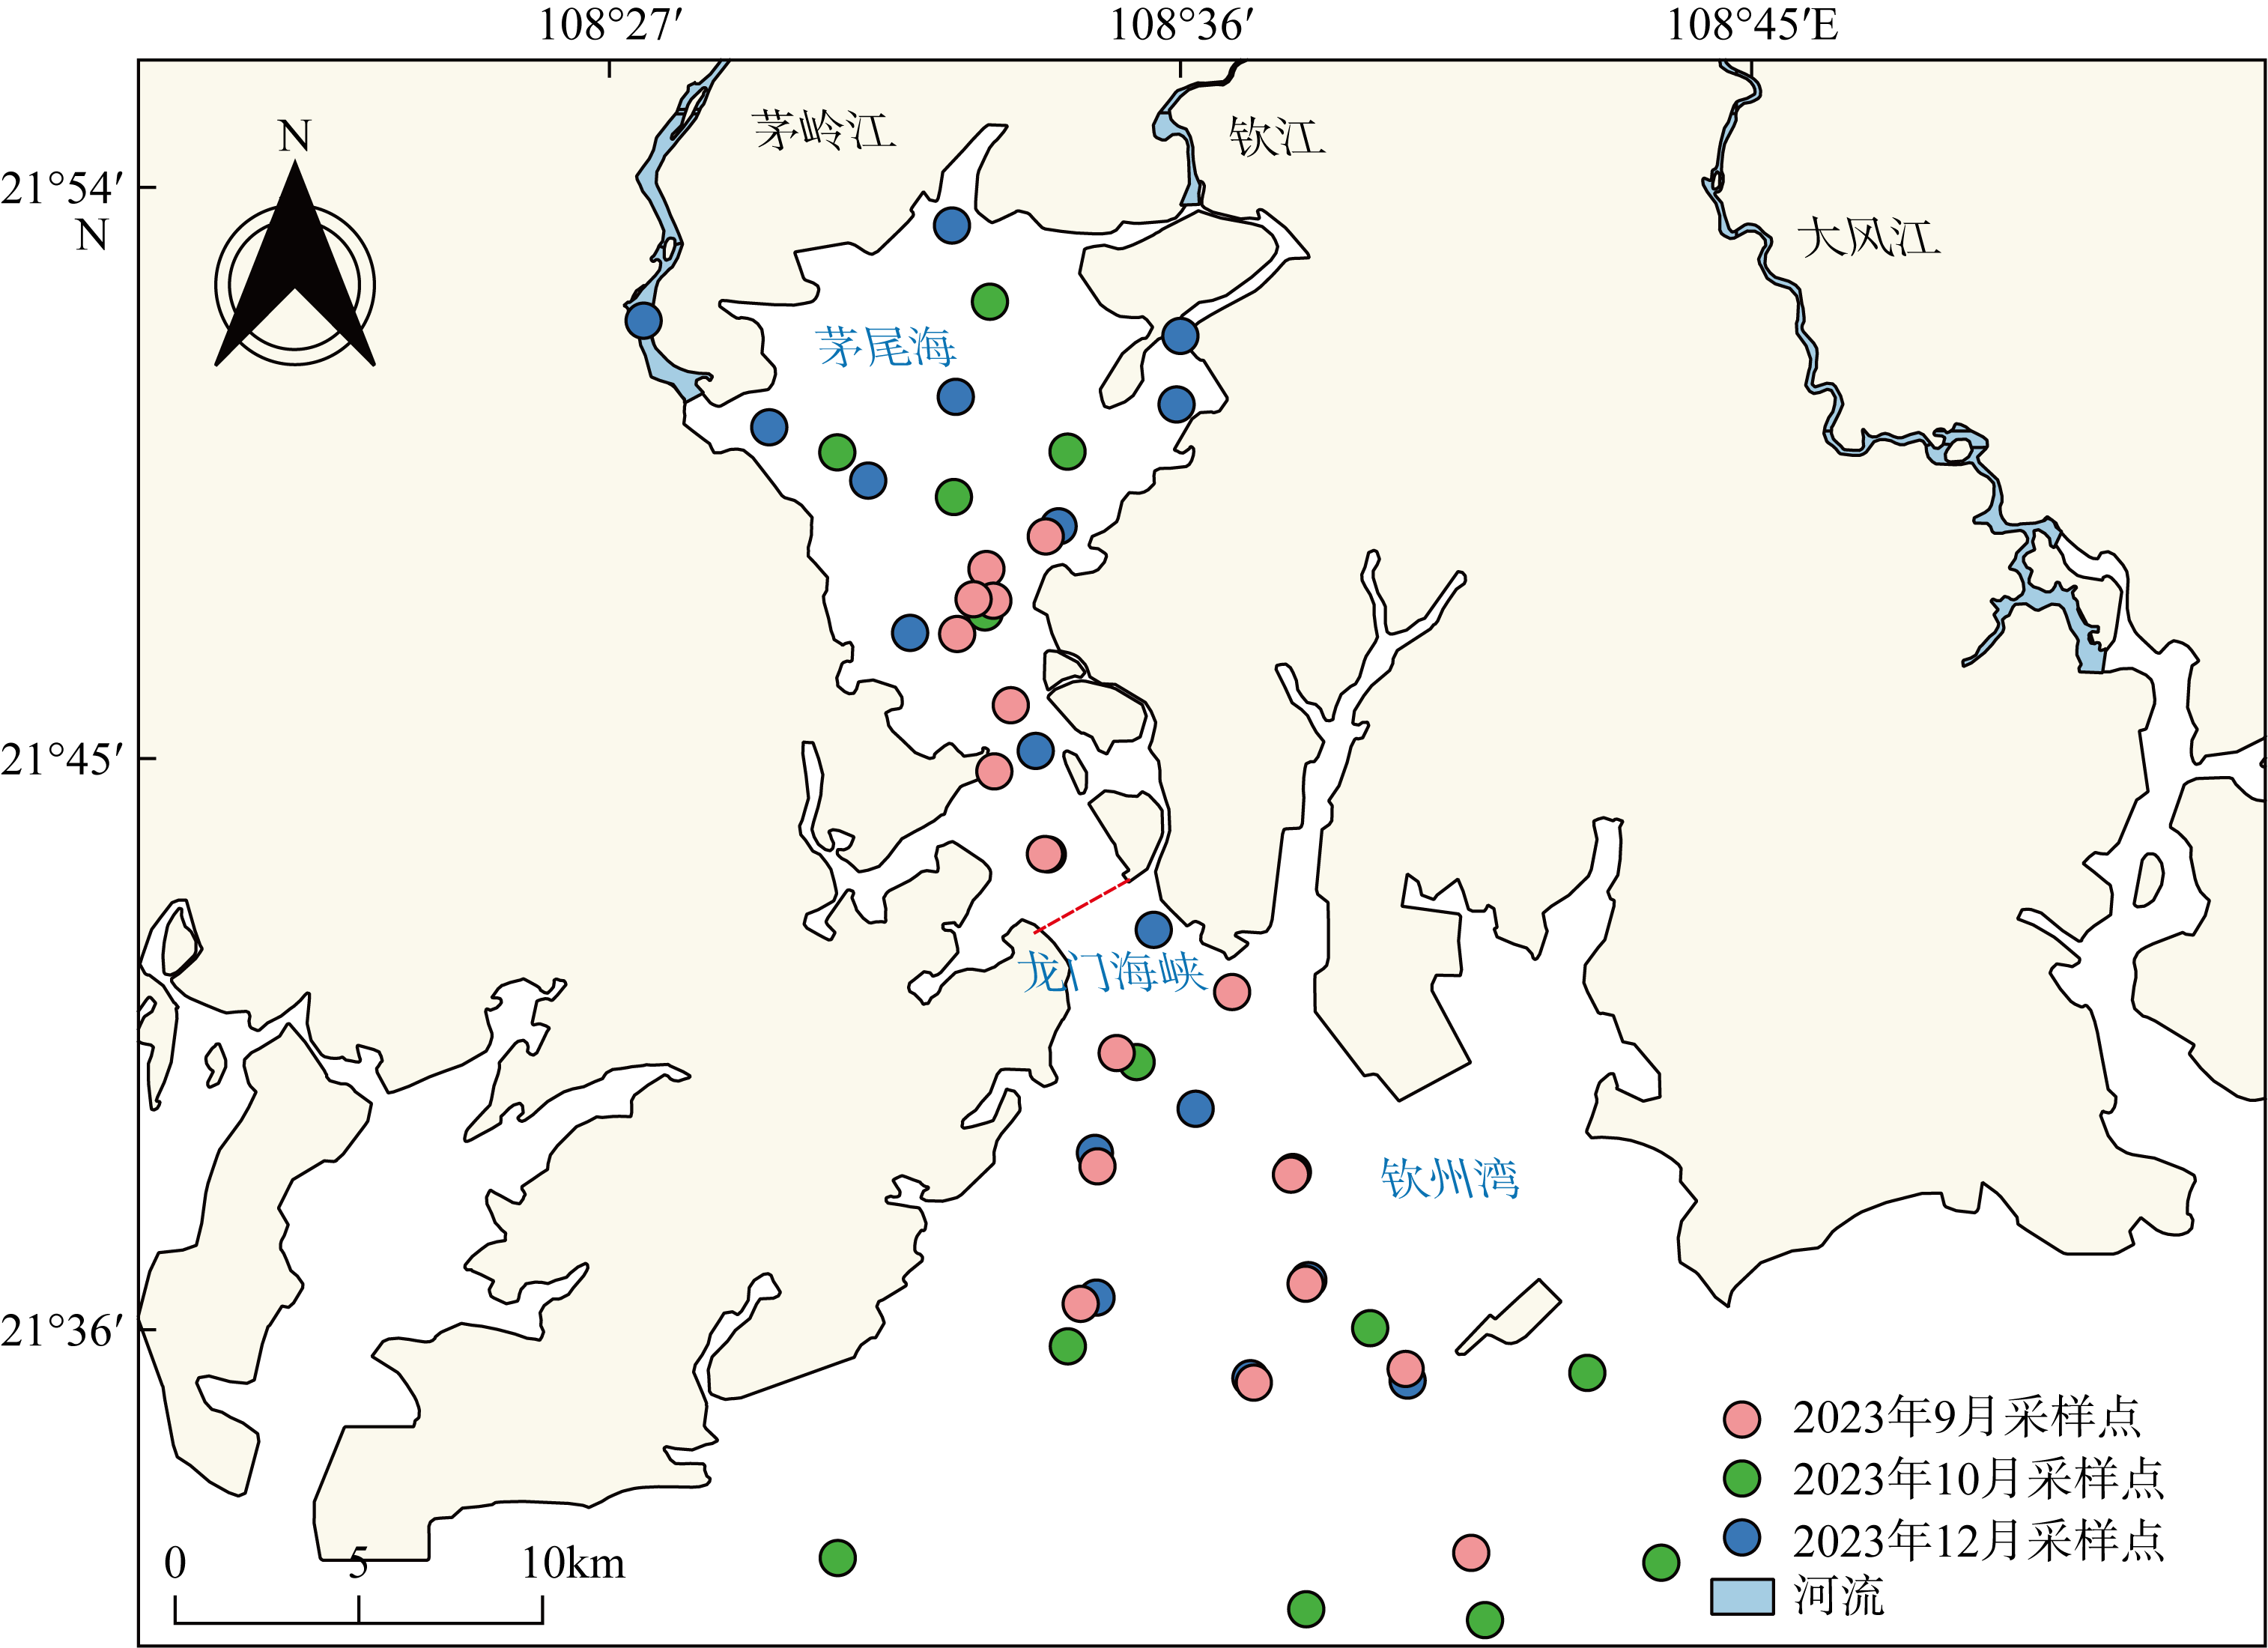
Fig. 1
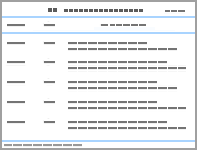
Tab. 1
Spatial distribution of land use types in the Qinzhou Bay"
| 行政单位 | 面积/hm2 | |||||||
|---|---|---|---|---|---|---|---|---|
| 湿地 | 耕地 | 园地 | 林地 | 草地 | 城镇村及工矿用地 | 交通运输 | 水域及水利设施 | |
| 钦南区 | 21805 | 35388 | 4245 | 138865 | 4887 | 19025 | 8131 | 22351 |
| 钦北区 | 151 | 39419 | 20465 | 132793 | 2523 | 13597 | 4770 | 7721 |
| 灵山县 | 63793 | 43562 | 20221 | 3407 | 22878 | 5960 | 10896 | NA |
| 浦北县 | 112 | 31562 | 157888 | 2396 | 13166 | 5532 | 8912 | NA |
| 港口区 | 111 | 10605 | 1420 | 8623 | 2964 | 4393 | NA | NA |
| 防城区 | 4305 | 18688 | 4332 | 187228 | 3603 | 9004 | 3478 | 10754 |
| 上思县 | 116 | 49370 | 3801 | 205999 | 2059 | 4645 | 2997 | 11034 |
| 东兴市 | 9154 | 4126 | 3351 | 30688 | 715 | 4124 | 1451 | 5167 |
| 总计 | 99547 | 232720 | 215723 | 709999 | 52795 | 66280 | 40635 | 57027 |
| 占比 | 6.75% | 15.78% | 14.63% | 48.14% | 3.58% | 4.49% | 2.76% | 3.87% |
Tab. 1
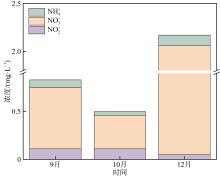
Fig. 2
Monthly variations in DIN component concentrations in the Qinzhou Bay"
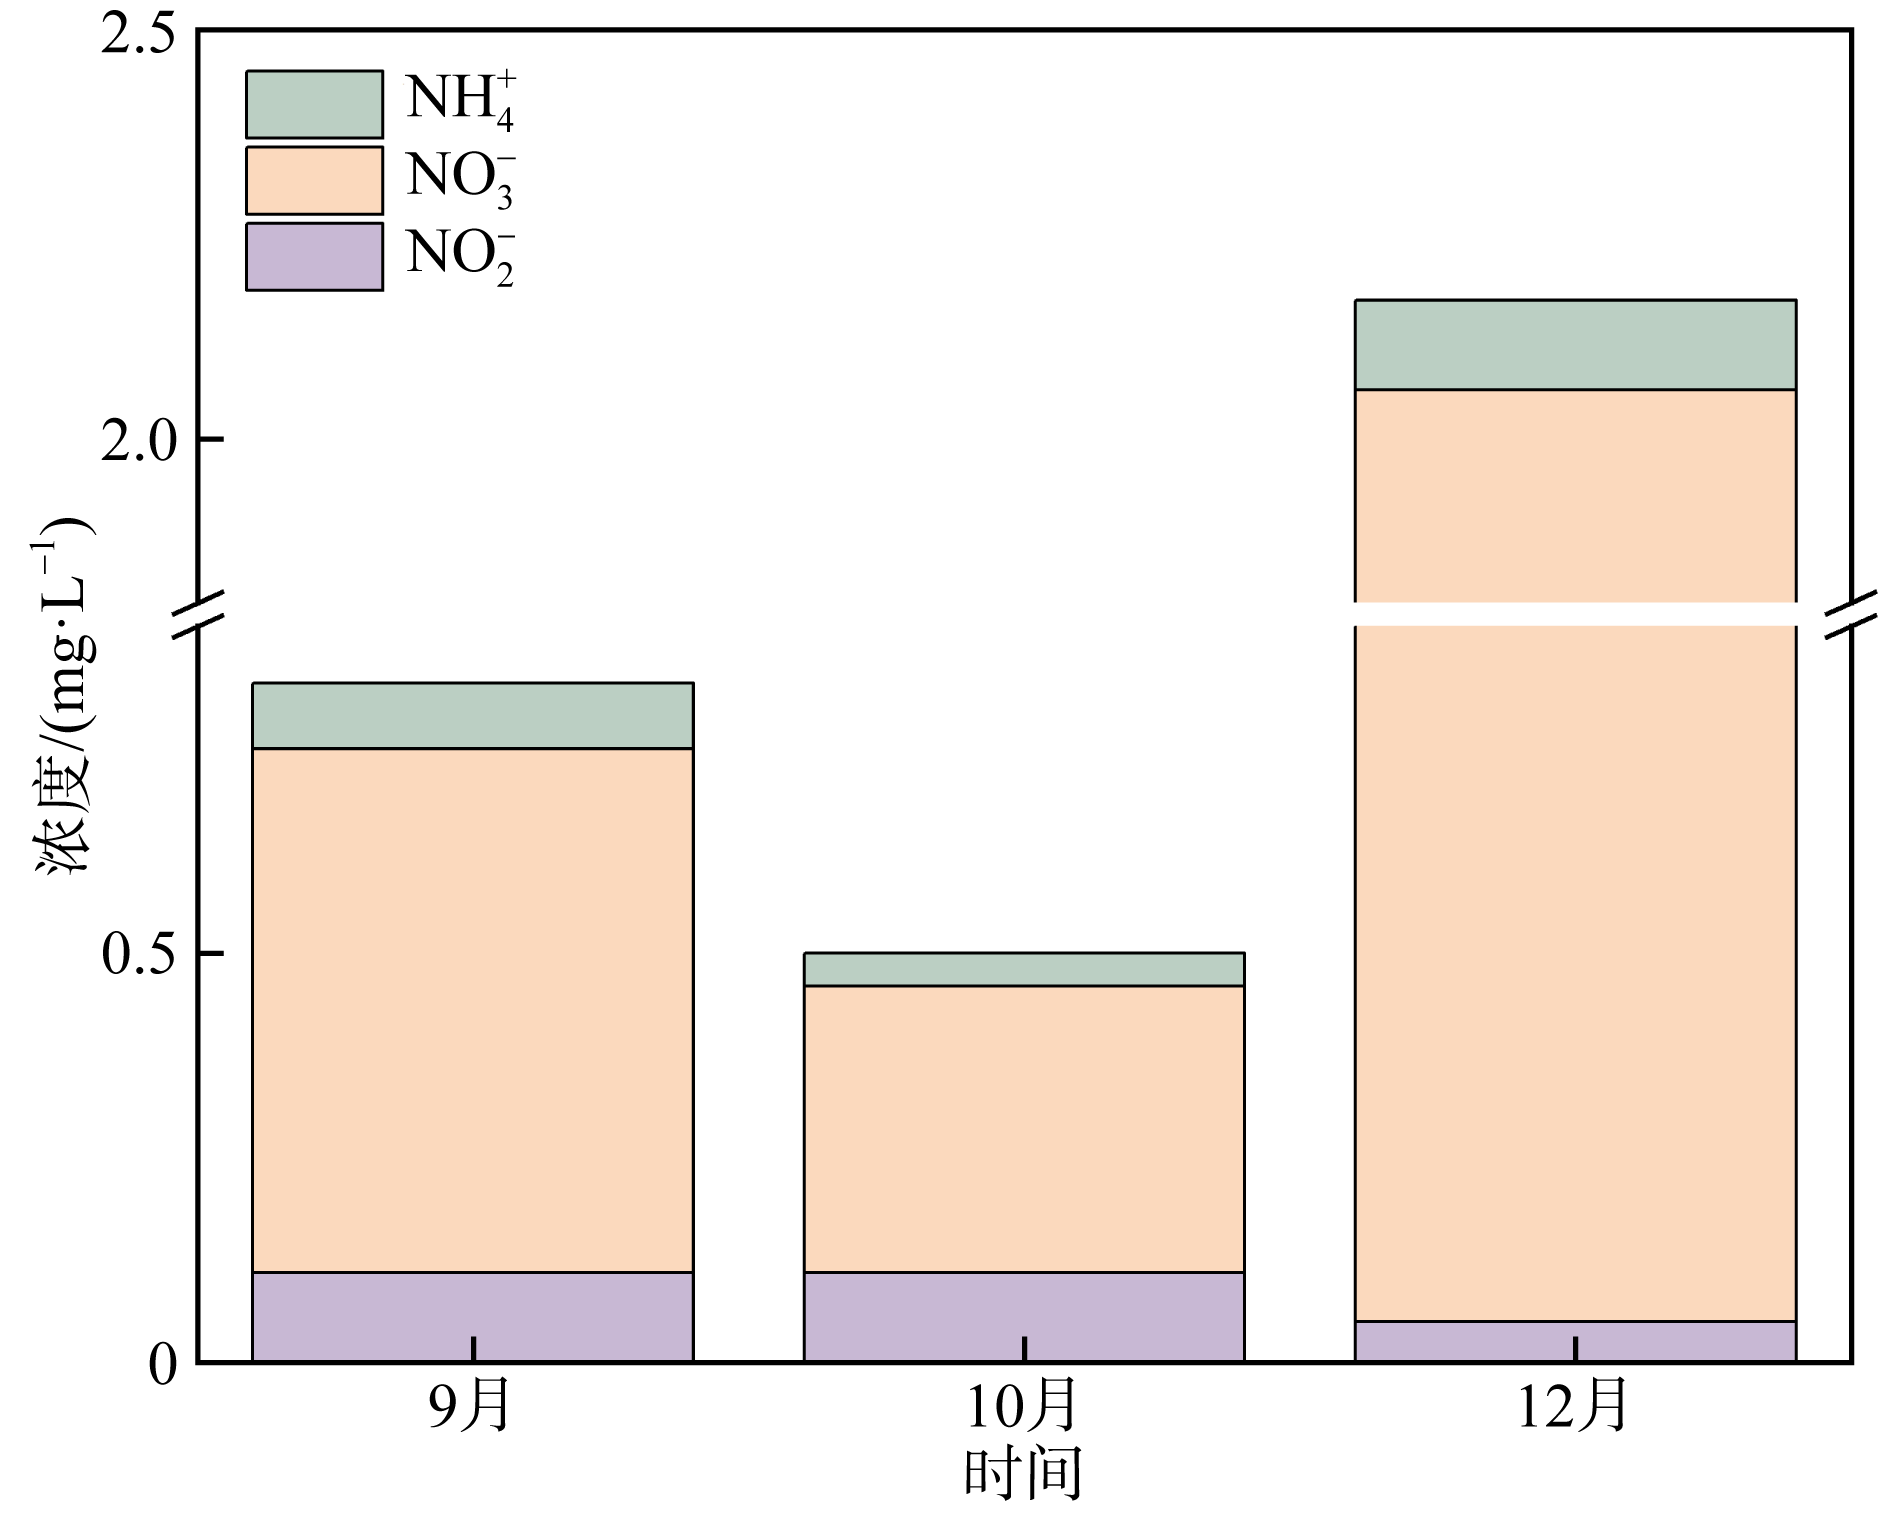
Fig. 2
Fig. 3
Spatiotemporal distribution of $\text{NO}_{3}^{-}$ concentrations (${{C}_{\text{NO}_{3}^{-}}}$) in the Qinzhou Bay"
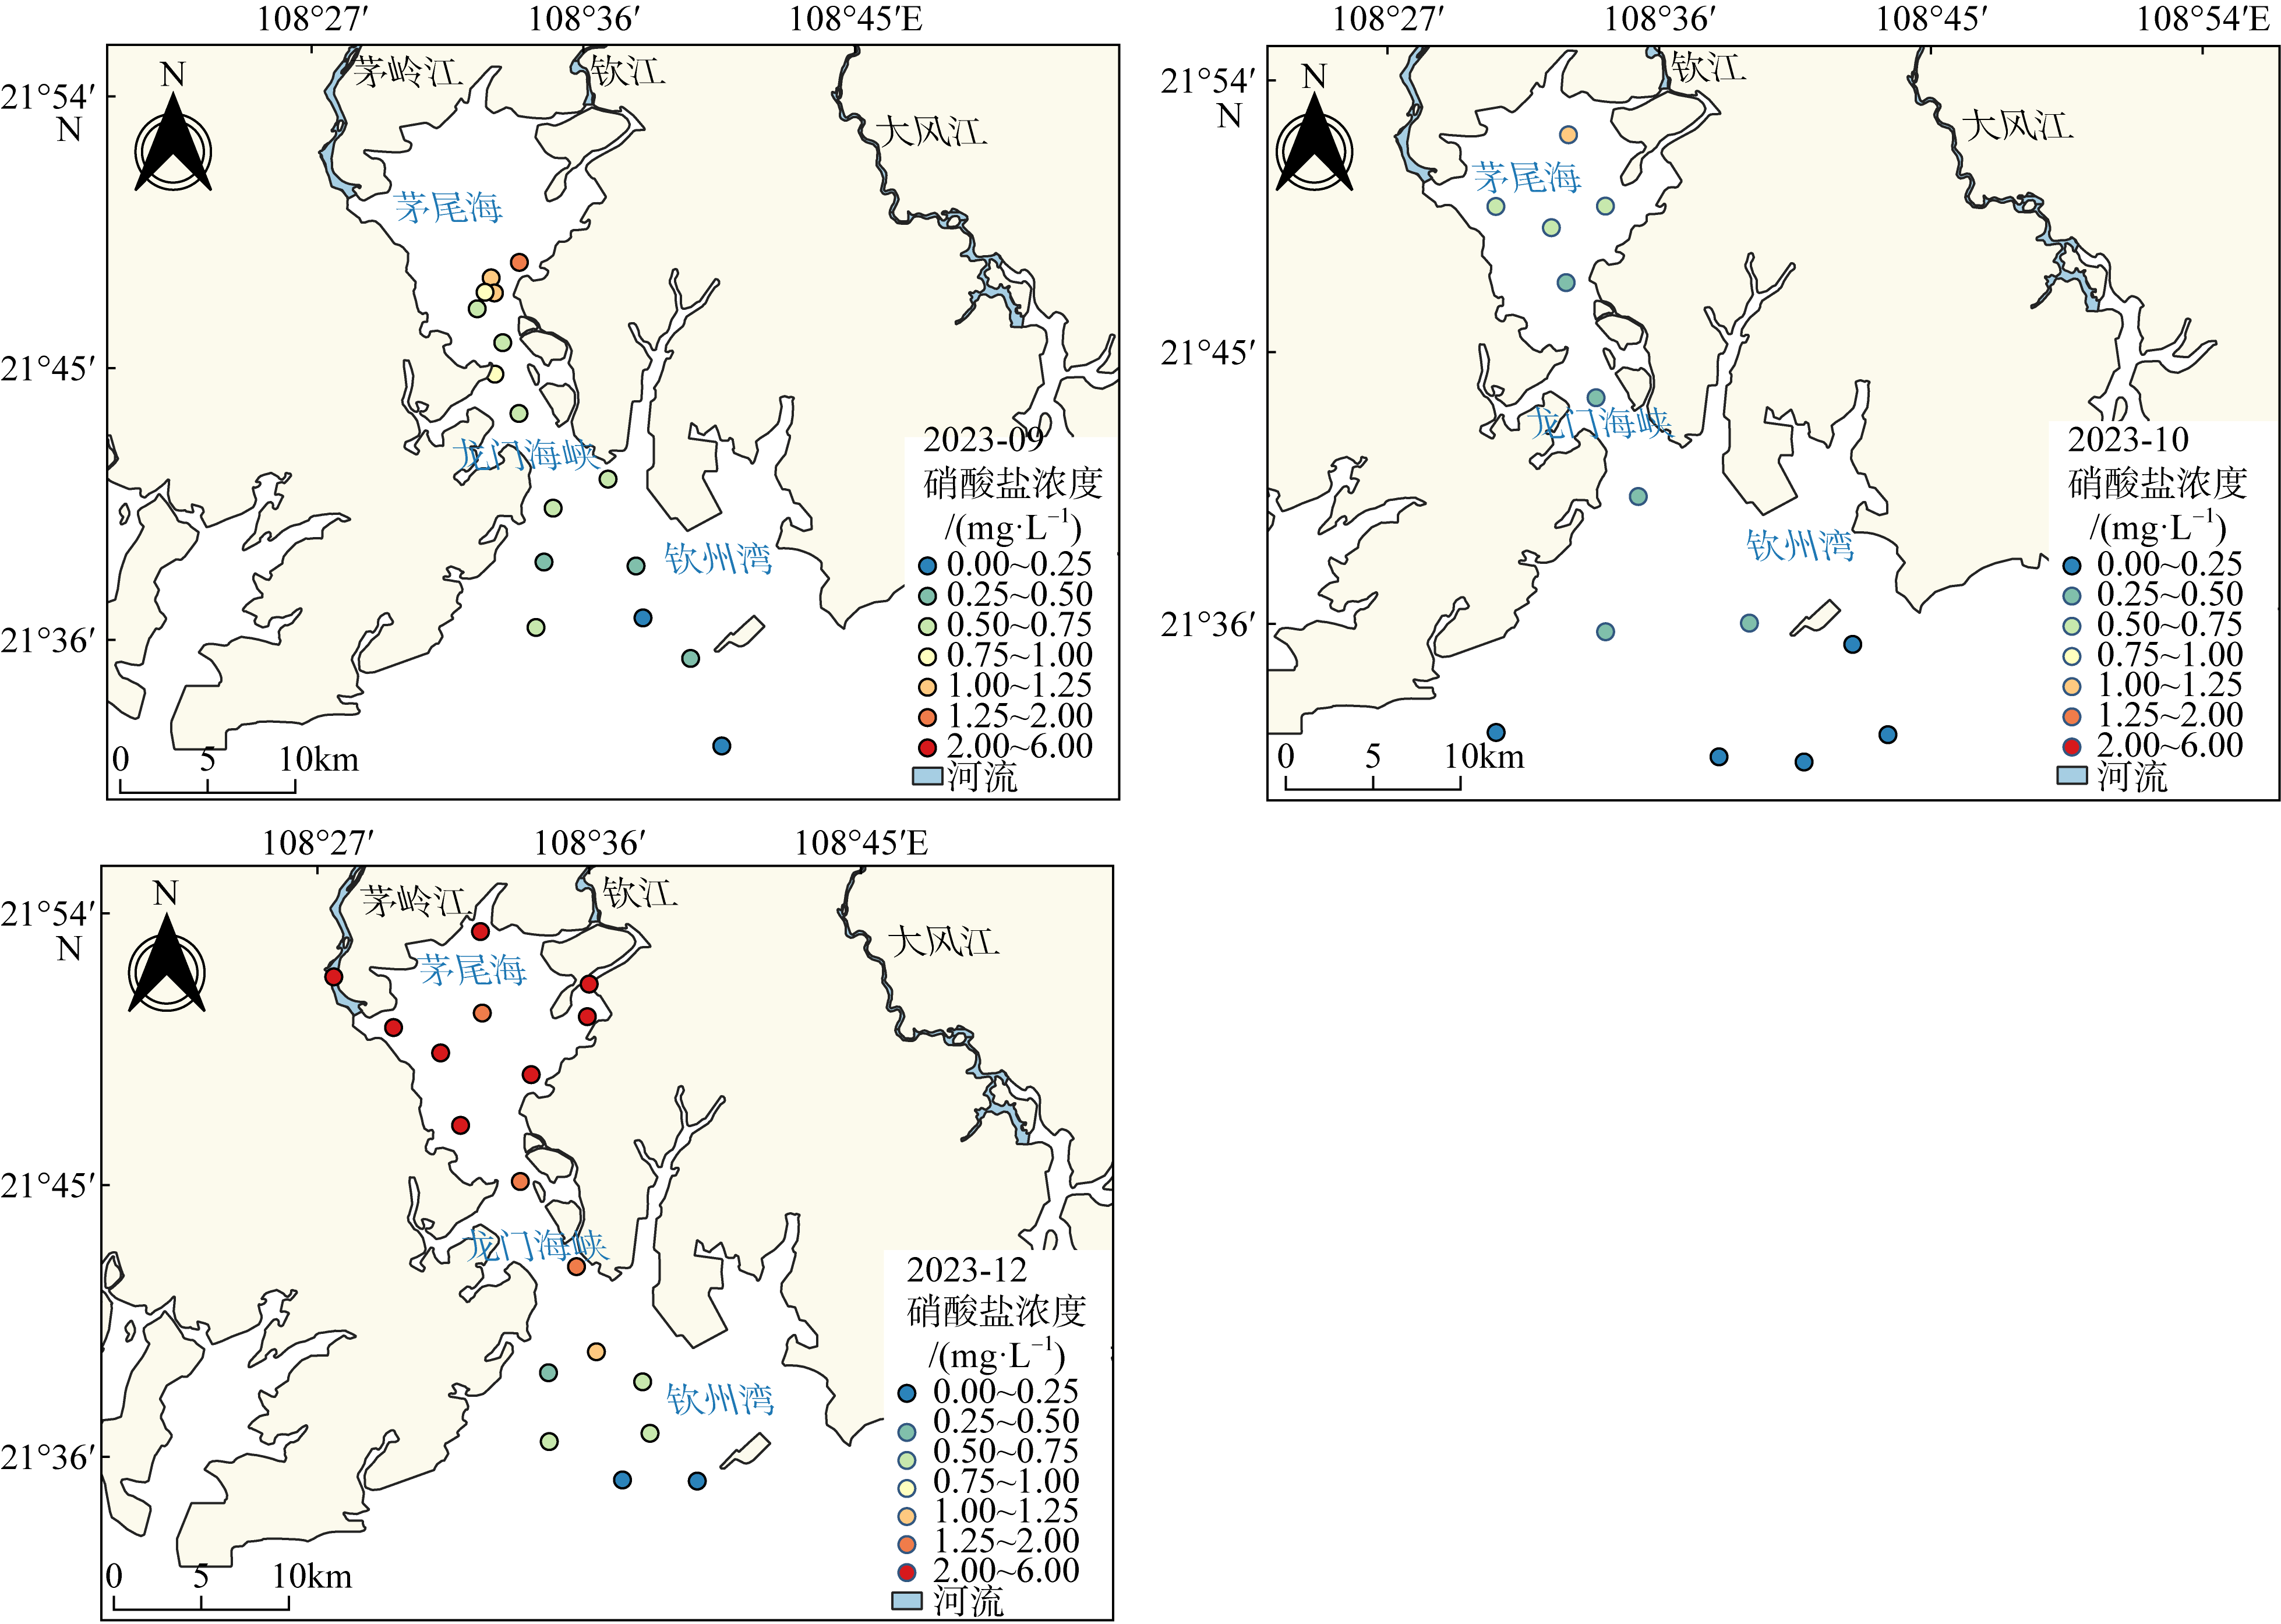
Fig. 3
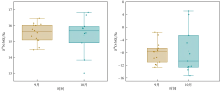
Fig. 4
Values of ${{\text{ }\!\!\delta\!\!\text{ }}^{15}}\text{N-NO}_{3}^{-}$ and ${{\text{ }\!\!\delta\!\!\text{ }}^{18}}\text{O-NO}_{3}^{-}$ in September and October"

Fig. 4
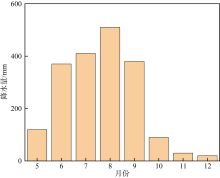
Fig. 5
Distribution of rainfall in the Qinzhou Bay from May to December 2023"
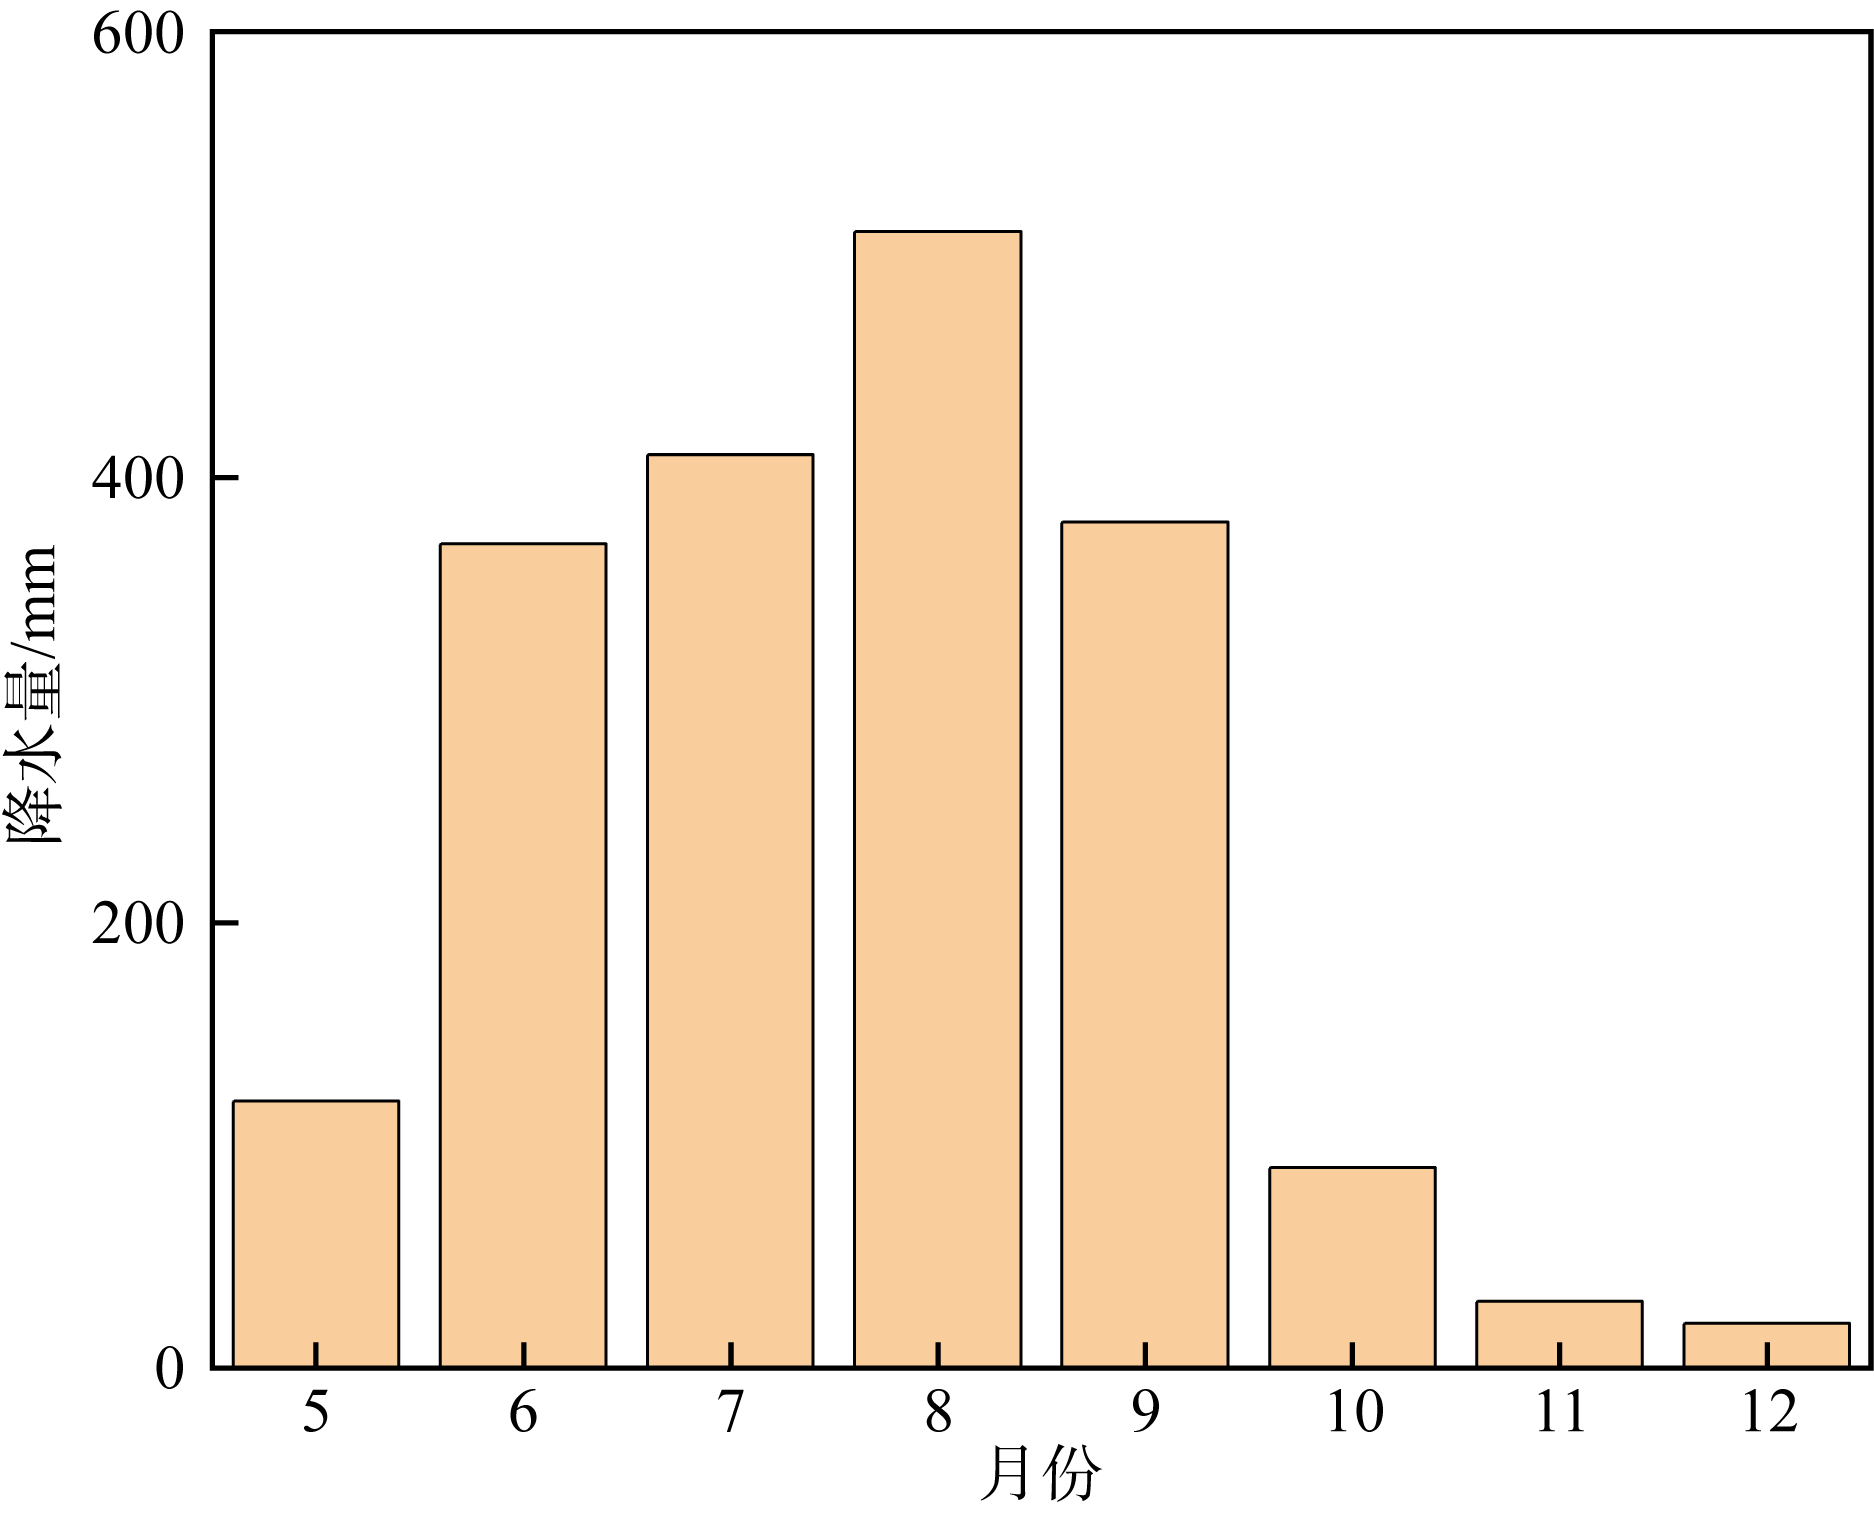
Fig. 5
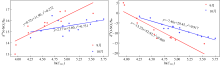
Fig. 6
Relationship between ${{\text{ }\!\!\delta\!\!\text{ }}^{15}}\text{N-NO}_{3}^{-}$ and ${{\text{ }\!\!\delta\!\!\text{ }}^{18}}\text{O-NO}_{3}^{-}$ and $\ln ({{C}_{\text{NO}_{3}^{-}}})$"
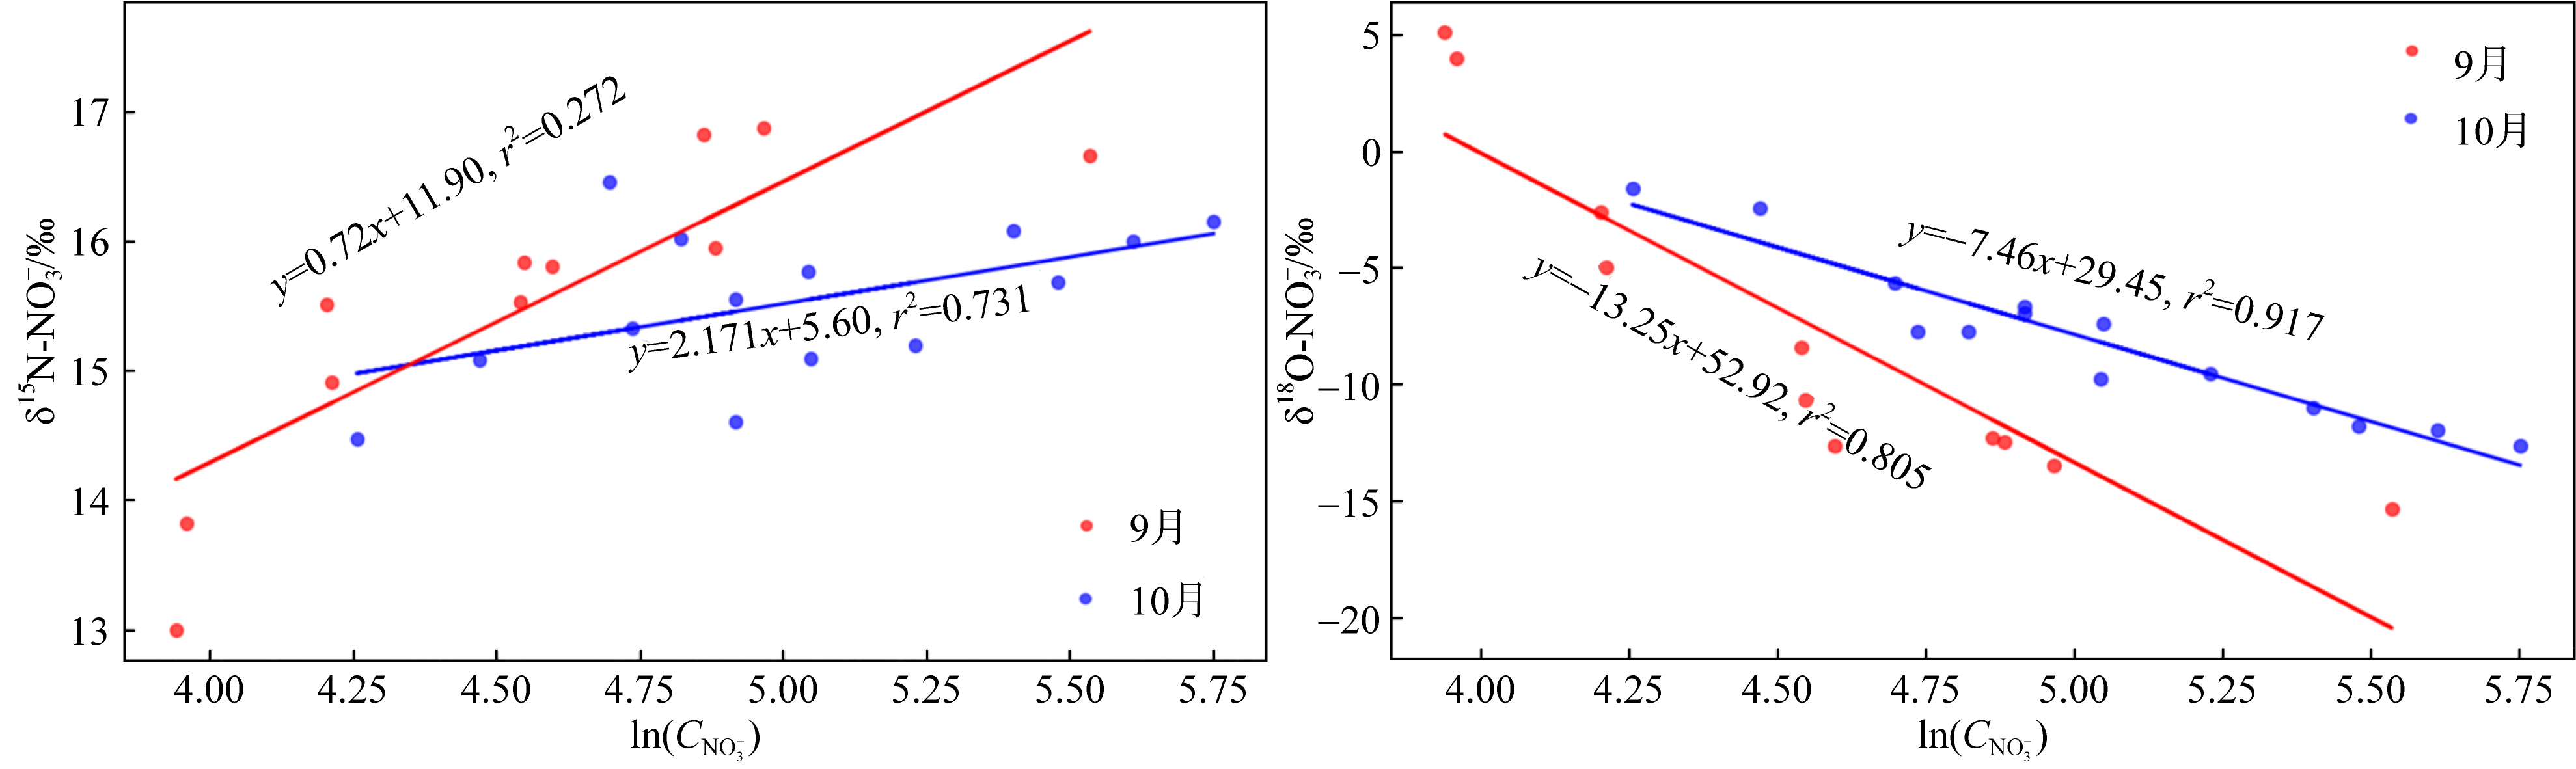
Fig. 6
Tab. 2
Source signatures of nitrogen and oxygen isotopes for potential pollutants in the Qinzhou Bay area"
| 来源 | 15N平均值±标准差/‰ | 18O平均值±标准差/‰ |
|---|---|---|
| 大气沉降 | 0.80±1.50 | 52.40±5.10 |
| 化肥 | 0.04±1.87 | 4.08±0.33 |
| 土壤氮 | 4.52±2.67 | 4.08±0.33 |
| 粪肥和污水 | 10.30±4.0 | 4.08±0.33 |
Tab. 2
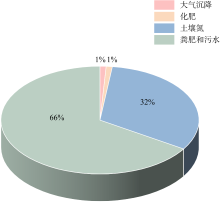
Fig. 7
Contribution rates of $\text{NO}_{3}^{-}$ various sources in the Qinzhou Bay"
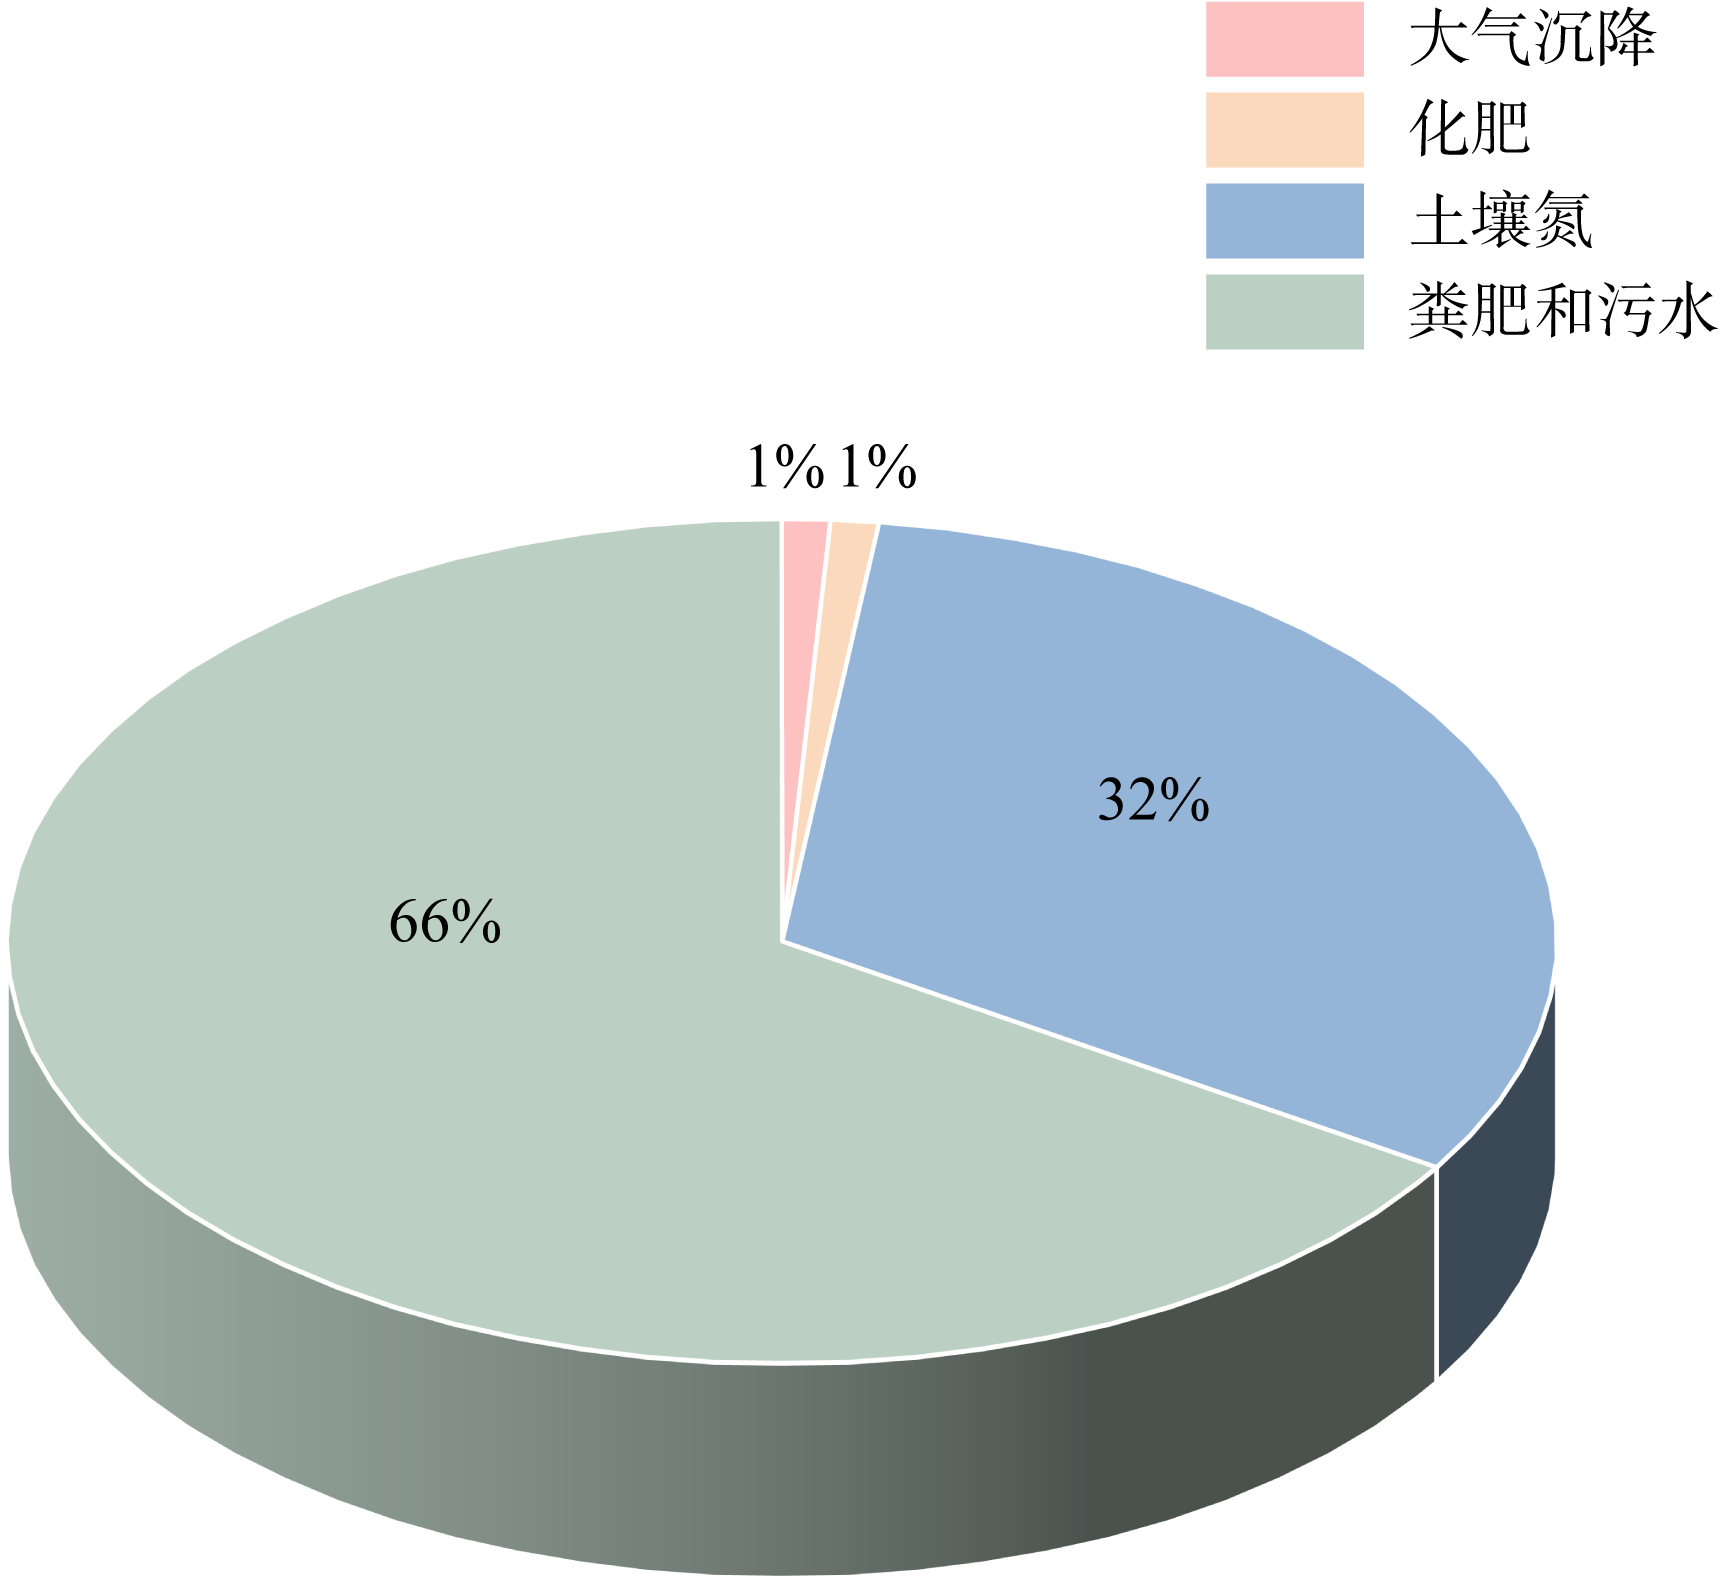
Fig. 7
| [1] |
陈燕, 彭梦微, 李莉梅, 等, 2024. 钦州湾2011-2021年营养盐年际变化趋势分析[J]. 环境科学导刊, 43(4): 88-91.
|
|
|
|
| [2] |
邓明月, 朱静敏, 王薛平, 等, 2025. 钦州湾与上游河流的微塑料时空分布及影响因素分析[J]. 海洋环境科学, 44(1): 10-16.
|
|
|
|
| [3] |
国家环境保护局, 国家海洋局, 1998. GB3097-1997海水水质标准[S]. 北京: 中国标准出版社.
|
|
State Oceanic Administration, State Environmental Protection Administration, 1998. Seawater quality standard (GB3097-1997)[S]. Beijing: Standards Press of China (in Chinese).
|
|
| [4] |
李萍, 郭钊, 莫海连, 等, 2018. 广西近岸海域营养盐时空分布及潜在性富营养化程度评价[J]. 海洋湖沼通报, 40(3): 148-156.
|
|
|
|
| [5] |
李智滔, 肖红伟, 伍作亭, 等, 2022. 基于水化学及氮氧同位素技术的硝酸盐来源解析: 以鄱阳湖湿地为例[J]. 中国环境科学, 42(9): 4315-4322.
|
|
|
|
| [6] |
邱绍芳, 侍茂崇, 陈波, 2003. 钦州湾潮流特征分析[J]. 海洋通报, 22(3): 9-14.
|
|
|
|
| [7] |
任茂兴, 徐阁, 王德鸿, 2021. 海南岛近岸海域表层海水溶解无机氮的浓度组成、分布特征和季节变化[J]. 海南热带海洋学院学报, 28(2): 45-49.
|
|
|
|
| [8] |
王梦竹, 许珊珊, 黎树式, 等, 2026. 人类活动和气候变化影响下钦江近60年悬浮泥沙浓度变化[J]. 热带海洋学报, 45(4): 126-139.
|
|
|
|
| [9] |
王希欢, 杨芳, 马文娟, 等, 2021. 乌梁素海硝酸盐来源的季节性变化[J]. 环境科学研究, 34(5): 1091-1098.
|
|
|
|
| [10] |
杨斌, 冯文慧, 周孝萱, 等, 2025. 茅尾海入海河口区柱状沉积物对磷的吸附行为特征[J]. 渔业科学进展, 46(2):53-63.
|
|
|
|
| [11] |
杨静, 张仁铎, 赵庄明, 等, 2015. 近25年广西北部湾海域营养盐时空分布特征[J]. 生态环境学报, 24(9): 1493-1498.
doi: 10.16258/j.cnki.1674-5906.2015.09.011 |
|
|
|
| [12] |
余芬, 李艳利, 陈奕鸣, 等, 2025. 氮氧同位素技术解析沁河下游氮时空分布及来源[J]. 环境科学学报, 45(6): 178-189.
|
|
|
|
| [13] |
张栋, 2020. 钦州湾营养盐时空变化的影响因素与陆源TDN的量化减排研究[D]. 南宁: 广西大学.
|
|
|
|
| [14] |
张鑫, 张妍, 毕直磊, 等, 2020. 中国地表水硝酸盐分布及其来源分析[J]. 环境科学, 41(4): 1594-1606.
|
|
|
|
| [15] |
中华人民共和国生态环境部, 2020. HJ 442.3-2020近岸海域环境监测技术规范第三部分近岸海域水质监测[S]. 北京: 中国环境出版集团有限公司.
|
|
Ministry of Ecology and Environment the People's Republic of China, 2020. Technical specification for offshore environmental monitoring Part 3 offshore seawater quality monitoring (HJ 442.3-2020)[S]. Beijing: China Environment Publishing Group (in Chinese).
|
|
| [16] |
pmid: 12380811 |
| [17] |
doi: 10.3389/fmars.2022.956474 |
| [18] |
doi: 10.3389/fmars.2022.885037 |
| [19] |
doi: 10.1016/j.geoderma.2017.10.050 |
| [20] |
doi: 10.3389/fmars.2023.1236609 |
| [21] |
doi: 10.1016/j.gexplo.2021.106844 |
| [22] |
doi: 10.1016/j.jhazmat.2022.129480 |
| [23] |
doi: 10.1016/j.watres.2020.116431 |
| [24] |
|
| [25] |
doi: 10.1016/j.scitotenv.2019.01.344 |
| [26] |
doi: 10.1016/j.scitotenv.2022.154183 |
| [27] |
doi: 10.1371/journal.pone.0009672 |
| [28] |
doi: 10.1016/j.gca.2007.05.021 |
| [29] |
doi: 10.7717/peerj.5096 |
| [30] |
doi: S0025-326X(18)30691-X pmid: 30509822 |
| [31] |
doi: 10.2166/nh.2019.012 |
| [32] |
doi: 10.1016/j.watres.2008.12.048 pmid: 19157489 |
| [33] |
doi: 10.1016/j.envpol.2021.117112 |
| [34] |
doi: 10.1016/j.scitotenv.2020.137242 |
| [1] | LI Xinzheng, DU Xiaoli, XU Yong, ZHANG Yue, WANG Jinbao, SUI Jixing, CHEN Dan. Study on the community characteristics of macrozoobenthos and environmental influencing factors in Maowei Sea, Qinzhou Bay during summer and winter* [J]. Journal of Tropical Oceanography, 2026, 45(4): 15-28. |
| [2] | SUN Kangwei, LIAO Riquan, LI Han, WENG Peiyao, TANG Jianhui. Monthly variability of nutrient concentrations and influencing factors in surface seawater of Qinzhou Bay* [J]. Journal of Tropical Oceanography, 2026, 45(4): 162-178. |
| [3] | JIN Song, ZOU Tao, LIAO Riquan, CHEN Chaohao, MI Huan, TANG Jianhui. Study on the spatial expansion mode of raft aquaculture in Qinzhou Bay since 2000 using remote sensing technology [J]. Journal of Tropical Oceanography, 2026, 45(4): 104-115. |
| [4] | JIANG Shihao, LIAO Riquan, NIU Donglei, QIAO Zhen, LU Dongliang, TANG Jianhui. The distribution characteristics, compositions and sources of dissolved organic matter (DOM) in Qinzhou Bay [J]. Journal of Tropical Oceanography, 2026, 45(4): 190-202. |
| [5] | CHEN Tianshu, XIAO Hongwei, GUAN Wenkai, XIAO Huayun. Tracing the sources and formation mechanisms of marine atmospheric nitrate using stable isotopes [J]. Journal of Tropical Oceanography, 2025, 44(3): 167-178. |
| [6] | YANG Liuzhu, YANG Liling, PAN Hongzhou, LIU Chaoqun, YU Fenghua. Characteristics of recent evolution in Qinzhou Bay influenced by human activities [J]. Journal of Tropical Oceanography, 2019, 38(6): 41-50. |
| [7] | ZHANG Jing-jian, ZHAN Wang, LI Ai-fen, ZHANG Cheng-wu. Effects of sodium nitrate concentration on the growth and lipid accumulation of Pseudochlorococcum polymorphum and Pseudochlorococcum typicum [J]. Journal of Tropical Oceanography, 2013, 32(1): 64-69. |
| [8] | LONG Chao, LONG Li-juan. Effects of nitrate and phosphate on the growth and toxin production of Amphidinium klebsii (Sanya strain) [J]. Journal of Tropical Oceanography, 2012, 31(4): 117-123. |
| [9] | JIANG Li-fang, YIN Yi, QI Yi-quan, ZHANG Zhi-xu. The extreme wave parameters in the Qinzhou Bay during typhoon passages [J]. Journal of Tropical Oceanography, 2012, 31(4): 8-16. |
| [10] | ZHANG Bo-hu,CHEN Shen-liang,LIU Yan-xiong,GU Guo-chuan. Sediment characteristics and differentiation in the Qinzhou Bay, Guangxi, China [J]. Journal of Tropical Oceanography, 2011, 30(4): 66-70. |
|
||