
Journal of Tropical Oceanography ›› 2026, Vol. 45 ›› Issue (3): 83-94.doi: 10.11978/2025113CSTR: 32234.14.2025113
Previous Articles Next Articles
Differences in subsurface nonlinear dynamical heating contributions between two types of El Niño under different IPO phases
LI Yuzhen1,2( ), MENG Xiangfeng1,2()
- 1
State Key Laboratory of Physical Oceanography (Ocean University of China)
2College of Oceanic and Atmospheric Sciences ,Ocean University of China
-
Received:2025-07-21Revised:2025-10-19Online:2026-05-10Published:2026-05-28 -
Contact:MENG Xiangfeng. email: mengxf@ouc.edu.cn -
Supported by:National Key Research and Development Program of China(2023YFF0805200); National Natural Science Foundation of China(41976015)
CLC Number:
- P732
Cite this article
LI Yuzhen, MENG Xiangfeng. Differences in subsurface nonlinear dynamical heating contributions between two types of El Niño under different IPO phases[J].Journal of Tropical Oceanography, 2026, 45(3): 83-94.
share this article
Add to citation manager EndNote|Reference Manager|ProCite|BibTeX|RefWorks
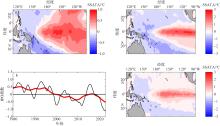
Fig. 1
Spatial modes and time series of the IPO (1980-2020). (a) Spatial mode distribution of the IPO; (b) time series of the IPO index; (c) SSTA distribution during peak months of El Niño events in positive IPO phases; (d) SSTA distribution during peak months of El Niño events in negative IPO phases"
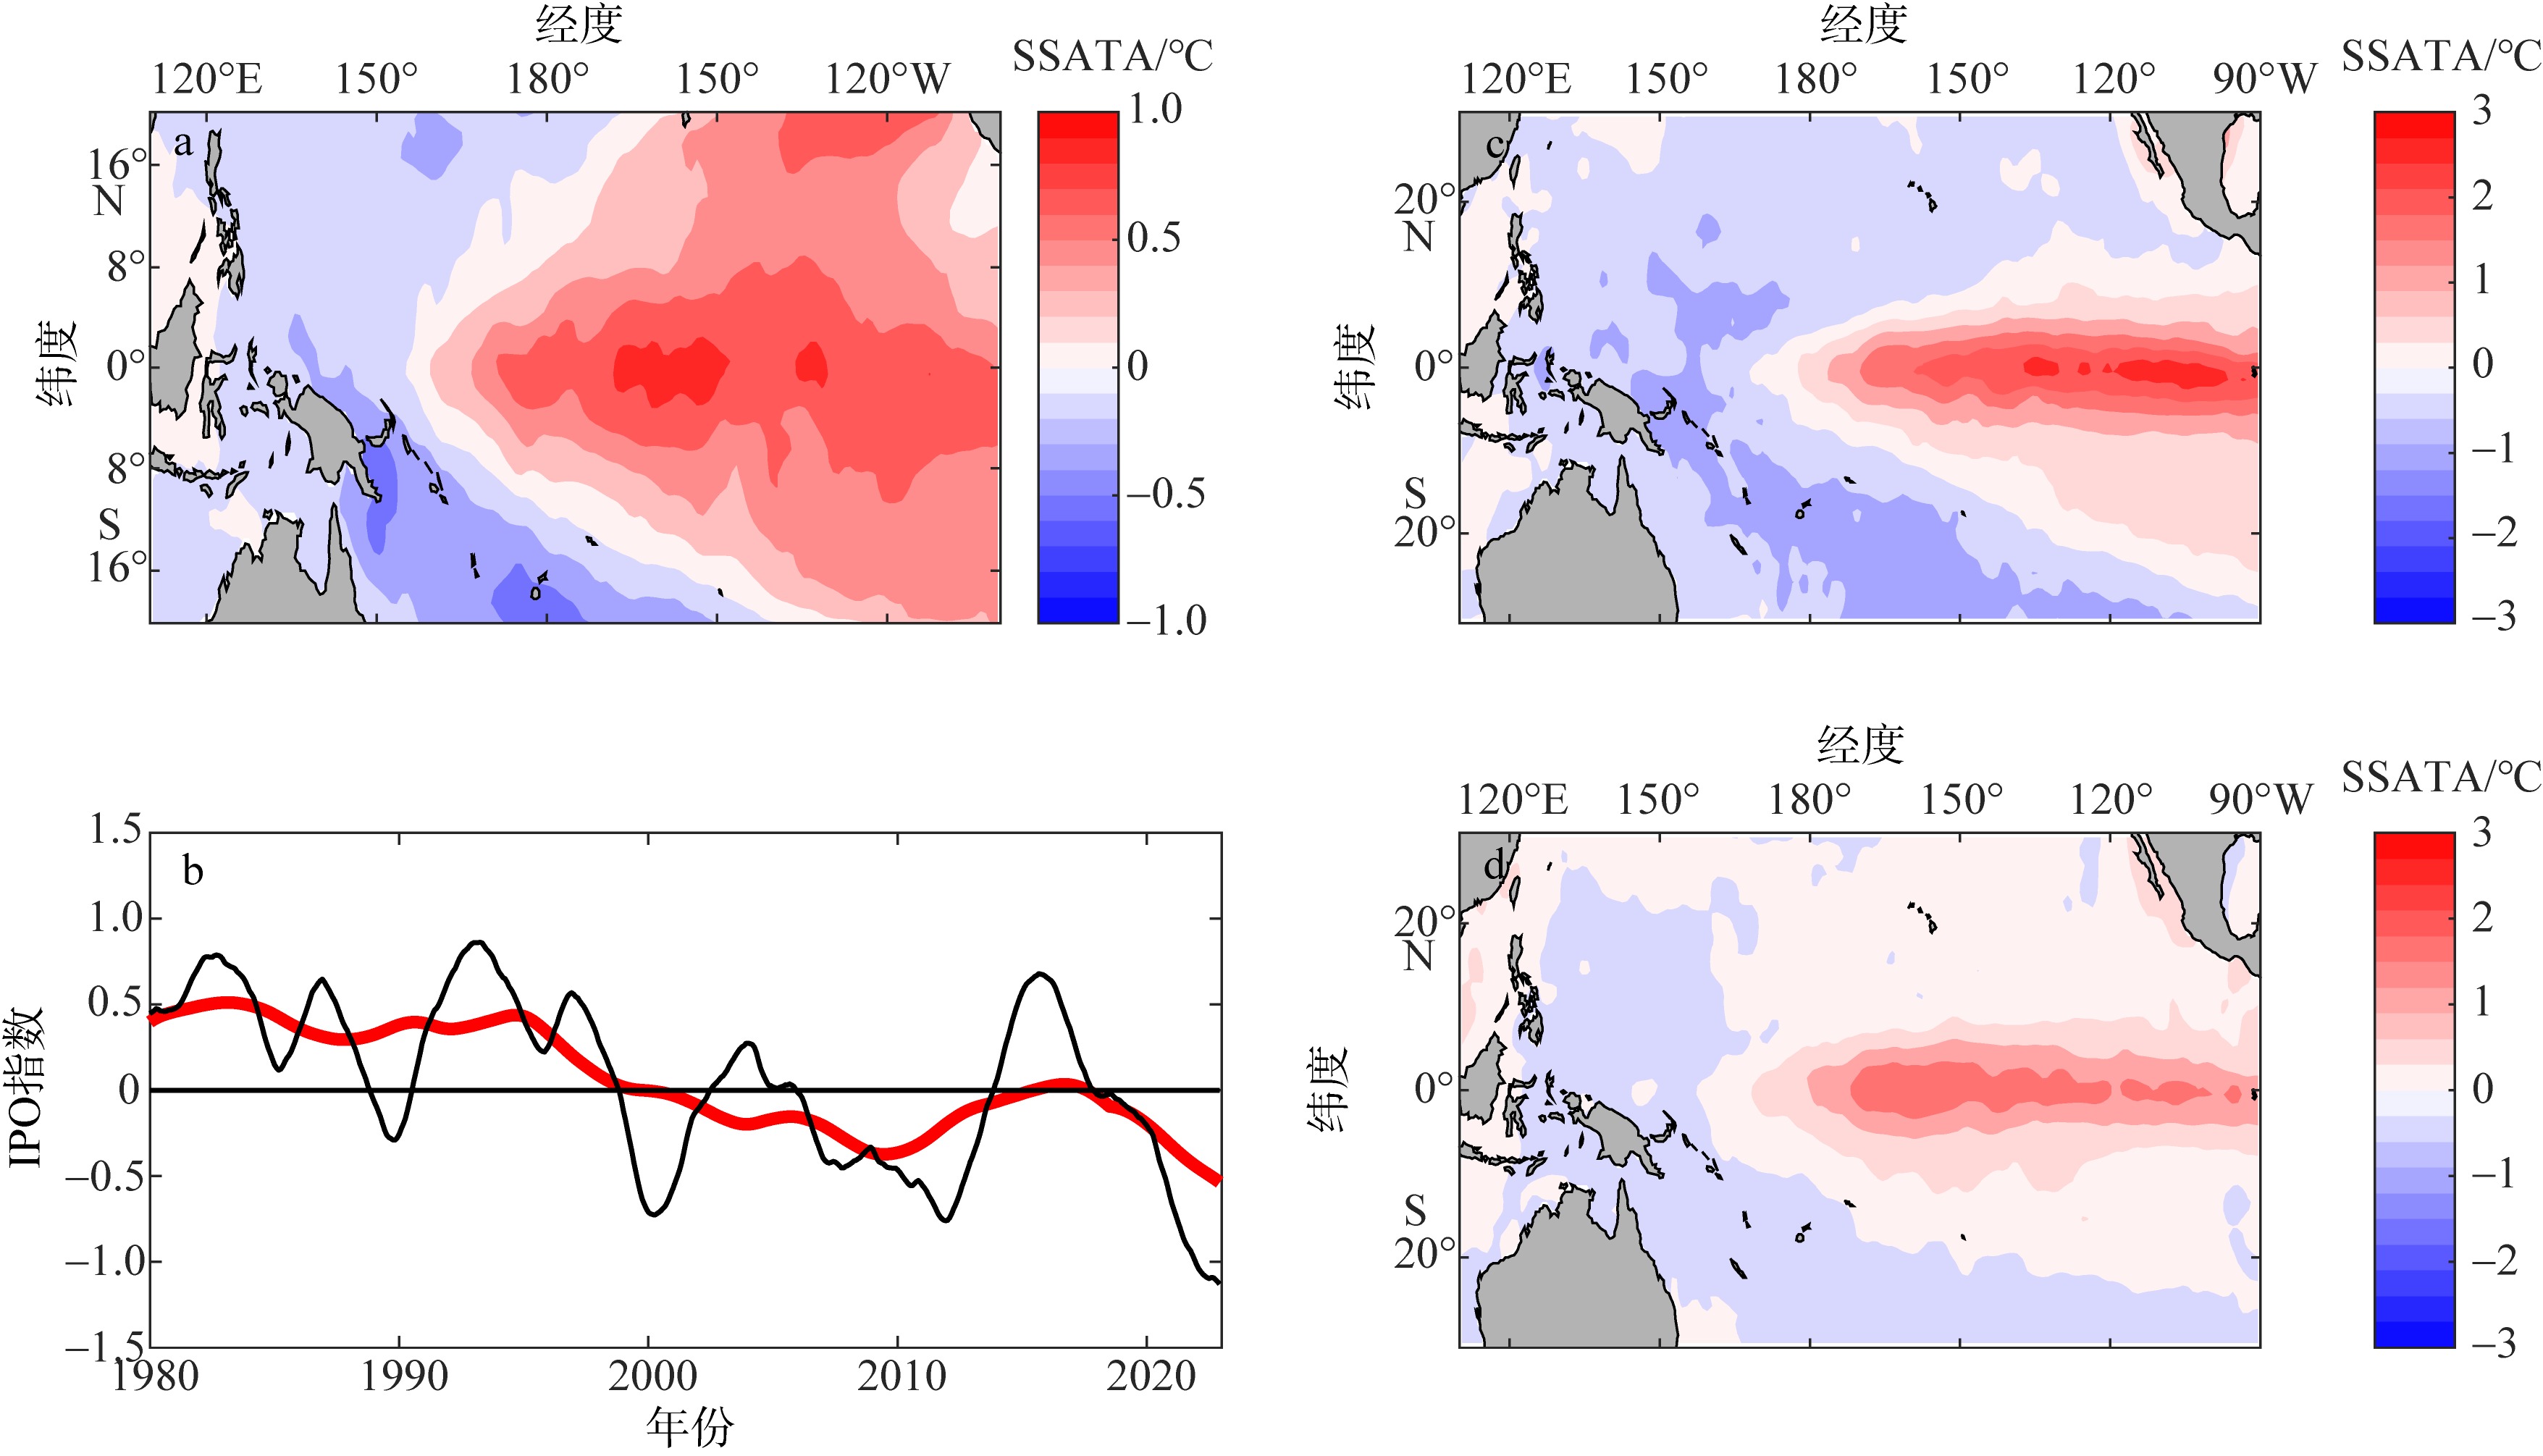
Fig. 1
Tab. 1
Classification of spatial types of El Niño events from 1980 to 2017"
| 序号 | 年份 | 方法 | 结果 | ||
|---|---|---|---|---|---|
| NWP/NCT | EMI | Niño3/4 | |||
| 1 | 1982/1983 | EP | EP | EP | EP |
| 2 | 1986/1987 | EP | EP | EP | EP |
| 3 | 1991/1992 | EP | CP | EP | EP |
| 4 | 1994/1995 | CP | CP | CP | CP |
| 5 | 1997/1998 | EP | EP | EP | EP |
| 6 | 2002/2003 | CP | CP | CP | CP |
| 7 | 2004/2005 | CP | CP | CP | CP |
| 8 | 2006/2007 | CP | EP | CP | CP |
| 9 | 2009/2010 | CP | CP | CP | CP |
| 10 | 2015/2016 | EP | EP | EP | EP |
Tab. 1
Fig. 2
Spatial modes and time series of EP-type and CP-type El Niño events. (a, c) Spatial distributions of SSTA for EP-type and CP-type El Niño events, respectively; (b, d) time series of the E-index and C-index, where the black line represents the E-index and C-index, the blue line denotes the IPO index, and the red line shows the 5-year moving average of the E-index and C-index"
Fig. 2
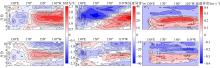
Fig. 3
Hovmöller diagrams of SSTA, thermocline depth anomalies, and sea surface zonal current anomalies. (a, b) Hovmöller diagrams of SSTA during El Niño events; (c, d) Hovmöller diagrams of thermocline depth anomalies during El Niño events; (e, f) Hovmöller diagrams of sea surface zonal current anomalies during El Niño events. (a, c, e) show composite results for El Niño events during positive IPO phases; (b, d, f) show composite results for El Niño events during negative IPO phases"
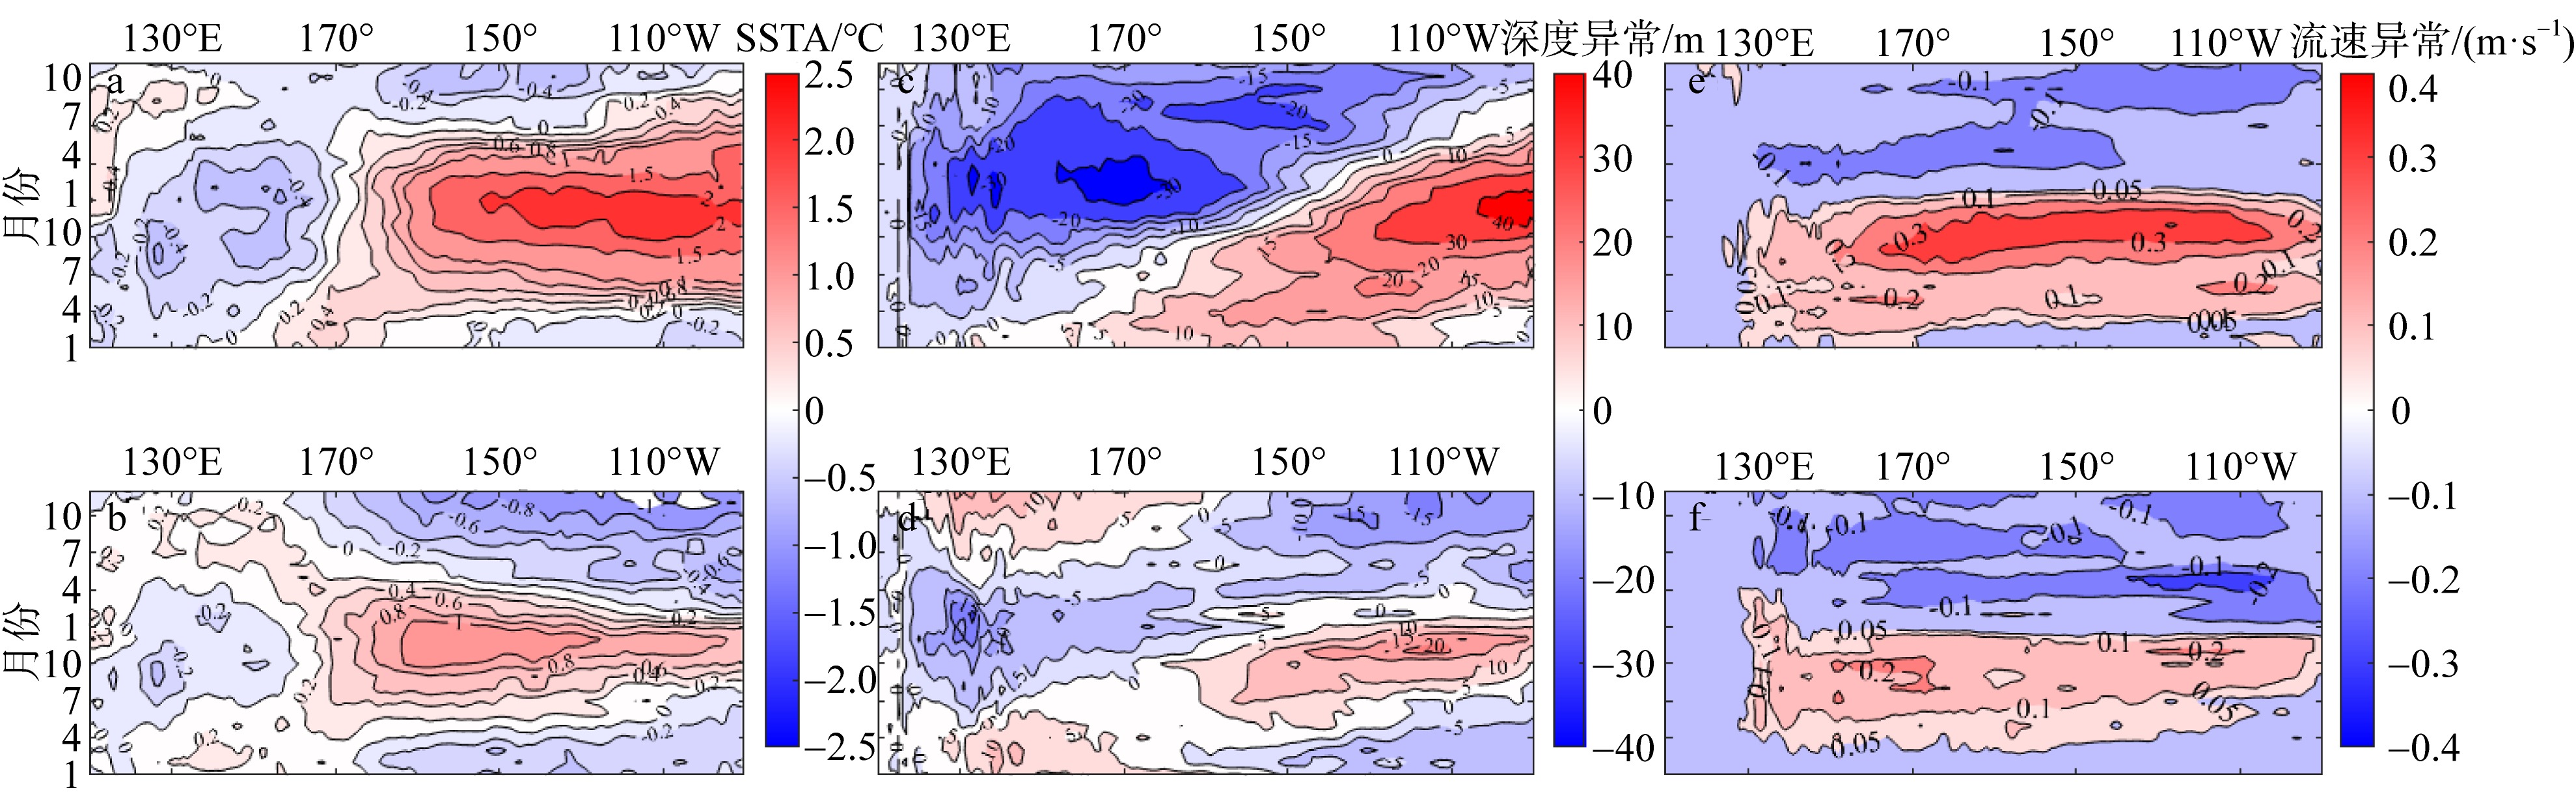
Fig. 3
Fig. 4
Heat budget analysis for the mixed layer and subsurface layer in the Niño4 and Niño3 regions. (a, b) Heat budget terms for the mixed layer and subsurface layer in the Niño4 region; (c, d) heat budget terms for the mixed layer and subsurface layer in the Niño3 region. Red bars represent CP-type El Niño events, and blue bars denote EP-type El Niño events. The three bars correspond to the mean values for the 3 months preceding the peak month, the peak month itself, and the 3 months following the peak month; In the horizontal coordinate, EP and CP represent EP-type El Niño events and CP-type El Niño events respectively while -TH, -ZA, and -NDH correspond to the TH feedback, ZA feedback, and NDH feedback within EP-type/CP-type El Niño events"
Fig. 4
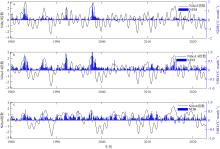
Fig. 5
Time series of Niño indices and subsurface NDH values from 1980 to 2022. (a) Niño3 index and subsurface NDH values in the Niño3 region; (b) Niño3.4 index and subsurface NDH values in the Niño3.4 region; (c) Niño4 index and subsurface NDH values in the Niño4 region; The corresponding regions are specifically defined as depths from 50 to 200 meters, latitudes from 5°S to 5°N, with longitudes as follows: a: 150°W-90°W, b: 170°W-120°W, c: 160°E-150°W"
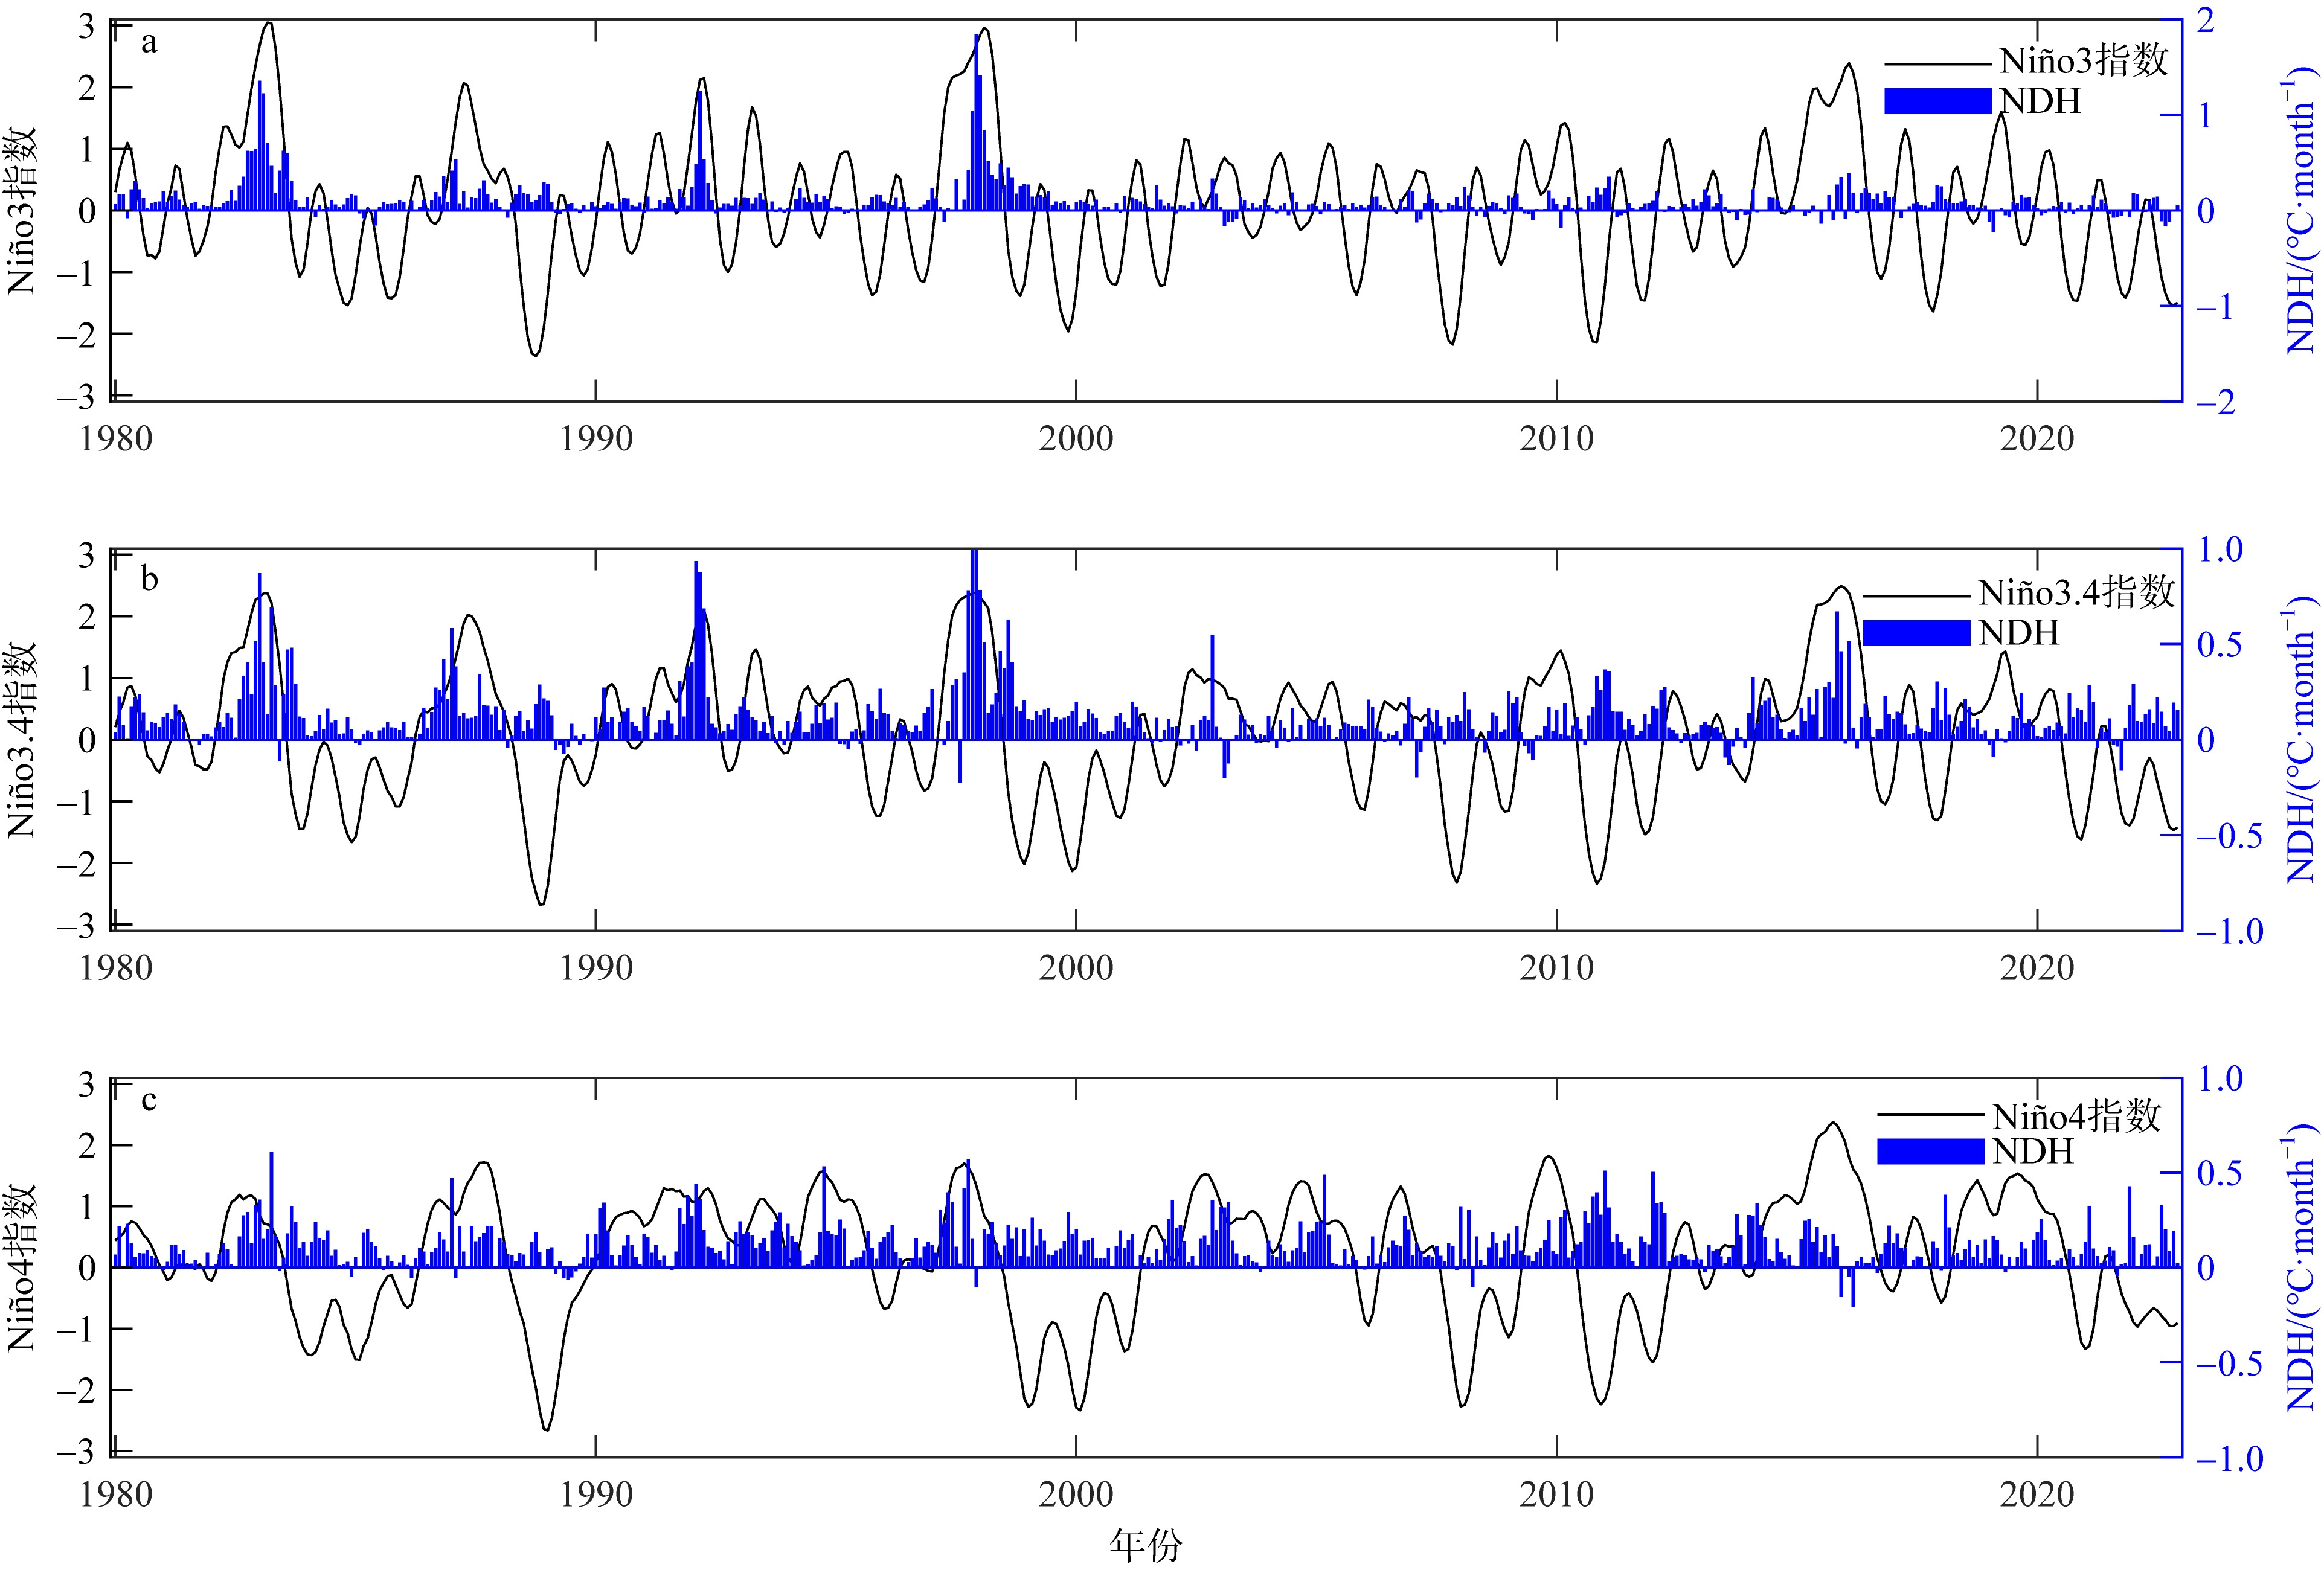
Fig. 5
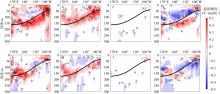
Fig. 6
Long-term averages of NDH and its components (NDHX, NDHY, NDHZ) between 1°S and 1°N. (a, b) Vertical profiles of NDH; (c, d) vertical profiles of NDHX; (e, f) vertical profiles of NDHY; (g, h) vertical profiles of NDHZ. (a, c, e, g) show long-term averages for positive IPO phases; (b, d, f, h) show long-term averages for negative IPO phases. Black lines indicate thermocline depths"

Fig. 6
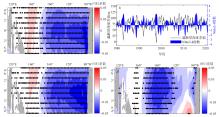
Fig. 7
Regression coefficient distributions of the thermocline depth difference (TDD) between the Niño4 and Niño3 regions and SST. (a) Spatial distribution of regression coefficients (1980-2020); (b) time series of the TDD between the Niño4 and Niño3 regions and the Niño3.4 index; (c) spatial distributions of regression coefficients for 1980-1999; (d) spatial distributions of regression coefficients for 2000-2020. Dotted areas pass the significance test at the 90% confidence level (α = 0.1)"

Fig. 7
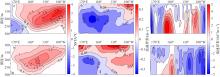
Fig. 8
Vertical profiles of SSTA, zonal current anomalies, and upwelling anomalies during the development phase of El Niño events under different IPO phases. (a, b) Vertical profiles of SSTA; (c, d) vertical profiles of zonal current anomalies; (e, f) vertical profiles of upwelling anomalies. (a, c, e) are mean profiles during the development phase of El Niño events under positive IPO phases; (b, d, f) are mean profiles during the development phase of El Niño events under negative IPO phases"
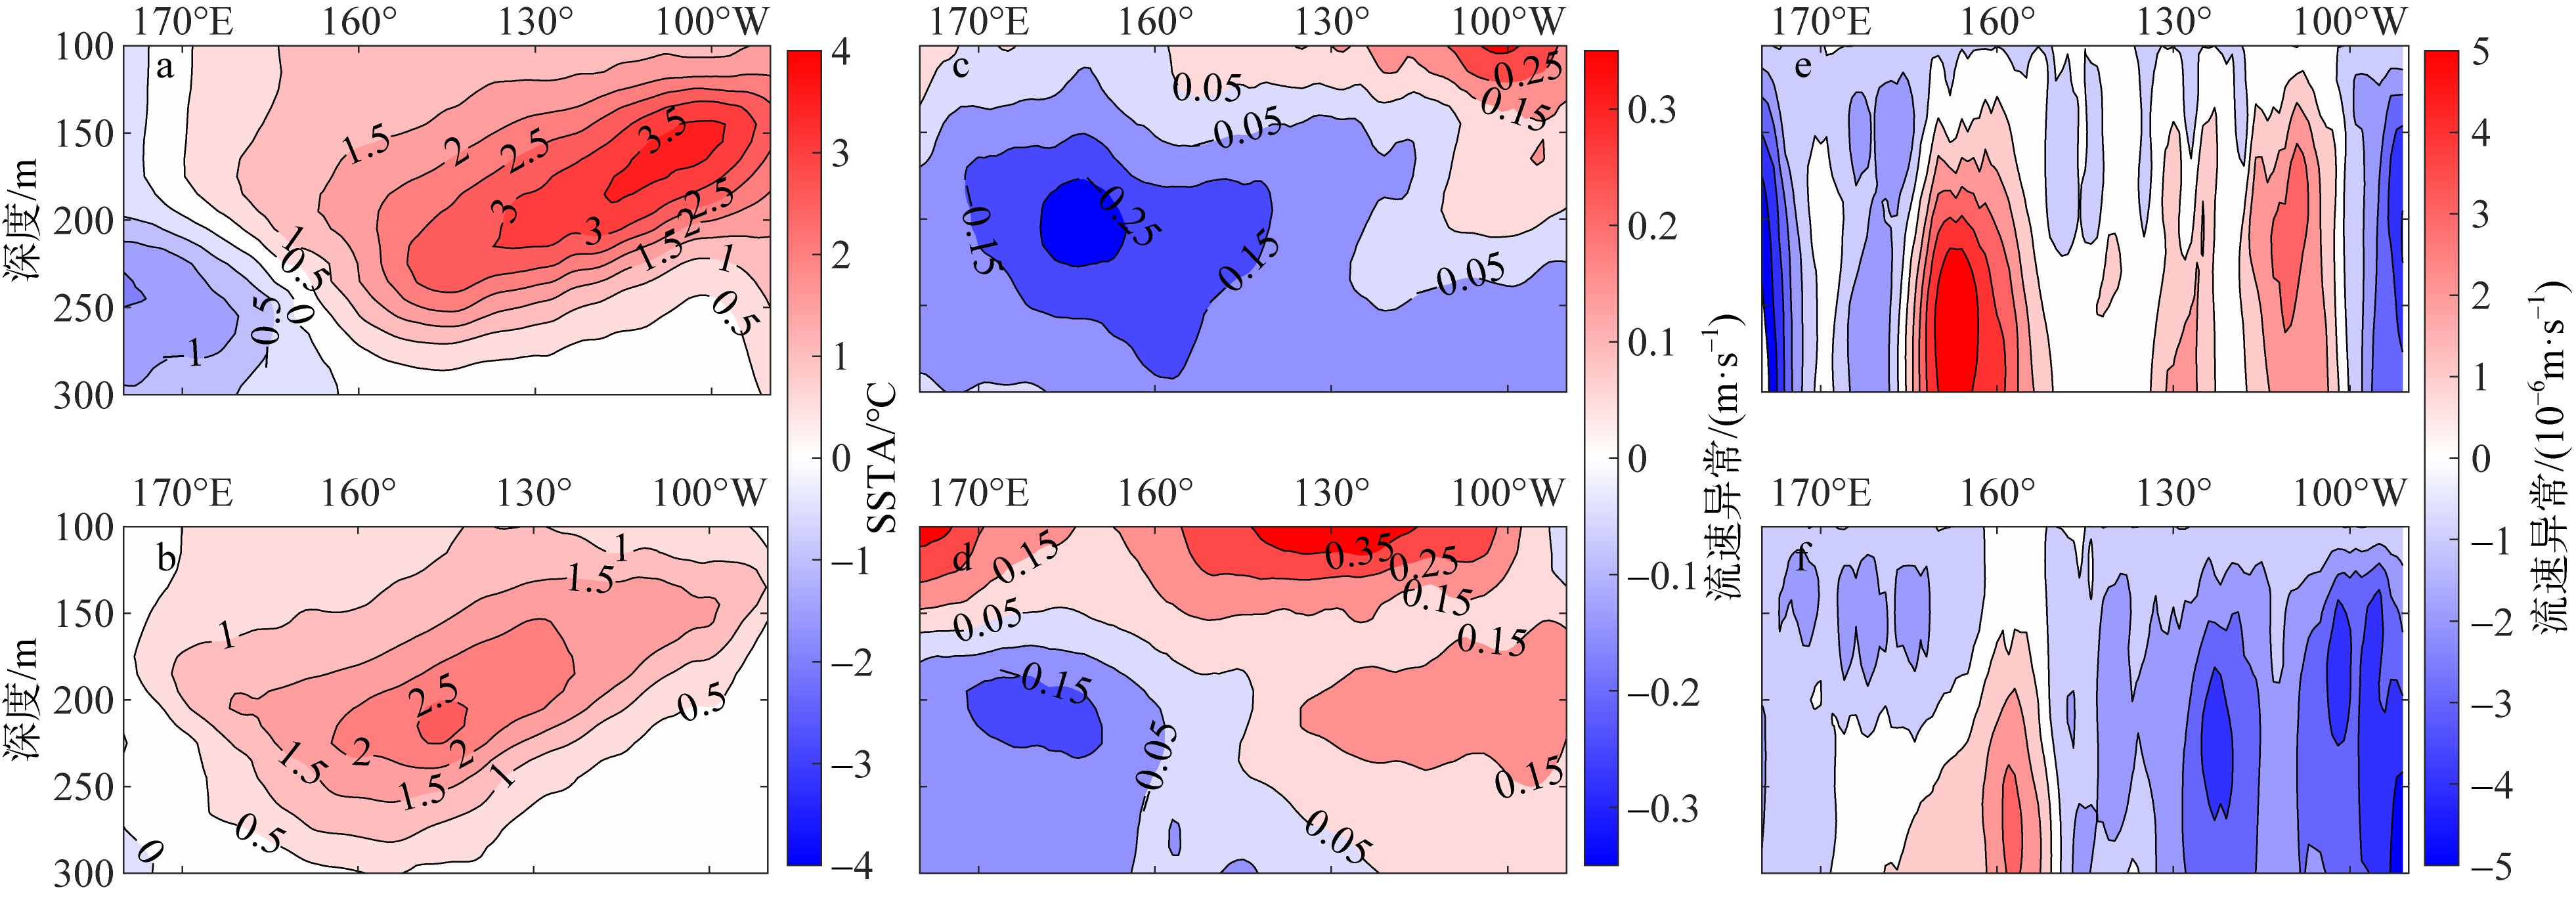
Fig. 8
| [1] |
董宇佳, 孟祥凤, 张磊, 2012. ENSO非对称及其机制初步研究[C]. 海洋科学前沿(一) 首届海洋女科学家论坛论文集. 北京: 海洋出版社: 42-50 (in Chinese).
|
| [2] |
李承勇, 孟祥凤, 谢瑞煌, 2023. PDO对ENSO非对称性的年代际调整及其机制[J]. 热带海洋学报, 42(4): 36-46.
|
|
|
|
| [3] |
doi: 10.1175/1520-0442(2001)014<3421:CROTAZ>2.0.CO;2 |
| [4] |
|
| [5] |
|
| [6] |
|
| [7] |
doi: 10.1002/jgrc.20335 |
| [8] |
doi: 10.1175/BAMS-D-13-00117.1 |
| [9] |
pmid: 27698122 |
| [10] |
doi: 10.3389/fmars.2023.1114809 |
| [11] |
doi: 10.1007/s00382-010-0912-1 |
| [12] |
doi: 10.1175/1520-0442(1990)003<1254:LSACFO>2.0.CO;2 |
| [13] |
|
| [14] |
|
| [15] |
|
| [16] |
doi: 10.1175/JCLI-D-13-00015.1 |
| [17] |
|
| [18] |
doi: 10.1007/s00382-015-2525-1 |
| [19] |
doi: 10.1175/JCLI-D-19-0316.1 |
| [20] |
|
| [21] |
doi: 10.1175/JCLI-D-12-00649.1 |
| [22] |
doi: 10.1175/2008JCLI2309.1 |
| [23] |
doi: 10.1175/2008JCLI2624.1 |
| [24] |
|
| [25] |
|
| [26] |
doi: 10.1007/s00376-017-7133-z |
| [27] |
doi: 10.1038/s41467-025-57058-4 |
| [28] |
doi: 10.1007/s003820050284 |
| [29] |
doi: 10.1175/1520-0493(1982)110<0354:VITSST>2.0.CO;2 |
| [30] |
|
| [31] |
|
| [32] |
|
| [33] |
|
| [34] |
|
| [35] |
|
| [36] |
doi: 10.1029/2018GL079203 |
| [37] |
doi: 10.1175/1520-0485(1975)005<0572:ENTDRO>2.0.CO;2 |
| [38] |
doi: 10.1007/s11802-013-2143-7 |
| [39] |
doi: 10.1007/s00704-014-1150-y |
| [40] |
doi: 10.1038/nature08316 |
| [41] |
|
| [42] |
|
| [43] |
doi: 10.5194/os-15-779-2019 |
| [1] | ZHANG Lianyi, ZHANG Yuhong, DU Yan. Quantifying impacts of ENSO and internal variability on the Indian Ocean Dipole* [J]. Journal of Tropical Oceanography, 2026, 45(1): 91-104. |
| [2] | ZHAO Jie, LIN Yanjiang, LIU Ran, DU Rong. Prediction of mesoscale eddies in the South China Sea based on the PredRNN++ model [J]. Journal of Tropical Oceanography, 2024, 43(1): 16-27. |
| [3] | TANG Jiaoyu, WANG Weiqiang, XU Kang, ZHANG Zhenqiu. Interannual variability of subsurface high salinity water in eastern equatorial Indian Ocean* [J]. Journal of Tropical Oceanography, 2023, 42(1): 10-21. |
| [4] | CHEN Yunfan, CHEN Tianran, LONG Shangmin, CHEN Zesheng, DU Yan. Reconstruction of climate variability of the tropical Indian Ocean based on coral δ18O data from four representative sites [J]. Journal of Tropical Oceanography, 2022, 41(1): 82-93. |
| [5] | LI Fuzi, ZHENG Xiaotong. Assessment of eastern Pacific ITCZ dipole mode simulations by CMIP5 models [J]. Journal of Tropical Oceanography, 2021, 40(1): 44-57. |
| [6] | Zhou LE, Ke HUANG, Subrahmanyam Mantravadi Venkata. Energy characteristics of eddy-mean flow interaction in the estuary of Bay of Bengal in summer and autumn during 2000-2015 [J]. Journal of Tropical Oceanography, 2020, 39(2): 11-14. |
| [7] | Ke FANG,Jinhua YU. Influence of sea surface temperature gradients in the tropical Pacific and Indian oceans of the Northern Hemisphere on the frequency of tropical cyclone generation in the western North Pacific in summer [J]. Journal of Tropical Oceanography, 2019, 38(5): 42-51. |
| [8] | Taonian GENG, Xuemei YAO, Ying ZHANG, Xialing XIE, Min CUI, Daoming LIN. Skeletal microstructure observations and calcification process analysis of two species of Montipora [J]. Journal of Tropical Oceanography, 2017, 36(1): 56-64. |
| [9] | SUN Zhiquan, XIANG Jie, GUAN Yuping. Strengthening of the Pacific Walker Circulation in the recent decades [J]. Journal of Tropical Oceanography, 2016, 35(2): 19-29. |
| [10] | ZHANG Ying, DU Yan, ZHANG Yu-hong, YANG Ya-li. Asymmetric influences of positive and negative IOD events on salinity transport by the fall Wyrtki Jet along the equatorial Indian Ocean [J]. Journal of Tropical Oceanography, 2015, 34(5): 1-10. |
| [11] | TAN Jing, WANG Zhang-gui, HUANG Rong-hui, CHEN Xing-rong, CAI Yi, HUANG Yong-yong. Analysis of tropical sea surface temperature and atmospheric circulation anomalies and their relationship with abnormal precipitation in Yunnan during rainy season [J]. Journal of Tropical Oceanography, 2015, 34(2): 15-23. |
| [12] | LI Yan, WANG Qing-yuan, LI Huan, ZHANG Zengjian, SONG Jun, LI Xiang. Impacts of long lasting SST anomaly events in the tropical Pacific and Indian oceans on anomalous Philippine Sea anticyclone [J]. Journal of Tropical Oceanography, 2014, 33(1): 36-43. |
| [13] | XU Hai-ming, ZHANG Lan, DU Yan. Research progress of southern Indian Ocean Dipole and its influence [J]. Journal of Tropical Oceanography, 2013, 32(1): 1-7. |
| [14] | HUANG Jie-ying,HUANG Hui,ZHANG Yu-yang,YANG Jian-hui,YOU Feng. Embryonic and larval development of Montipora turgescens and Acropora robusta [J]. Journal of Tropical Oceanography, 2011, 30(2): 67-73. |
|
||