
Journal of Tropical Oceanography ›› 2023, Vol. 42 ›› Issue (2): 34-44.doi: 10.11978/2022105CSTR: 32234.14.2022105
Special Issue: 全球变化专题
Previous Articles Next Articles
Tropical ocean-atmosphere coupling modes and their relationship with ENSO during spring*
ZHANG Yuhong1,2,3( ), ZHANG Lianyi1,3, DU Yan1,2,3
- 1. State Key Laboratory of Tropical Oceanography, Guangdong Key Lab of Ocean Remote Sensing, South China Sea Institute of Oceanology, Chinese Academy of Sciences, Guangzhou 510301, China
2. University of Chinese Academy of Sciences, Beijing 100049, China
3. Southern Marine Science and Engineering Guangdong Laboratory (Guangzhou), Guangzhou 511458, China
-
Received:2022-05-10Revised:2022-07-14Online:2023-03-10Published:2022-08-02 -
Contact:ZHANG Yuhong. email:zhangyuhong@scsio.ac.cn -
Supported by:National Natural Science Foundation of China(41976024); National Natural Science Foundation of China(41830538); National Natural Science Foundation of China(42090042); Southern Marine Science, Engineering Guangdong Laboratory (Guangzhou)(2019BT02H594); Independent Research Project Program of State Key Laboratory of Tropical Oceanography(LTOZZ2101)
Cite this article
ZHANG Yuhong, ZHANG Lianyi, DU Yan. Tropical ocean-atmosphere coupling modes and their relationship with ENSO during spring*[J].Journal of Tropical Oceanography, 2023, 42(2): 34-44.
share this article
Add to citation manager EndNote|Reference Manager|ProCite|BibTeX|RefWorks
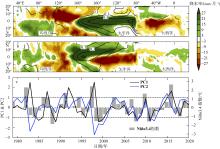
Fig. 1
The first two modes of the Joint empirical orthogonal functions (EOF) of boreal spring (March—April—May) mean precipitation rate (shaded, mm·month-1) and sea surface temperature (contours, ℃) in the global tropical ocean and the corresponding time series. (a) the first mode; (b) the second mode; (c) the corresponding time series (PC1 and PC2). Short dashed lines indicate the value of one standard deviation, the dotted line indicates the zero. The gray bars in c indicate the three-month mean Nino3.4 index in November—next January (NDJ)"

Fig. 1
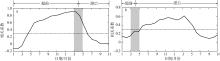
Fig. 2
Lead and lag correlation coefficient between the Noni 3.4 index and PC1, and PC2, respectively. (a) PC1 and Niño3.4 index; (b) PC2 and Niño3.4 index. Dashed lines indicate the threshold value of 95% confidence level of Student’s t-test, the grey rectangles mark the mature phase of the first and second modes, the lead and lag indicate the Nino3.4 index leads and lags the first and second modes"
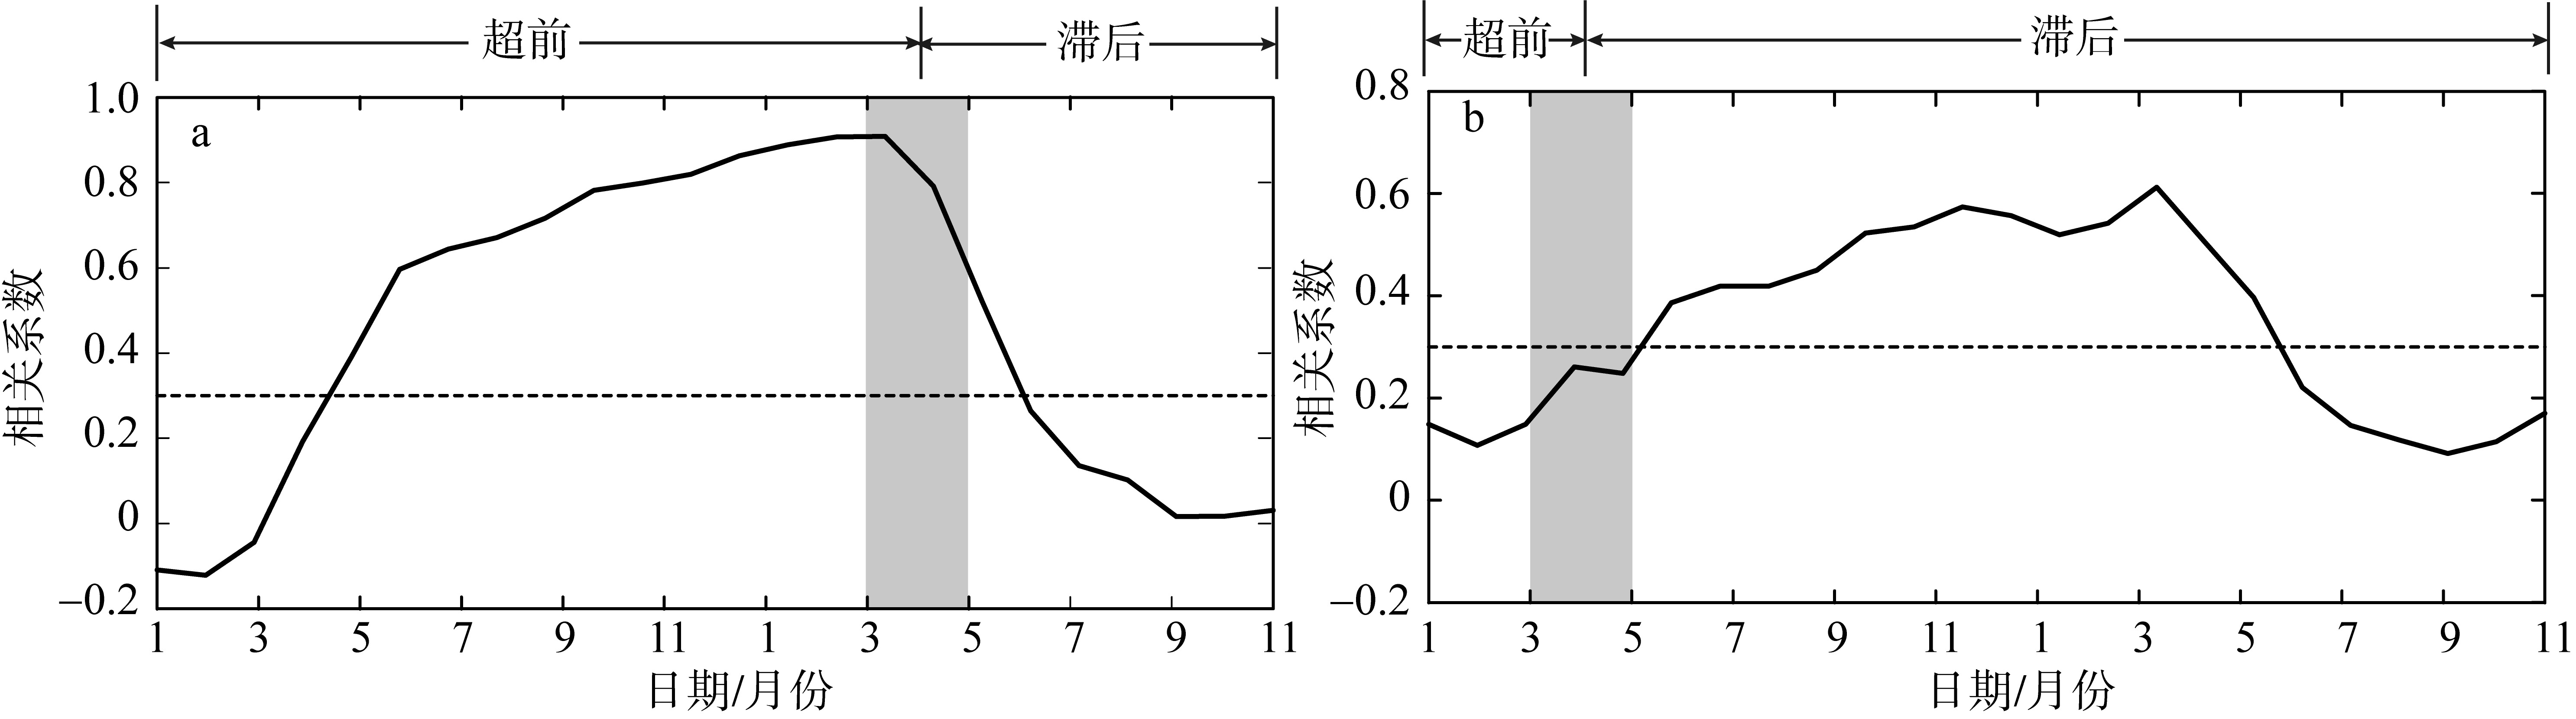
Fig. 2
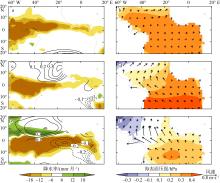
Fig. 3
Anomalies of precipitation (Precip, mm·month-1), sea surface temperature (SST, ℃), sea level pressure (Slp, hPa), and 10 m wind (m·s-1) in the tropical Atlantic Ocean obtained by regressing to the PC1, respectively. (a, c, e) precipitation (shaded) and SST (contours); (b, d, f) Slp (shaded) and winds (vectors); (a, b) the last December to January; (c, d) February—March; (e, f) April—May. The regressed results exceeding 95% confidence level of Student’s t-test are shown"
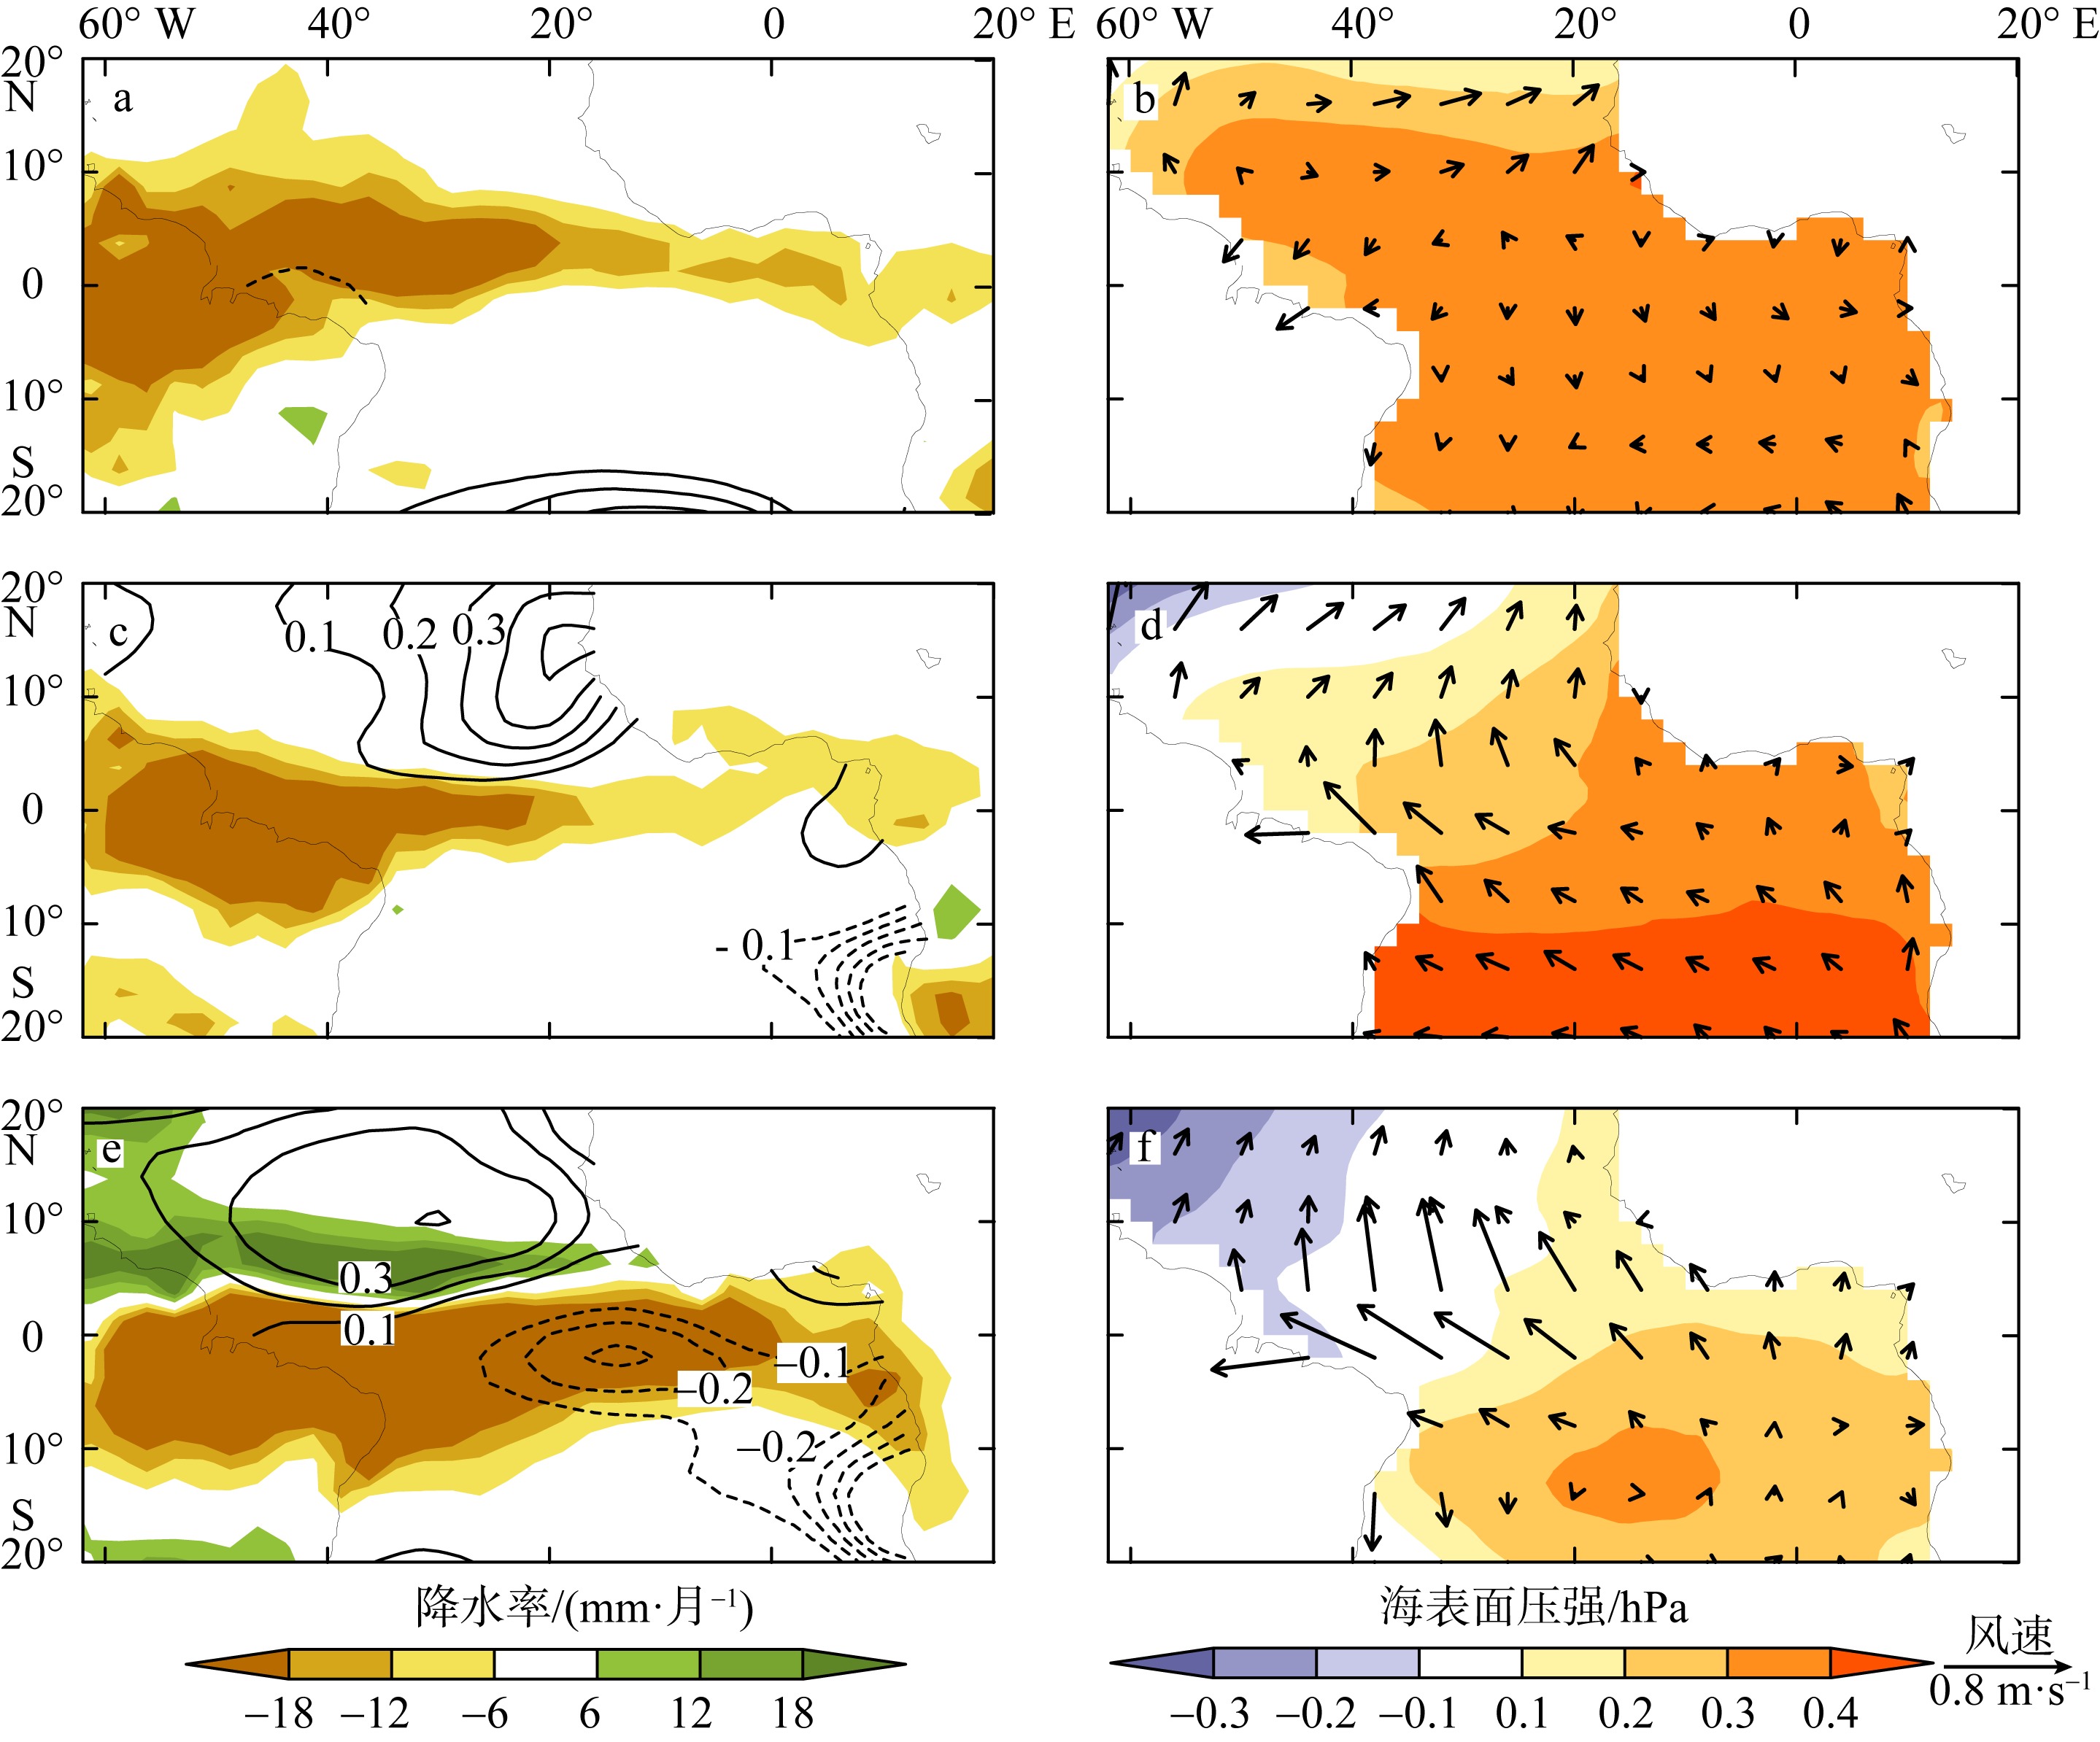
Fig. 3
Fig. 4
Anomalies of precipitation (Precip, mm·month-1), sea surface temperature (SST, ℃), sea level pressure (Slp, hPa), and 10 m wind (m·s-1) in the tropical Indian Ocean obtained by regressing to the PC1, respectively. (a, c, e, g) precipitation (shaded) and SST (contours); (b, d, f) Slp (shaded) and winds (vectors); (a, b) the last October to November; (c, d) December to January; (e, f) February—March; (g, h) April—May. The regressed results exceeding 95% confidence level of Student’s t-test are shown."

Fig. 4
Fig. 5
Longitude-time diagram of the meridional averaged anomalies of sea surface height (SSH, shaded, cm), and 10 m wind curl (contours, s-1) in the south tropical Indian Ocean between 12°—8°S obtained by regressing to the PC1, respectively. The regressed results exceeding 95% confidence level of Student’s t-test are shown"

Fig. 5
Fig. 6
Latitude-time diagram of the zonal averaged anomalies of precipitation (mm·month-1), sea surface temperature (℃), sea level pressure (hPa), and 10 m wind (m·s-1) in the tropical Indian Ocean, the Atlantic Ocean and the Pacific Oceans obtained by regressing to the PC1 and PC2, respectively, and the climatological mean precipitation and wind. The regressed results exceeding 95% confidence level of Student’s t-test are shown. (a, d, g) Indian Ocean (50°—90°E); (b, e, h) Atlantic Ocean (60°W—20°E); (c, f, i) Pacific (140°E—80°W); (a, b, c) regressions of precipitation (shading) and SST (contours); (d, e, f) regressions of sea level pressure (shaded), and 10 m wind (vectors); (g, h, i) climatological mean precipitation (shaded) and wind (vectors). White bold contours in e and f labels the heavy precipitation centers with precipitation rate larger than 130 mm·month-1. The anomalies in the tropical Indian Ocean and the Atlantic Ocean are regressed to the PC1; the anomalies in the Pacific ocean are regressed to the PC2"

Fig. 6
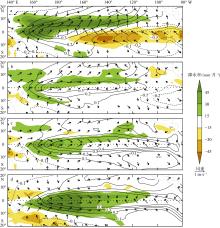
Fig. 7
Anomalies of precipitation (mm·month-1) and sea surface temperature (℃) in the tropical Pacific Ocean obtained by regressing to the PC2, respectively. The regressed results exceeding 95% confidence level of Student’s t-test are shown. (a) spring (March—April—May, MAM); (b) summer (June—July—August, JJA); (c) fall (September—October—November, SON); (d) winter (December—January—February, DJF)"
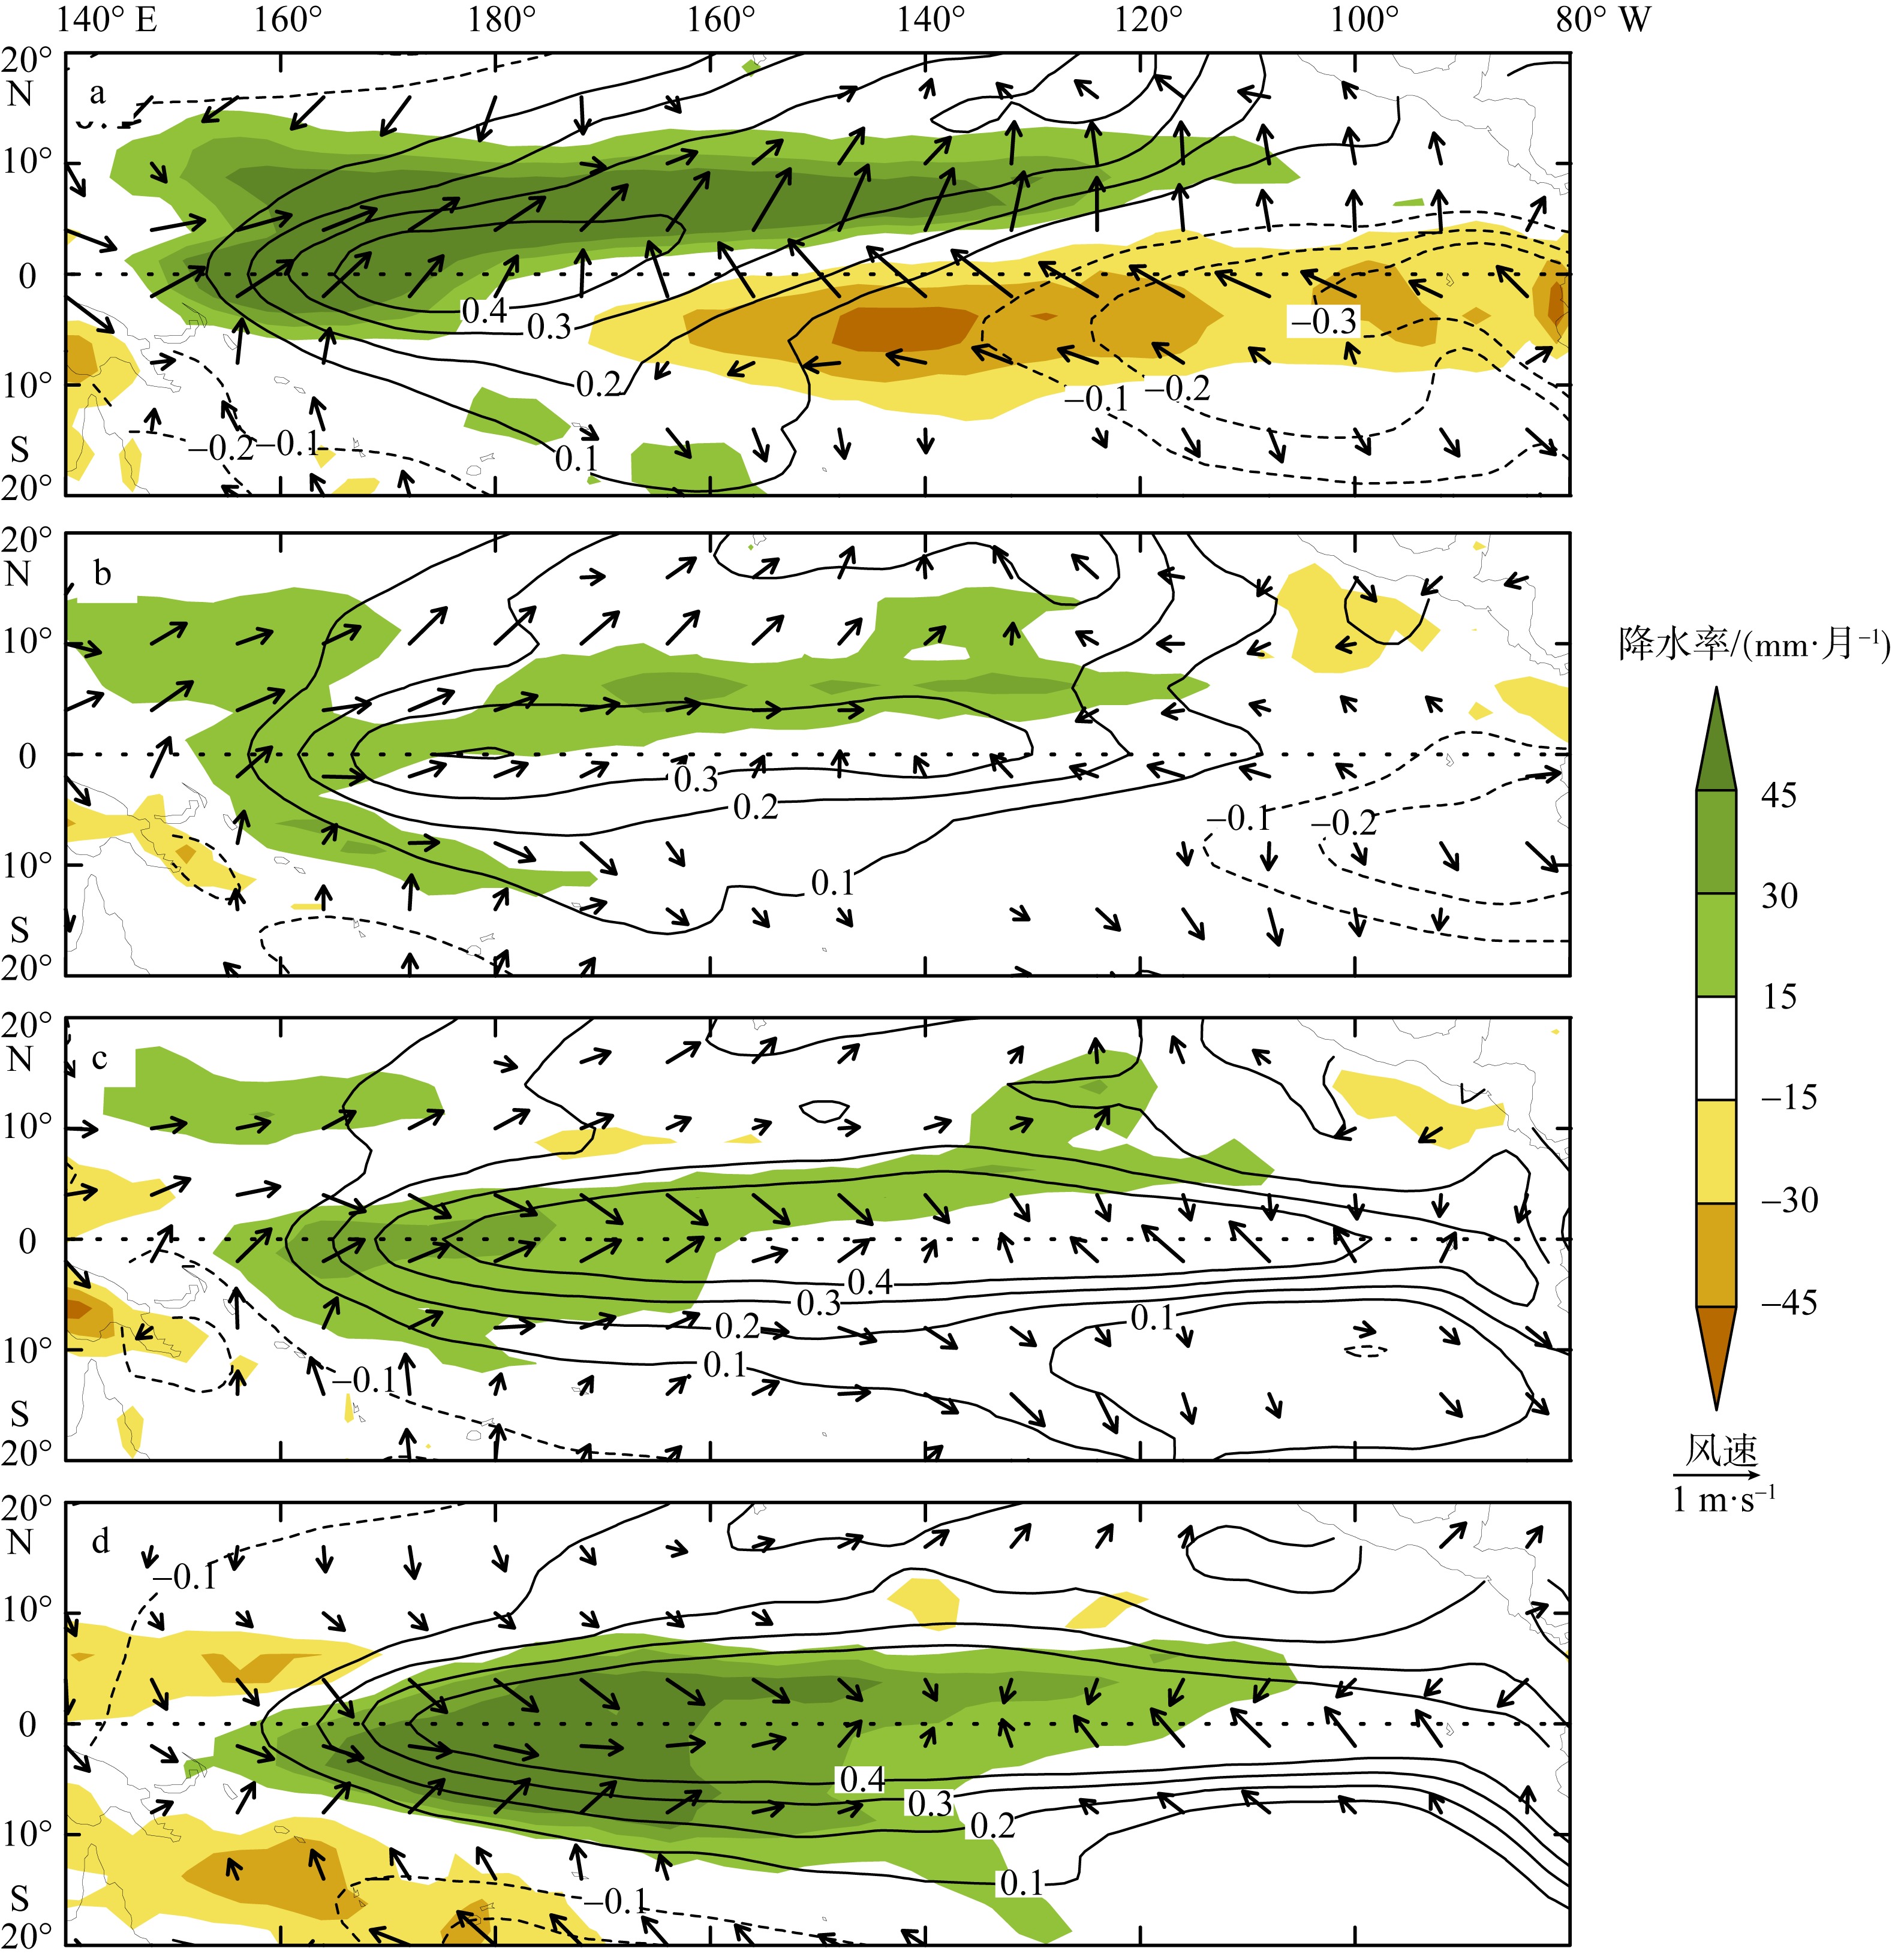
Fig. 7
| [1] |
doi: 10.1175/1525-7541(2003)004<1147:TVGPCP>2.0.CO;2 |
| [2] |
doi: 10.1175/1520-0442(2002)015<2205:TABTIO>2.0.CO;2 |
| [3] |
doi: 10.1175/JCLI3797.1 |
| [4] |
doi: 10.1175/1520-0493(1969)097<0163:ATFTEP>2.3.CO;2 |
| [5] |
|
| [6] |
doi: 10.1038/385516a0 |
| [7] |
|
| [8] |
doi: 10.1007/s00382-017-3899-z |
| [9] |
doi: 10.1029/2000JD000307 |
| [10] |
doi: 10.1175/JCLI4953.1 |
| [11] |
doi: 10.1029/95JC01502 |
| [12] |
doi: 10.1175/1520-0442(2002)015<3280:ADSOTR>2.0.CO;2 |
| [13] |
doi: 10.1175/2008JCLI2590.1 |
| [14] |
|
| [15] |
|
| [16] |
|
| [17] |
doi: 10.1175/1520-0442(2000)013<0297:IVOCRE>2.0.CO;2 |
| [18] |
|
| [19] |
doi: 10.1175/JCLI-D-16-0836.1 |
| [20] |
doi: 10.1029/2001JC001278 |
| [21] |
doi: 10.1029/2009GL040000 |
| [22] |
doi: 10.1029/2019GL085205 |
| [23] |
doi: 10.1029/2000JD900610 |
| [24] |
doi: 10.1175/1520-0442(1999)012<0917:RSSTVD>2.0.CO;2 |
| [25] |
doi: 10.1175/JCLI-D-14-00055.1 |
| [26] |
doi: 10.1029/97JC03413 |
| [27] |
doi: 10.1175/1520-0442(2000)013<4287:IOEOTV>2.0.CO;2 |
| [28] |
doi: 10.1029/2008GL034734 |
| [29] |
doi: 10.1002/2014JC010429 |
| [30] |
doi: 10.1175/2009JCLI3104.1 |
| [31] |
doi: 10.1175/JCLI-D-13-00448.1 |
| [32] |
doi: 10.1007/s00382-019-04851-9 |
| [33] |
doi: 10.1175/JCLI4152.1 |
| [34] |
doi: 10.1175/JCLI-D-16-0063.1 |
| [35] |
doi: 10.1175/JCLI-D-20-0122.1 |
| [36] |
doi: 10.1175/1520-0442(1996)009<2464:VOSSTW>2.0.CO;2 |
| [37] |
doi: 10.1016/j.dynatmoce.2004.10.014 |
| [38] |
doi: 10.1175/1520-0493(1982)110<0354:VITSST>2.0.CO;2 |
| [39] |
doi: 10.1175/1520-0493(1987)115<1606:GARSPP>2.0.CO;2 |
| [40] |
doi: 10.1002/grl.v44.5 |
| [41] |
doi: 10.1175/JCLI-D-16-0090.1 |
| [42] |
doi: 10.1175/1520-0477(1997)078<2771:TDOENO>2.0.CO;2 |
| [43] |
doi: 10.1175/1520-0442(2003)016<2668:TSFMIT>2.0.CO;2 |
| [44] |
doi: 10.1175/1520-0442(2000)013<1517:PEATHD>2.0.CO;2 |
| [45] |
|
| [46] |
doi: 10.1002/joc.2014.34.issue-8 |
| [47] |
doi: 10.1029/97JC02719 |
| [48] |
doi: 10.1002/(ISSN)1477-870X |
| [49] |
doi: 10.1029/2019GL085840 |
| [50] |
|
| [51] |
doi: 10.1175/1520-0442(2002)015<0864:SAMOSI>2.0.CO;2 |
| [52] |
doi: 10.1175/2008JCLI2544.1 |
| [53] |
doi: 10.1007/s00376-015-5192-6 |
| [54] |
doi: 10.3402/tellusa.v46i4.15484 |
| [55] |
doi: 10.1175/JCLI-D-16-0866.1 |
| [56] |
doi: 10.1175/JCLI-D-10-05001.1 |
| [57] |
doi: 10.1175/JCLI-D-17-0860.1 |
| [58] |
doi: 10.1029/2005GL024327 |
| [59] |
doi: 10.1175/JCLI-D-13-00082.1 |
| [60] |
|
| [61] |
doi: 10.1175/JCLI-D-21-0426.1 |
| [1] | YUAN Yu, XU Haiming, MA Jing, ZHANG Tong. Impact of Atlantic Multidecadal Oscillation on interannual relationship between ENSO and early summer marine heatwaves in the Western Pacific* [J]. Journal of Tropical Oceanography, 2024, 43(5): 1-16. |
| [2] | HAN Dingyan, LI Min, HU Rui, XIE Lingling. Variation and mechanisms of autumn tropical cyclones landed in Guangdong [J]. Journal of Tropical Oceanography, 2024, 43(1): 64-78. |
| [3] | QUAN Mengyuan, WANG Hui, LI Wenshan, WANG Aimei, LUO Jingxin. The interannual variation of summer upwelling in Zhoushan Islands and its relationship with ENSO [J]. Journal of Tropical Oceanography, 2024, 43(1): 48-55. |
| [4] | LI Chengyong, MENG Xiangfeng, XIE Ruihuang. Interdecadal modulation of ENSO asymmetry by the Pacific Decadal Oscillation and its mechanism [J]. Journal of Tropical Oceanography, 2023, 42(4): 36-46. |
| [5] | ZHANG Qi, LIAN Tao. Low-frequency wind stress forcing reduces El Niño diversity in numerical model [J]. Journal of Tropical Oceanography, 2023, 42(1): 1-9. |
| [6] | YANG Shaoqiong, CHENG Dan, CHEN Guangyao, LUO Chenyi, NIU Wendong, MA Wei, FA Shuai. Review on the application of underwater gliders for observing typical ocean phenomena [J]. Journal of Tropical Oceanography, 2022, 41(3): 54-74. |
| [7] | Yiling ZHENG,Zesheng CHEN,Hai WANG,Yan DU. Features of 2015/2016 extreme El Niño event and its evolution mechanisms [J]. Journal of Tropical Oceanography, 2019, 38(4): 10-19. |
| [8] | Wenxi CAO, Zhaohua SUN, Cai LI, Guowang ZOU. Biofouling protection for water quality monitoring buoy and sensors [J]. Journal of Tropical Oceanography, 2018, 37(5): 7-12. |
| [9] | Huawei QIN, Zhuo TAO, Huaiming LI, Xihe YUE, Zhen CAI, Sheng CHEN, Hongwei ZHOU, Ying YE. Development and application of chemical sensor for hydrothermal vents detection [J]. Journal of Tropical Oceanography, 2018, 37(3): 86-92. |
| [10] | Jiguang LI, Dongkai WANG. Research on ghost suppression and notch compensation of dual-sensor ocean bottom cable data [J]. Journal of Tropical Oceanography, 2018, 37(2): 100-104. |
| [11] | Lianghong LÜ, Xiaotong ZHENG. The effect of Indian Ocean Basin mode on Indian Summer Monsoon Rainfall in decaying year of El Niño [J]. Journal of Tropical Oceanography, 2017, 36(2): 1-11. |
| [12] | YANG Yali, DU Yan. Decadal variability of oceanic advection in the South China Sea associated with ENSO and Indian-Ocean Basin and its impacts on SST [J]. Journal of Tropical Oceanography, 2016, 35(1): 72-81. |
| [13] | JIN Xiao-lin, LI Zhong-xian, ZHENG Zhi-hai, WANG Da-jun. Interannual variability of the TIWs and its relationship with the ENSO [J]. Journal of Tropical Oceanography, 2015, 34(3): 30-35. |
| [14] | DU Mei-fang, XU Hai-ming, ZHOU Chao. Analysis of non-uniform sea surface temperature warming over the tropical oceans and its causes based on CMIP5 data [J]. Journal of Tropical Oceanography, 2015, 34(3): 1-12. |
| [15] | DONG Xian-xin, JIANG Kai, CHEN Hang, YE Shu-ming. A design of deep-sea extreme environment simulator [J]. Journal of Tropical Oceanography, 2014, 33(2): 101-108. |
|
||