
Journal of Tropical Oceanography ›› 2024, Vol. 43 ›› Issue (5): 1-16.doi: 10.11978/2023150CSTR: 32234.14.2023150
• Marine Hydrology • Next Articles
Impact of Atlantic Multidecadal Oscillation on interannual relationship between ENSO and early summer marine heatwaves in the Western Pacific*
YUAN Yu1,2( ), XU Haiming1,2(), MA Jing1,2, ZHANG Tong1,2
- 1. Collaborative Innovation Center on Forecast and Evaluation of Meteorological Disasters (CICFEMD) / Key Laboratory of Meteorological Disaster, Ministry of Education (KLME) / Joint International Research Laboratory of Climate and Environment Change (ILCEC), Nanjing University of Information Science and Technology, Nanjing 210044, China
2. College of Atmospheric Science, Nanjing University of Information Science and Technology, Nanjing 210044, China
-
Received:2023-10-16Revised:2023-12-14Online:2024-09-10Published:2024-10-10 -
Supported by:National Natural Science Foundation of China(42192562); National Natural Science Foundation of China(41975106)
Cite this article
YUAN Yu, XU Haiming, MA Jing, ZHANG Tong. Impact of Atlantic Multidecadal Oscillation on interannual relationship between ENSO and early summer marine heatwaves in the Western Pacific*[J].Journal of Tropical Oceanography, 2024, 43(5): 1-16.
share this article
Add to citation manager EndNote|Reference Manager|ProCite|BibTeX|RefWorks
Tab. 1
El Niño and La Niña events during 1960-2020"
| ENSO事件 | 年份 |
|---|---|
| 厄尔尼诺事件 | 1963/64, 1965/66, 1972/73, 1982/83, 1986/87, 1987/88, 1991/92, 1994/95, 1997/98, 2002/03, 2004/05, 2009/10, 2014/15, 2015/16, 2018/19 |
| 拉尼娜事件 | 1961/62, 1962/63, 1964/65, 1966/67, 1967/68, 1970/71, 1971/72, 1973/74, 1974/75, 1975/76, 1984/85, 1988/89, 1995/96, 1998/99, 1999/2000, 2000/01, 2007/08, 2010/11, 2011/12, 2016/17, 2017/18 |
Tab. 1
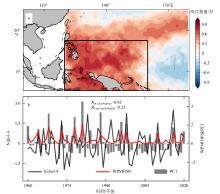
Fig. 1
Spatial pattern of the first mode of the early summer marine heatwaves months in the western Pacific during 1960-2020 (a) and time series of PC1 (grey bar), early summer WPMHWI (red line) and Niño3.4 index in the preceding winter (black line) (b). The black box in (a) indicates the calculation range of the marine heatwaves index in the western Pacific"

Fig. 1
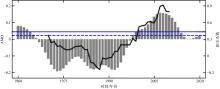
Fig. 2
Time series of 21-year sliding correlation coefficient (solid black line) between Niño3.4 index in the preceding winter and early summer WPMHWI, together with AMO index (grey bar). The solid blue line indicates the 95% significance level, and the dashed blue line indicates the 90% significance level"

Fig. 2
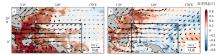
Fig. 3
Regressed marine heatwaves (unit: months) and 850 hPa anomaly winds (unit: m·s-1) in early summer upon the preceding winter Niño3.4 index during 1998-2018 (a) and 1974-1997 (b). The black box indicates the calculation range of the marine heatwaves index in the western Pacific. Stippling and bold arrow indicates the anomalous field passes the 90% confidence test"

Fig. 3
Tab. 2
El Niño and La Niña events in different AMO phases"
| 厄尔尼诺事件年份 | 拉尼娜事件年份 | |
|---|---|---|
| AMO+ | 1963/64, 1965/66, 1997/98, 2002/03, 2004/05, 2009/10, 2014/15, 2015/16, 2018/19 | 1961/62, 1962/63, 1964/65, 1998/99, 1999/2000, 2000/01, 2007/08, 2010/11, 2011/12, 2016/17, 2017/18 |
| AMO- | 1972/73, 1982/83, 1986/87, 1987/88, 1991/92, 1994/95 | 1966/67, 1967/68, 1970/71, 1971/72, 1973/74, 1974/75, 1975/76, 1984/85, 1988/89, 1995/96 |
Tab. 2
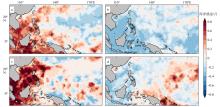
Fig. 4
Composites of marine heatwaves (unit: months) for AMO+/El Niño (a), AMO+/La Niña (b), AMO-/El Niño (c) and AMO-/La Niña (d) in the following early summer. Stippling indicates the anomalous field passes the 90% confidence test"

Fig. 4
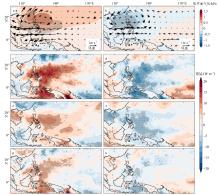
Fig. 5
Composites of anomalous sea-level pressure (unit: hPa) and 850 hPa winds (unit: m·s-1) (a, b), sea surface net heat flux (c, d), shortwave radiation (e, f), and latent heat flux (unit: W·m-2) (g, h) for El Niño (a, c, e, g) and La Niña (b, d, f, h) events in the following early summer during positive AMO phase. The flux downward is positive, stippling and bold arrow indicates the anomalous field passes the 90% confidence test"

Fig. 5
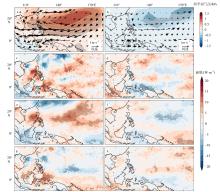
Fig. 6
Composites of anomalous sea-level pressure (unit: hPa) and 850 hPa winds (unit: m·s-1) (a, b), sea surface net heat flux (c, d), shortwave radiation (e, f), and latent heat flux (unit: W·m-2) (g, h) for El Niño (a, c, e, g) and La Niña (b, d, f, h) events in the following early summer during negative AMO phase. The flux downward is positive, stippling and bold arrow indicates the anomalous field passes the 90% confidence test"

Fig. 6
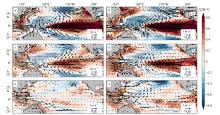
Fig. 7
Seasonal evolution of composited anomalous sea surface temperature (unit: ℃) and 850 hPa winds (unit: m·s-1) for El Niño events in winter (a, b), the following spring (c, d), and the following early summer (e, f) during positive (a, c, e) and negative (b, d, f) AMO phases. Stippling and bold arrow indicates the anomalous field passes the 90% confidence test"

Fig. 7
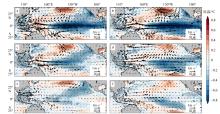
Fig. 8
Seasonal evolution of composited anomalous sea surface temperature (unit: ℃) and 850 hPa winds (unit: m·s-1) for La Niña events in winter (a, b), the following spring (c, d), and the following early summer (e, f) during positive (a, c, e) and negative (b, d, f) AMO phases. Stippling and bold arrow indicates the anomalous field passes the 90% confidence test"

Fig. 8
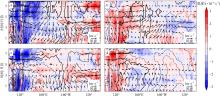
Fig. 9
Composite longitude-time sections of anomalous vorticity (shading; unit: ×10-6s-1) averaged over 10°-20°N, sea surface temperature (contour at an interval of 0.1 ℃) and 850 hPa winds (vector; unit: m·s-1) averaged over 5°-15°N for El Niño (a, c) and La Niña (b, d) events from winter to the following early summer during negative (a, b) and positive (c, d) AMO phases. The solid line is positive, and the dashed line is negative"

Fig. 9
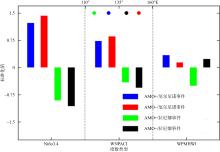
Fig. 10
Composites of the preceding winter Niño3.4 index, early summer WNPACI and WPMHWI for AMO+/El Niño (blue), AMO+/La Niña (green), AMO-/El Niño (red) and AMO-/La Niña (black). The scatter represents the longitude of the center of the Northwest Pacific anomalous anticyclone/cyclone"
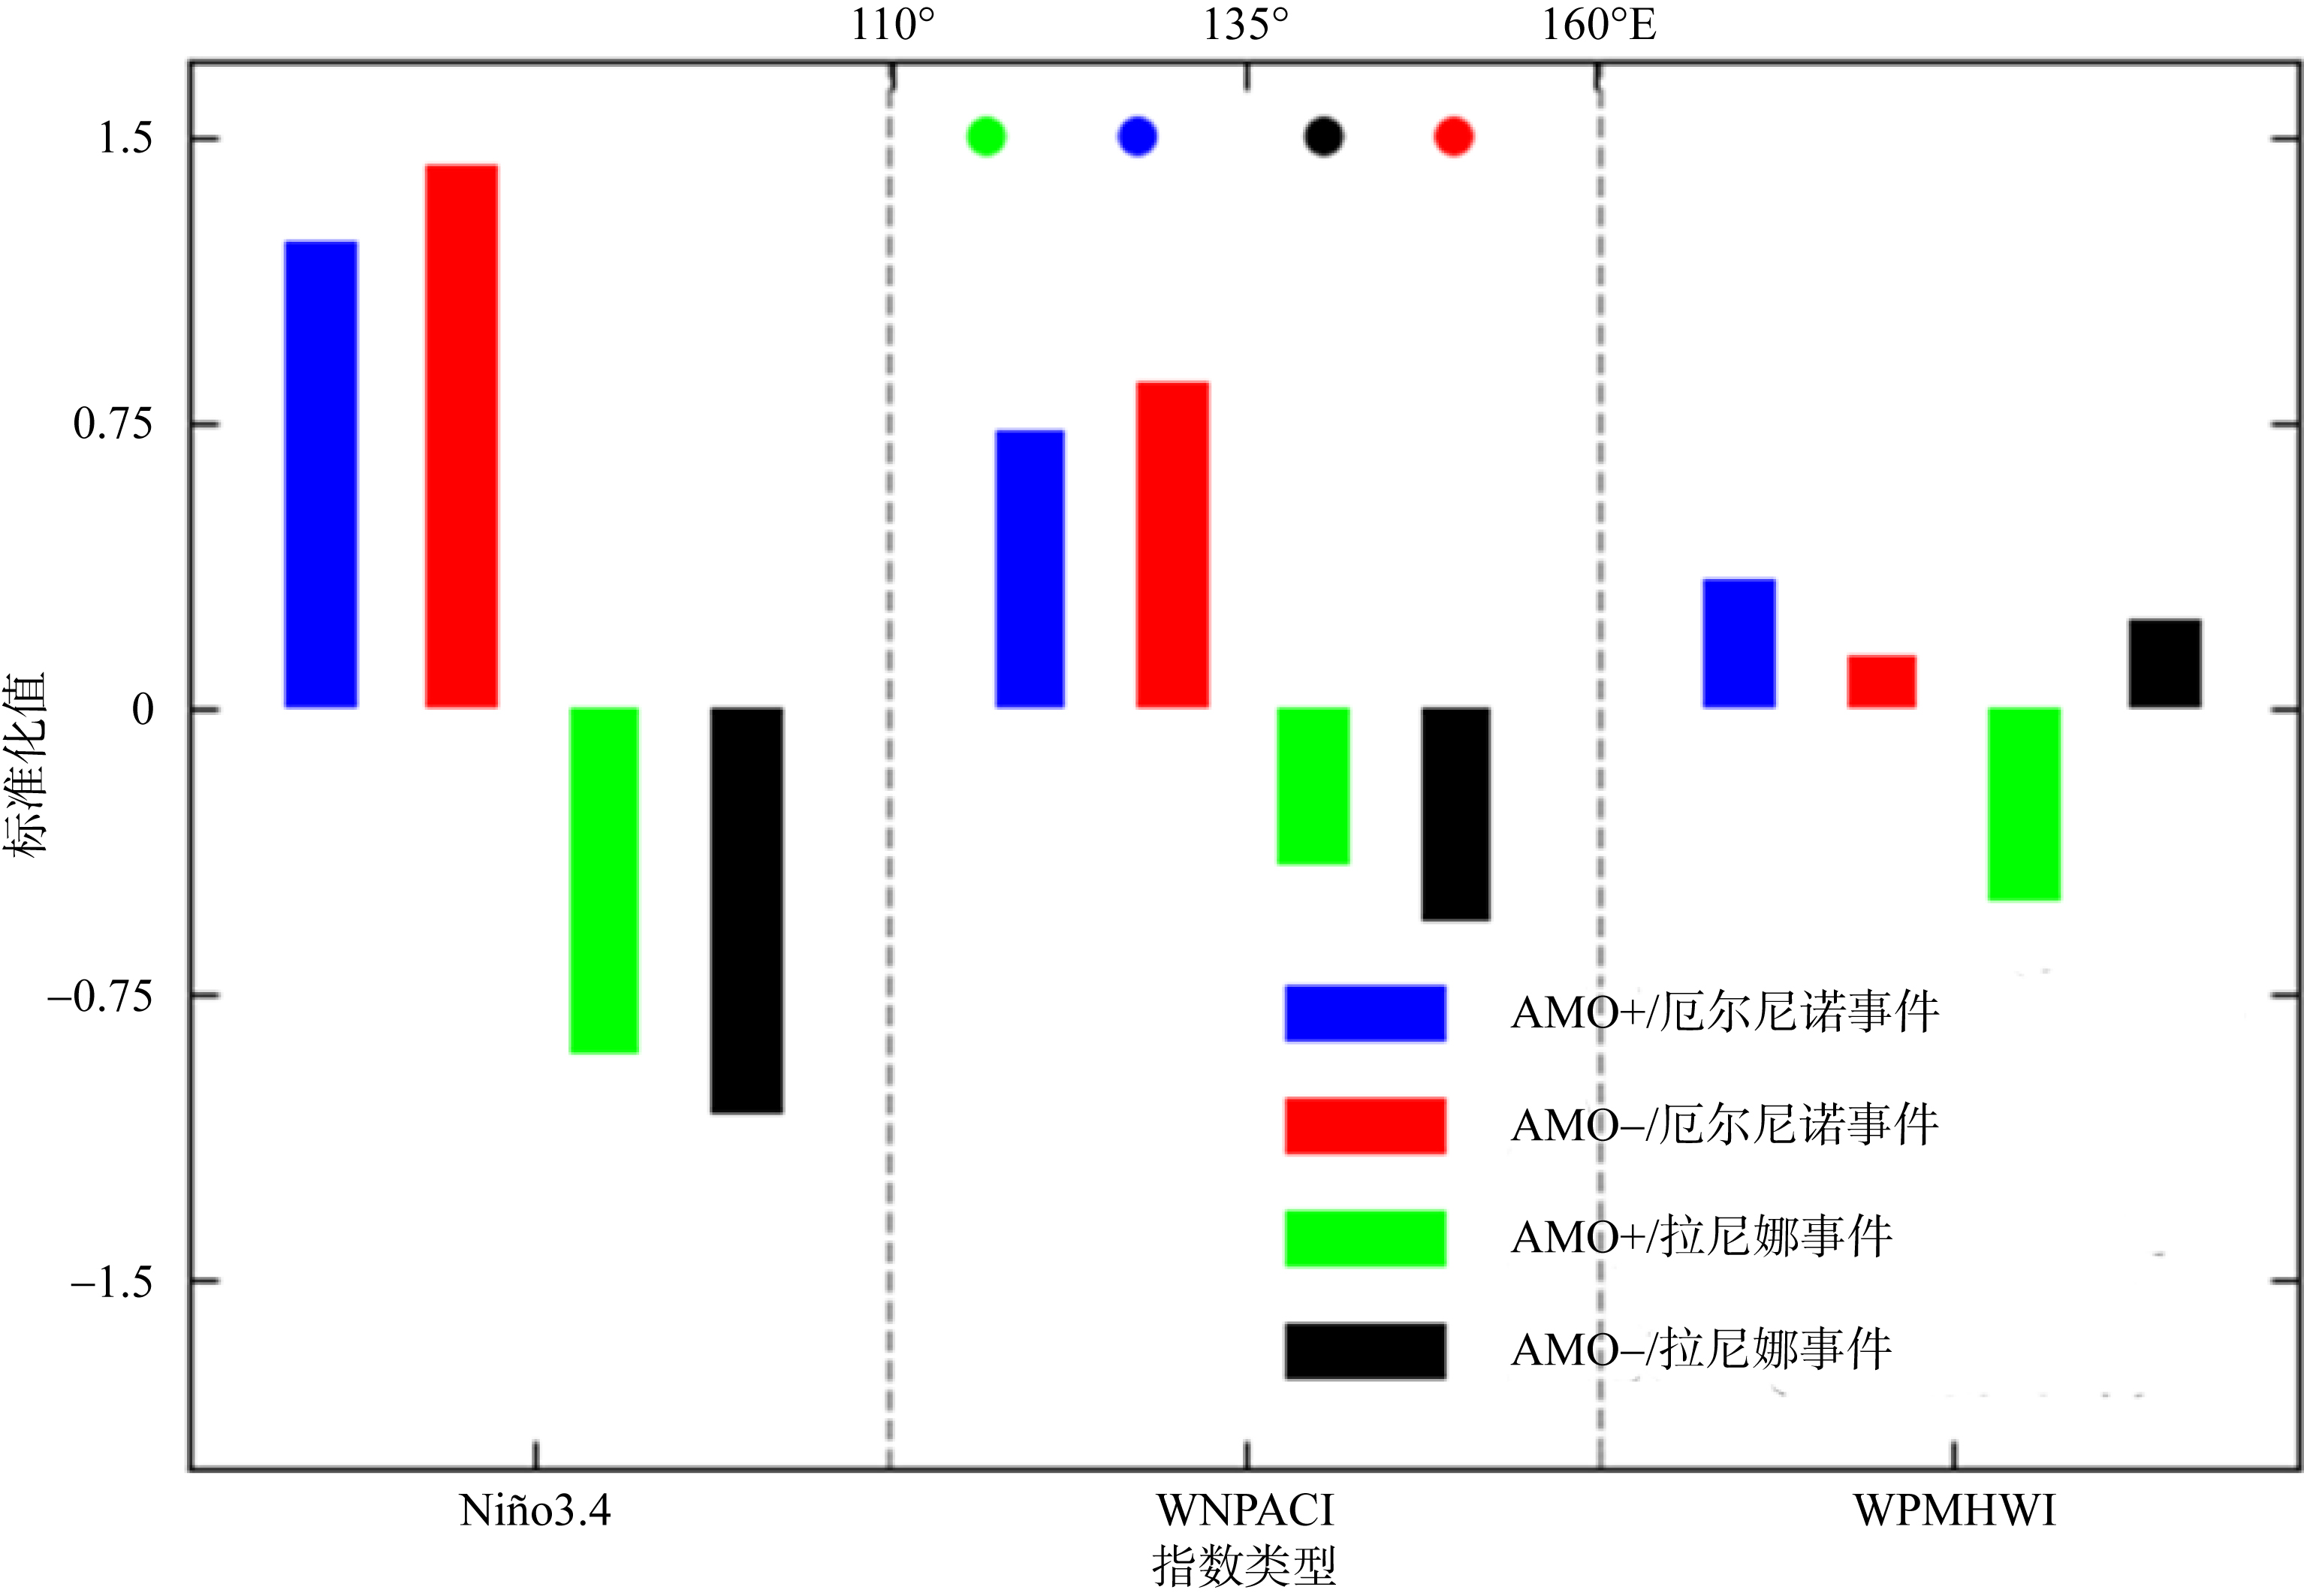
Fig. 10
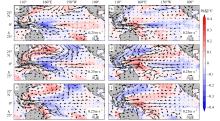
Fig. 11
Simulated differences of composites of sea surface temperature (unit: ℃) and 850 hPa winds (unit: m·s-1) for El Niño (a, c, e) and La Niña events (b, d, f) in winter (a, b), the following spring (c, d), and early summer (e, f) between negative and positive AMO phase experiment changes with the seasons"
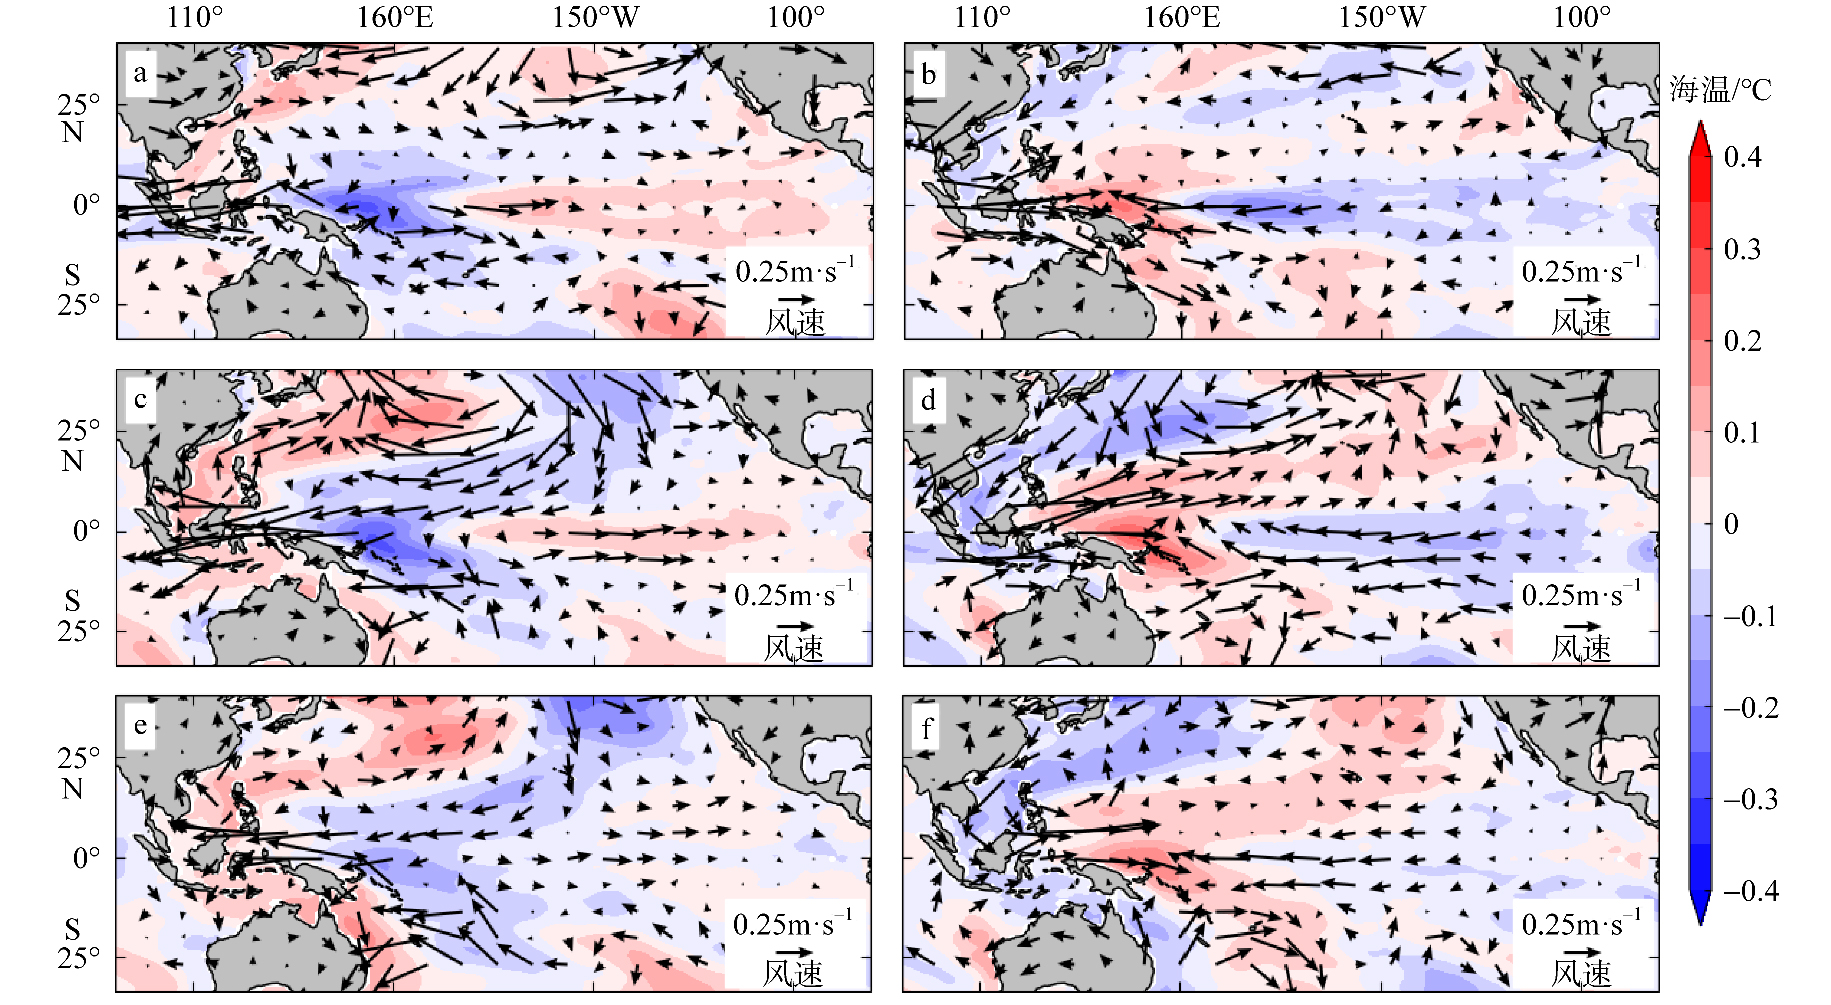
Fig. 11
Fig. 12
Schematic diagram of air-sea interactions for AMO−/El Niño (a), AMO−/La Niña (b), AMO+/El Niño (c) and AMO+/La Niña (d). The marker “AC” and “C” represents anticyclone and cyclone, respectively. Red shade and blue shade represent warm and cold anomalies, respectively, and the darker shading suggests that the sea temperature anomalies are relatively stronger. The black hollow arrows represent the 850 hPa wind anomalies, the thicker arrows suggests that the wind anomalies are relatively stronger, and the diamond represents the number of marine heatwaves in early summer, with more numbers indicating more marine heatwaves"
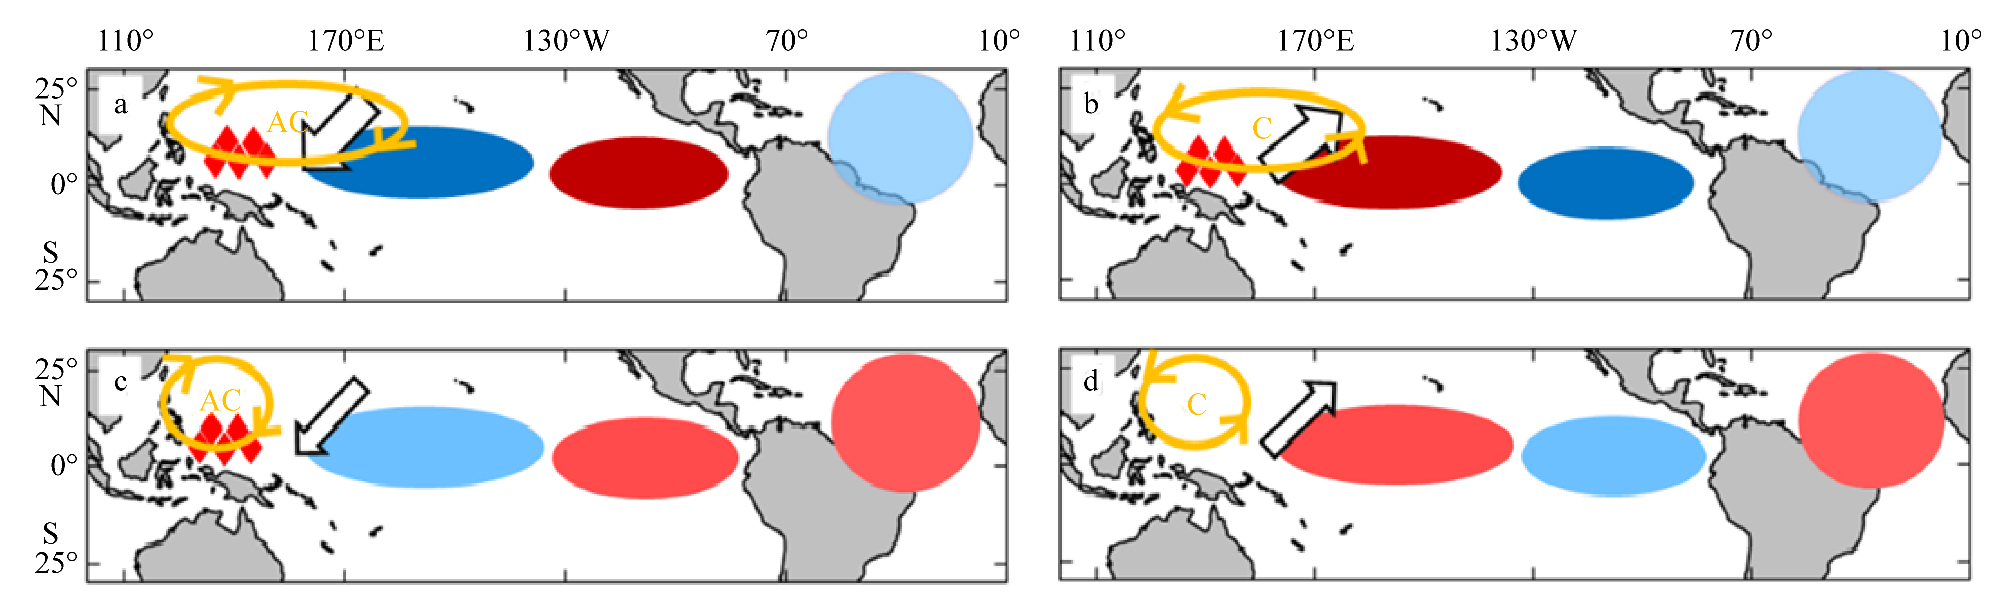
Fig. 12
| [1] |
胡石建, 李诗翰, 2022. 海洋热浪研究进展与展望[J]. 地球科学进展, 37(1): 51-64.
doi: 10.11867/j.issn.1001-8166.2021.121 |
|
doi: 10.11867/j.issn.1001-8166.2021.121 |
|
| [2] |
缪予晴, 徐海明, 刘佳伟, 2021. 西北太平洋夏季海洋热浪的变化特征及海气关系[J]. 热带海洋学报, 40(1): 31-43.
doi: 10.11978/2020016 |
|
doi: 10.11978/2020016 |
|
| [3] |
唐颢苏, 胡开明, 黄刚, 2019. El Niño衰退年夏季西北太平洋异常反气旋季节内演变特征及其机制[J]. 气候与环境研究, 24(4): 525-536.
|
|
|
|
| [4] |
王爱梅, 王慧, 范文静, 等, 2021. 2019年中国近海海洋热浪特征研究[J]. 海洋学报, 43(6): 35-44.
|
|
|
|
| [5] |
doi: 10.1038/s41467-023-36567-0 pmid: 36914643 |
| [6] |
|
| [7] |
|
| [8] |
|
| [9] |
|
| [10] |
doi: 10.1038/NCLIMATE3082 |
| [11] |
|
| [12] |
|
| [13] |
|
| [14] |
|
| [15] |
doi: 10.1038/srep01277 pmid: 23429502 |
| [16] |
|
| [17] |
|
| [18] |
|
| [19] |
|
| [20] |
|
| [21] |
doi: 10.1038/s41467-020-18241-x pmid: 32859903 |
| [22] |
|
| [23] |
|
| [24] |
doi: 10.1038/s41467-019-10206-z pmid: 31201309 |
| [25] |
|
| [26] |
|
| [27] |
|
| [28] |
|
| [29] |
|
| [30] |
doi: 10.1126/science.aba0690 pmid: 32973027 |
| [31] |
|
| [32] |
|
| [33] |
|
| [34] |
|
| [35] |
|
| [36] |
|
| [37] |
|
| [38] |
doi: 10.1007/s00382-019-04707-2 |
| [39] |
doi: 10.1038/ncomms16101 pmid: 28706247 |
| [40] |
doi: 10.1038/s41467-018-03732-9 pmid: 29636482 |
| [41] |
|
| [42] |
|
| [43] |
|
| [44] |
|
| [45] |
|
| [46] |
|
| [47] |
|
| [48] |
|
| [49] |
|
| [50] |
|
| [51] |
|
| [52] |
|
| [53] |
|
| [54] |
|
| [55] |
|
| [56] |
doi: 10.1073/pnas.1214626110 pmid: 23341624 |
| [57] |
|
| [58] |
|
| [59] |
|
| [60] |
|
| [61] |
|
| [62] |
|
| [63] |
|
| [64] |
|
| [65] |
|
| [66] |
|
| [67] |
|
| [68] |
|
| [1] | HAN Dingyan, LI Min, HU Rui, XIE Lingling. Variation and mechanisms of autumn tropical cyclones landed in Guangdong [J]. Journal of Tropical Oceanography, 2024, 43(1): 64-78. |
| [2] | QUAN Mengyuan, WANG Hui, LI Wenshan, WANG Aimei, LUO Jingxin. The interannual variation of summer upwelling in Zhoushan Islands and its relationship with ENSO [J]. Journal of Tropical Oceanography, 2024, 43(1): 48-55. |
| [3] | LI Chengyong, MENG Xiangfeng, XIE Ruihuang. Interdecadal modulation of ENSO asymmetry by the Pacific Decadal Oscillation and its mechanism [J]. Journal of Tropical Oceanography, 2023, 42(4): 36-46. |
| [4] | WEI Xue, QIN Xiaoming, CHEN Suhua, ZHANG Kaijia, LIN Haisheng, ZHENG Huina, GAO Jialong. Study on the effect of Oyster hydrolysates on improving Lactation function in Postpartum hypogalactism [J]. Journal of Tropical Oceanography, 2023, 42(2): 141-152. |
| [5] | ZHANG Yuhong, ZHANG Lianyi, DU Yan. Tropical ocean-atmosphere coupling modes and their relationship with ENSO during spring* [J]. Journal of Tropical Oceanography, 2023, 42(2): 34-44. |
| [6] | ZHANG Qi, LIAN Tao. Low-frequency wind stress forcing reduces El Niño diversity in numerical model [J]. Journal of Tropical Oceanography, 2023, 42(1): 1-9. |
| [7] | YANG Shaoqiong, CHENG Dan, CHEN Guangyao, LUO Chenyi, NIU Wendong, MA Wei, FA Shuai. Review on the application of underwater gliders for observing typical ocean phenomena [J]. Journal of Tropical Oceanography, 2022, 41(3): 54-74. |
| [8] | Jun WANG,Yan QIU,Pin YAN,M DELESCLUSE,Yanlin WANG,M PUBELLIER,Xin NIE. A joint investigation using OBS, multi-channel seismic and gravity data across the southwestern sub-basin of the South China Sea [J]. Journal of Tropical Oceanography, 2019, 38(4): 81-90. |
| [9] | Wenhao CAO, Jin YAN, Meiping FENG, Shuaishuai HAN, Mingqing LIN. Effects of salinity on larval development of two common barnacles from the southeast coast of China [J]. Journal of Tropical Oceanography, 2018, 37(6): 85-91. |
| [10] | Wenxi CAO, Zhaohua SUN, Cai LI, Guowang ZOU. Biofouling protection for water quality monitoring buoy and sensors [J]. Journal of Tropical Oceanography, 2018, 37(5): 7-12. |
| [11] | Xiaoqiu YANG, Xiaobin SHI, Junfeng ZHAO, Chuanhai YU, Hongfang GAO, Aihua CHEN, Yuanzheng LU, Xianrong CEN, Weiren LIN, Xin ZENG, Hehua XU, Ziqiang REN, Shengqi ZHOU, Ziying XU, Jinlong SUN, Nana KAMIYA, Jian LIN. Bottom water temperature measurements in the South China Sea, eastern Indian Ocean and western Pacific Ocean* [J]. Journal of Tropical Oceanography, 2018, 37(5): 86-97. |
| [12] | Huawei QIN, Zhuo TAO, Huaiming LI, Xihe YUE, Zhen CAI, Sheng CHEN, Hongwei ZHOU, Ying YE. Development and application of chemical sensor for hydrothermal vents detection [J]. Journal of Tropical Oceanography, 2018, 37(3): 86-92. |
| [13] | Jiguang LI, Dongkai WANG. Research on ghost suppression and notch compensation of dual-sensor ocean bottom cable data [J]. Journal of Tropical Oceanography, 2018, 37(2): 100-104. |
| [14] | Lianghong LÜ, Xiaotong ZHENG. The effect of Indian Ocean Basin mode on Indian Summer Monsoon Rainfall in decaying year of El Niño [J]. Journal of Tropical Oceanography, 2017, 36(2): 1-11. |
| [15] | YANG Yali, DU Yan. Decadal variability of oceanic advection in the South China Sea associated with ENSO and Indian-Ocean Basin and its impacts on SST [J]. Journal of Tropical Oceanography, 2016, 35(1): 72-81. |
|
||