
Journal of Tropical Oceanography ›› 2020, Vol. 39 ›› Issue (1): 20-35.doi: 10.11978/2019035CSTR: 32234.14.2019035
• Marine Hydrology • Previous Articles Next Articles
Spring-neap tidal variation and mechanism analysis of the maximum turbidity in the Pearl River Estuary during flood season
YAN Dong1,2,4, SONG Dehai1,3( ), BAO Xianwen1,2,3
- 1. Key Laboratory of Physical Oceanography, Ministry of Education, Ocean University of China, Qingdao 266003, China
2. College of Oceanic and Atmospheric Sciences, Ocean University of China, Qingdao 266100, China
3. Qingdao National Laboratory for Marine Science and Technology, Qingdao 266237, China
-
Received:2019-04-08Revised:2019-05-15Online:2020-01-20Published:2020-01-09 -
Contact:Dehai SONG E-mail:songdh@ouc.edu.cn -
Supported by:National Natural Science Foundation of China(41876088);National Natural Science Foundation of China(41406097);National Natural Science Foundation of China(41476030)
CLC Number:
- P731.21
Cite this article
YAN Dong, SONG Dehai, BAO Xianwen. Spring-neap tidal variation and mechanism analysis of the maximum turbidity in the Pearl River Estuary during flood season[J].Journal of Tropical Oceanography, 2020, 39(1): 20-35.
share this article
Add to citation manager EndNote|Reference Manager|ProCite|BibTeX|RefWorks

Fig. 1
Bathymetry map of the Pear River Estuary with marked stations and sections used in this study"
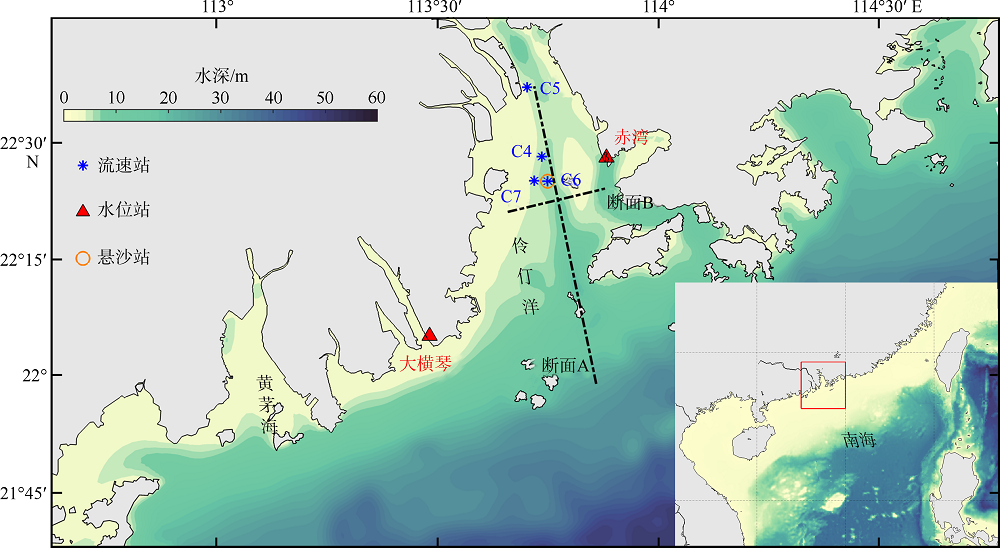
Fig. 1
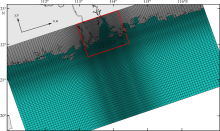
Fig. 2
Sketch of the computing grid in ROMS"
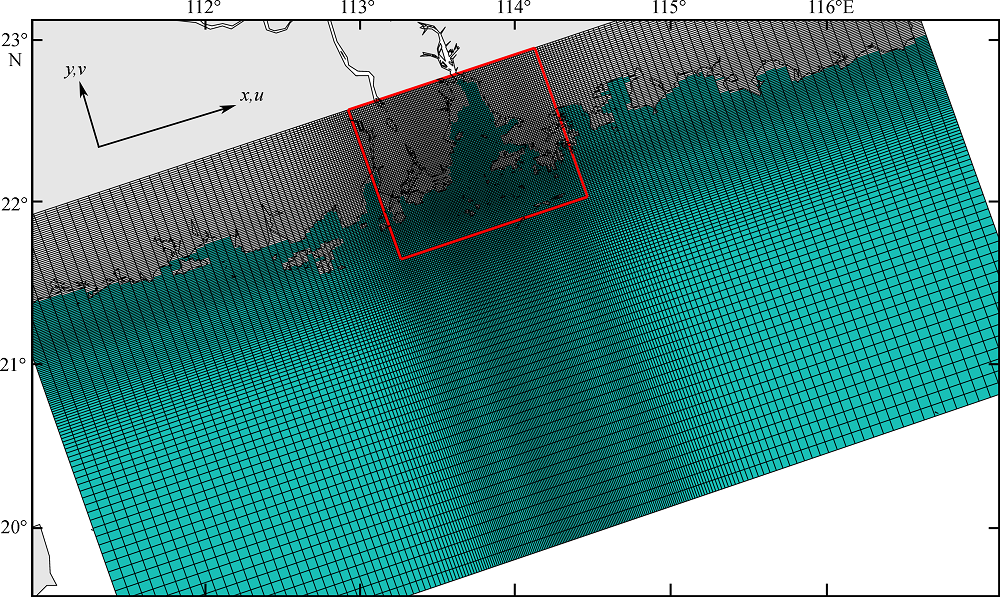
Fig. 2
Tab. 1
Monthly averaged water and sediment discharge of the Pearl River at the eight outlets"
| 月份 | 径流量/亿m3 | 输沙量/万t | ||||||||||||||
|---|---|---|---|---|---|---|---|---|---|---|---|---|---|---|---|---|
| 虎门 | 蕉门 | 洪奇门 | 横门 | 磨刀门 | 鸡啼门 | 虎跳门 | 崖门 | 虎门 | 蕉门 | 洪奇门 | 横门 | 磨刀门 | 鸡啼门 | 虎跳门 | 崖门 | |
| 1月 | 29.41 | 10.96 | 9.61 | 11.98 | 20.52 | 2.34 | 3.24 | 3.94 | 4.47 | 3.52 | 2.75 | 3.63 | 5.61 | 0.83 | 0.89 | 0.93 |
| 2月 | 39.26 | 18.83 | 13.73 | 13.46 | 23.06 | 2.62 | 3.64 | 4.43 | 12.90 | 12.69 | 6.20 | 1.54 | 2.38 | 0.35 | 0.38 | 0.40 |
| 3月 | 61.77 | 32.58 | 21.10 | 16.48 | 28.24 | 3.21 | 4.46 | 5.43 | 59.48 | 90.60 | 42.53 | 5.66 | 8.76 | 1.30 | 1.39 | 1.46 |
| 4月 | 91.62 | 51.91 | 35.04 | 29.90 | 51.20 | 5.83 | 8.08 | 9.84 | 132.92 | 161.64 | 84.72 | 37.52 | 58.02 | 8.62 | 9.21 | 9.66 |
| 5月 | 94.76 | 55.84 | 42.53 | 44.58 | 76.35 | 8.69 | 12.06 | 14.67 | 122.46 | 180.75 | 108.19 | 83.68 | 129.42 | 19.22 | 20.54 | 21.55 |
| 6月 | 131.63 | 75.63 | 65.23 | 79.93 | 136.91 | 15.58 | 21.62 | 26.31 | 188.49 | 244.94 | 209.87 | 309.58 | 478.78 | 71.12 | 76.00 | 79.72 |
| 7月 | 104.32 | 57.06 | 66.66 | 105.06 | 179.94 | 20.48 | 28.41 | 34.58 | 105.48 | 137.23 | 223.73 | 502.64 | 777.35 | 115.47 | 123.40 | 129.43 |
| 8月 | 100.37 | 41.95 | 48.06 | 74.79 | 128.10 | 14.58 | 20.23 | 24.62 | 98.28 | 63.12 | 105.01 | 237.73 | 367.66 | 54.61 | 58.36 | 61.22 |
| 9月 | 69.29 | 27.74 | 28.39 | 40.76 | 69.82 | 7.95 | 11.02 | 13.42 | 53.13 | 26.46 | 35.23 | 72.40 | 111.97 | 16.63 | 17.77 | 18.64 |
| 10月 | 42.63 | 18.66 | 19.90 | 29.47 | 50.48 | 5.75 | 7.97 | 9.70 | 22.57 | 26.46 | 24.64 | 39.56 | 61.17 | 9.09 | 9.71 | 10.19 |
| 11月 | 30.71 | 12.27 | 12.70 | 18.39 | 31.50 | 3.59 | 4.97 | 6.05 | 9.55 | 5.08 | 12.39 | 31.36 | 48.49 | 7.20 | 7.70 | 8.07 |
| 12月 | 27.23 | 9.56 | 9.06 | 12.19 | 20.88 | 2.38 | 3.30 | 4.01 | 31.26 | 3.52 | 3.74 | 6.71 | 10.37 | 1.54 | 1.65 | 1.73 |
Tab. 1
Tab. 2
Parameters used in the suspended-sediment model"
| 参数名 | 代表含义 | 数值 | 单位 |
|---|---|---|---|
| MUD_SD50 | 黏性泥沙中值粒径 | 31.25, 15.60, 7.80, 3.90, 1.95 | μm |
| SAND_SD50 | 无黏泥沙中值粒径 | 0.50, 0.25, 0.13, 0.07 | mm |
| MUD_WSED | 黏性泥沙沉降速度 | 0.62, 0.3, 0.12, 0.04, 0.01 | mm/s-1 |
| SAND_WSED | 无黏泥沙沉降速度 | 57.6, 27.0, 8.7, 2.4 | mm·s-1 |
| MUD_ERATE | 黏性泥沙侵蚀率 | 1E-5, 1E-5, 1E-5, 1E-5, 1E-5 | kg·m-2·s-1 |
| SAND_ERATE | 无黏泥沙侵蚀率 | 1E-5, 1E-5, 1E-5, 1E-5 | kg·m-2·s-1 |
| MUD_TAU_CE | 黏性泥沙临界侵蚀应力 | 0.06, 0.05, 0.04, 0.04, 0.03 | N·m-2 |
| SAND_TAU_CE | 无黏泥沙临界侵蚀应力 | 0.27, 0.19, 0.14, 0.09 | N·m-2 |
Tab. 2

Fig. 3
Comparisons between observed and simulated water levels at Station Dahengqin (a, c) and Station Chiwan (b, d). The left column shows water level comparison; the right column shows the evaluation index. r2 stands for the determination coefficient, while rn stands for the standardized root mean square error. "
Fig. 3
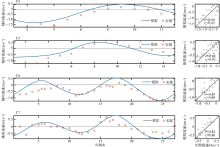
Fig. 4
Comparison between observed and simulated surface velocities at stations C4, C5, C6, and C7. The left column shows velocity comparison, and the right column shows correlation index. r2 represents the determination coefficient, and rn represents the standardized root mean square error. The observation time is July 25-26 for stations C4 and C5, and July 23-24 for stations C6 and C7, during the middle tide"
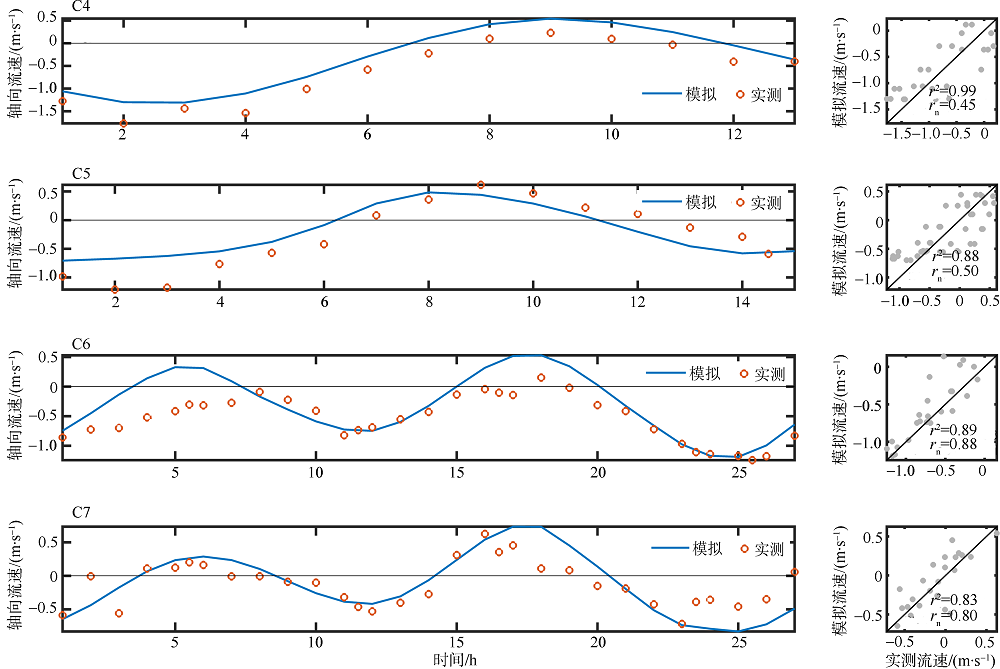
Fig. 4
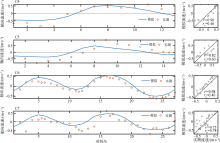
Fig. 5
Comparison between observed and simulated bottom velocities at stations C4, C5, C6, and C7. The left column shows velocity comparison, and the right column shows correlation index. r2 represents the determination coefficient, and rn represents the standardized root mean square error. The observation time is July 25-26 for stations C4 and C5, and July 23-24 for stations C6 and C7, during the middle tide"
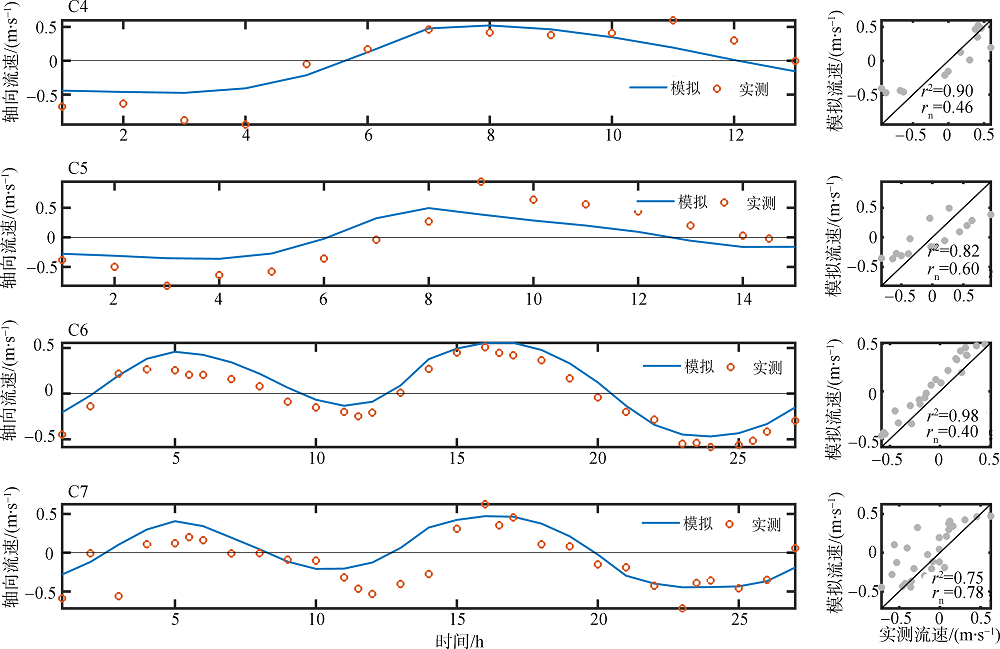
Fig. 5
Fig. 6
Simulated suspended sediment concentration at (a) surface and (b) bottom. (c) is the Landsat image (Wang et al, 2018) during flood season"
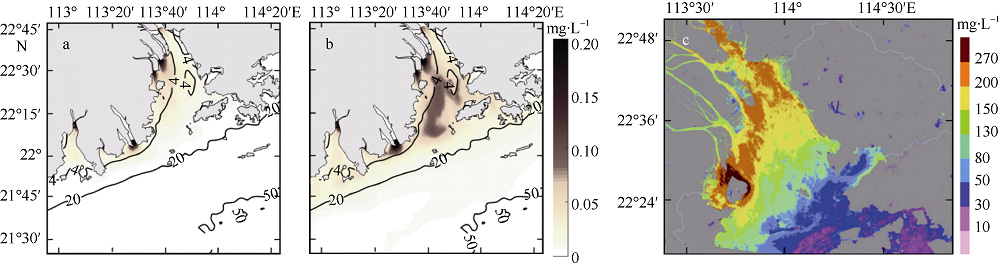
Fig. 6
Fig. 7
Comparison between observed and simulated suspended sediment concentration at Station C6. a) Surface concentration; b) mid-depth concentration; c) bottom concentration; d) correlation index diagram. The observation time is July 23-24"
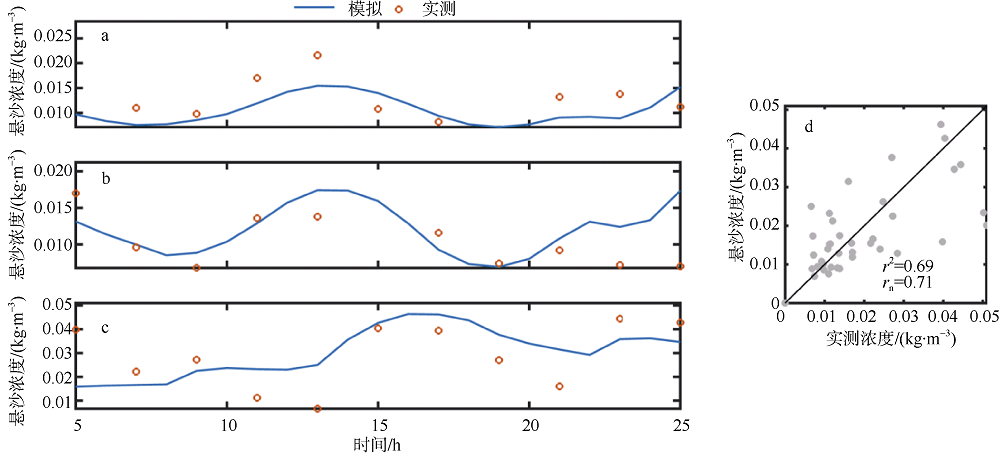
Fig. 7
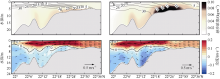
Fig. 8
Salinity, suspended sediment concentration, and residual current along Section A during (a, c) neap and (b, d) spring tides. Note that the vertical velocity is enlarged by 500 in (c) and (d). Isolines in (a) and (b) represent salinity "

Fig. 8

Fig. 9
Salinity, suspended sediment concentration, and residual current along Section B during. (a, c) neap and (b, d) spring tides. Note that the vertical velocity is enlarged by 500 in (c) and (d). Isolines in (a) and (b) represent salinity "
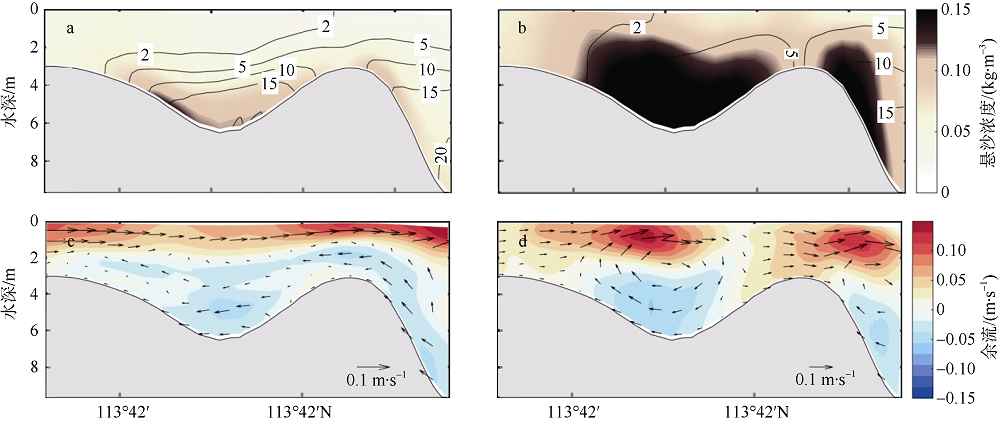
Fig. 9
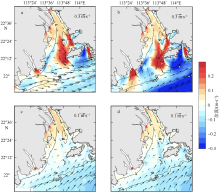
Fig. 10
(a, b) Surface and (c, d) bottom residual currents during (a, c) neap and (b, d) spring tides. The color indicates the flow velocity in the north-south direction, positive seaward"

Fig. 10
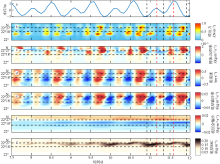
Fig. 11
Bottom stress (b), erosion-deposition rate (c), bottom velocity (d, positive seaward), bottom sediment transport rate (e), residual sediment transport (f), and suspended sediment concentration (g) along Section A. The horizontal dotted line indicates the position of the turbidity maximum zone. The vertical black line represents the low tide level, and the vertical red line represents the high tide level. The velocity and sediment transport rate are positive to the south"

Fig. 11
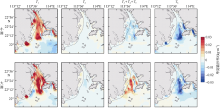
Fig. 12
Decomposition of longitudinal suspended sediment transport during neap (top panel) and spring (bottom panel) tides, respectively. Positive means southward. The top row represents neap tides, and the bottom row represents spring tides. From left to right, the graphs show Euler transport, Stokes transport, tidal pumping, and vertical shear transport "
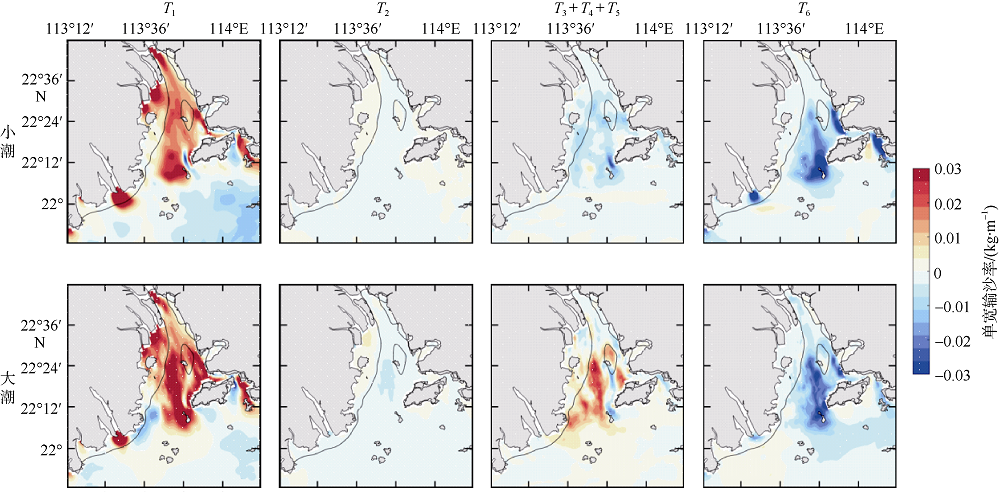
Fig. 12

Fig. 13
Suspended sediment transport induced by different mechanisms during neap (top panel) and spring (bottom panel) tides. The color represents the divergence of each transport term. Convergence is shown as positive value, and divergence is, negative. The top row represents neap tides, and the bottom row represents spring tides. From left to right, the graphs show Euler transport, Stokes transport, tidal pump effect, and vertical shear "

Fig. 13
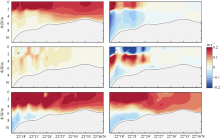
Fig. 14
Decomposition of longitudinal residual current during spring tides. Southward is positive. a) Runoff-induced residual flow UR; b) density-induced residual flow UD; c) nonlinearity-induced residual flow UN; d) mixing asymmetry-induced residual flow UA; e) sum of the four items; f. original residual flow"

Fig. 14
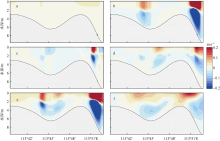
Fig. 15
Decomposition of lateral residual current during spring tides. Eastward is positive. a) Runoff-induced residual flow UR; b) density-induced residual flow UD; c) nonlinearity-induced residual flow UN; d) mixing asymmetry-induced residual flow UA; e) sum of the four items; f. original residual flow"

Fig. 15
| [1] | 陈卓英, 倪培桐 , 2003. 珠江黄茅海河口湾悬沙纵向输运机制分析[J]. 人民珠江, (6): 27-29, 43. |
| CHEN ZHUOYING, NI PEITONG , 2003. Mechanisms on the longitudinal suspended sediment transport in Huangmaohai estuary of the Pearl River[J]. Pearl River, (6): 27-29, 43. (in Chinese). | |
| [2] | 江四义, 郑兆勇 , 2008. 从珠江口沉积物粒度参数特征分析泥沙来源及其运移趋势[J]. 中山大学学报(自然科学版), 47(S1):126-129. |
| JIANG SIYI, ZHENG ZHAOYONG , 2008. Sediment sources and transport tendency based on grain-size parameters in estuary of the Pearl River[J]. Acta Scientiarum Naturalium Universitatis Sunyatseni, 47(S1):126-129 (in Chinese with English abstract). | |
| [3] | 沈焕庭, 贺松林, 茅志昌 , 等, 2001. 中国河口最大浑浊带刍议[J]. 泥沙研究, (1):23-29. |
| SHEN HUANTING, HE SONGLIN, MAO ZHICHANG , et al, 2001. On the turbidity maximum in the Chinese estuaries[J]. Journal of Sediment Research, (1):23-29 (in Chinese with English abstract). | |
| [4] | 时钟 , 2000. 长江口细颗粒泥沙过程[J]. 泥沙研究, (6):72-80. |
| SHI ZHONG , 2000. Fine sediment processes in the Changjiang (Yangtze) River estuary[J]. Journal of Sediment Research, (6):72-80 (in Chinese with English abstract). | |
| [5] | 孙志林 , 1993. 中国强混合河口最大浑浊区成因研究[J]. 海洋学报, 15(3):63-72. |
| SUN ZHILIN , 1993. Formation of the turbidity maxima in well-mixed estuaries of China[J]. Acta Oceanologica Sinica, 15(3):63-72 (in Chinese). | |
| [6] | 田向平 , 1986. 珠江河口伶仃洋最大混浊带研究[J]. 热带海洋学报, 5(2):27-35. |
| TIAN XIANGPING , 1986. A study on turbidity maximum in Lingdingyang estuary of the Pearl River[J]. Tropic Oceanology, 5(2):27-35 (in Chinese with English abstract). | |
| [7] | 王彪 , 2014. 伶仃洋河口环流特征及其动力机制分析[J]. 水动力学研究与进展A辑, 29(5):608-617. |
| WANG BIAO , 2014. Analysis on the estuarine circulation and its dynamic mechanism in the Lingdingyang Bay[J]. Chinese Journal of Hydrodynamics, 29(5):608-617 (in Chinese with English abstract). | |
| [8] | 王崇浩, 韦永康 , 2006. 三维水动力泥沙输移模型及其在珠江口的应用[J]. 中国水利水电科学研究院学报, 4(4):246-252. |
| WANG CHONGHAO, WAI O W H , 2006. Three-dimensional modelling of sediment transport in the Pearl River Estuary[J]. Journal of China Institute of Water Resources and Hydropower Research, 4(4):246-252 (in Chinese with English abstract). | |
| [9] | 肖志建 , 2012. 珠江河口及邻近海域表层沉积物特征及其泥沙运移趋势[J]. 海洋通报, 31(5):481-488. |
| XIAO ZHIJIAN , 2012. Characteristics and transport trend of surface sediments in Pearl River Estuary and the adjacent sea area[J]. Marine Science Bulletin, 31(5):481-488 (in Chinese with English abstract). | |
| [10] | 杨江平, 刘文涛 , 2015. 近30年珠江口内伶仃洋洪季最大浑浊带的变化特征[J]. 珠江水运, (16):58-62. |
| YANG JIANGPING, LIU WENTAO , 2015. Characteristics of the turbidity maximum in Lingdingyang estuary of the Pearl River during the flood season in recent 30 years[J]. Pearl River Water Transport, (16):58-62 (in Chinese). | |
| [11] | 朱泽南, 王惠群, 管卫兵 , 等, 2013. 丰水期珠江口黏性泥沙输运的三维数值模拟[J]. 海洋学研究, 31(3):25-35. |
| ZHU ZENAN, WANG HUIQUN, GUAN WEIBING , et al, 2013. 3D numerical study on cohesive sediment dynamics of the Pearl River Estuary in the wet season[J]. Journal of Marine Sciences, 31(3):25-35 (in Chinese with English abstract). | |
| [12] | CHENG PENG, VALLE-LEVINSON A, DE SWART H E , 2011. A numerical study of residual circulation induced by asymmetric tidal mixing in tidally dominated estuaries[J]. Journal of Geophysical Research: Oceans, 116:C01017. |
| [13] |
CHENG PENG, DE SWART H E, VALLE-LEVINSON A , 2013. Role of asymmetric tidal mixing in the subtidal dynamics of narrow estuaries[J]. Journal of Geophysical Research: Oceans, 118(5):2623-2639.
doi: 10.1002/jgrc.20189 |
| [14] |
DONG LIXIAN, SU JILAN, WONG L A , et al, 2004. Seasonal variation and dynamics of the Pearl River plume[J]. Continental Shelf Research, 24(16):1761-1777.
doi: 10.1016/j.csr.2004.06.006 |
| [15] |
DYER K R , 1974. The salt balance in stratified estuaries[J]. Estuarine and Coastal Marine Science, 2(3):273-281.
doi: 10.1016/0302-3524(74)90017-6 |
| [16] | DYER K R , 1995. Sediment transport processes in estuaries[M] //Developments in Sedimentology. Amsterdam: Elsevier, 53:423-449. |
| [17] |
FUGATE D C, FRIEDRICHS C T, SANFORD L P , 2007. Lateral dynamics and associated transport of sediment in the upper reaches of a partially mixed estuary, Chesapeake Bay, USA[J]. Continental Shelf Research, 27(5):679-698.
doi: 10.1016/j.csr.2006.11.012 |
| [18] |
GEYER W R, WOODRUFF J D, TRAYKOVSKI P , 2001. Sediment transport and trapping in the Hudson River estuary[J]. Estuaries, 24(5):670-679.
doi: 10.2307/1352875 |
| [19] |
GRASSO F, VERNEY R, LE HIR P , et al, 2018. Suspended sediment dynamics in the macrotidal Seine Estuary (France): 1. Numerical modeling of turbidity maximum dynamics[J]. Journal of Geophysical Research: Oceans, 123(1):558-577.
doi: 10.1002/2017JC013185 |
| [20] | JAY D A, MUSIAK J D , 1994. Particle trapping in estuarine tidal flows[J]. Journal of Geophysical Research: Oceans, 99(C10):20445-20461. |
| [21] |
JI XIAOMEI, SHENG JINYU, TANG LIQUN , et al, 2011. Process study of circulation in the Pearl River Estuary and adjacent coastal waters in the wet season using a triply-nested circulation model[J]. Ocean Modelling, 38(1-2):138-160.
doi: 10.1016/j.ocemod.2011.02.010 |
| [22] |
LAI ZHIGANG, MA RONGHUA, GAO GUANGYIN , et al, 2015. Impact of multichannel river network on the plume dynamics in the Pearl River estuary[J]. Journal of Geophysical Research: Oceans, 120(8):5766-5789.
doi: 10.1002/2014JC010490 |
| [23] |
LIU FENG, HU SHUAI, GUO XIAOJUAN , et al, 2018. Recent changes in the sediment regime of the Pearl River (South China): Causes and implications for the Pearl River Delta[J]. Hydrological Processes, 32(12):1771-1785.
doi: 10.1016/j.ejmp.2016.08.012 pmid: 27570121 |
| [24] | LIU RUNQI, WANG YAPING, GAO JIANHUA , et al, 2016. Turbidity maximum formation and its seasonal variations in the Zhujiang (Pearl River) Estuary, southern China[J]. Acta Oceanologica Sinica, 35(8):22-31. |
| [25] | MADSEN O S, 1994. Spectral wave-current bottom boundary layer flows [C]//Proceedings of the 24th international conference on coastal engineering. Kobe, Japan: American Society of Civil Engineers: 384-398. |
| [26] |
MCSWEENEY J M, CHANT R J, SOMMERFIELD C K , 2016. Lateral variability of sediment transport in the Delaware Estuary[J]. Journal of Geophysical Research: Oceans, 121(1):725-744.
doi: 10.1002/jgrc.v121.1 |
| [27] | SCULLY M E, FRIEDRICHS C T , 2007. Sediment pumping by tidal asymmetry in a partially mixed estuary[J]. Journal of Geophysical Research: Oceans, 112:C07028. |
| [28] |
SONG DEHAI, WANG XIAOHUA , 2013. Suspended sediment transport in the Deepwater Navigation Channel, Yangtze River Estuary, China, in the dry season 2009: 2. Numerical simulations[J]. Journal of Geophysical Research: Oceans, 118(10):5568-5590.
doi: 10.1002/jgrc.20411 |
| [29] | STYLES R, GLENN S M , 2000. Modeling stratified wave and current bottom boundary layers on the continental shelf[J]. Journal of Geophysical Research: Oceans, 105(C10):24119-24139. |
| [30] |
TANG LIQUN, SHENG JINYU, JI XIAOMEI , et al, 2009. Investigation of three-dimensional circulation and hydrography over the Pearl River Estuary of China using a nested-grid coastal circulation model[J]. Ocean Dynamics, 59(6):899-919.
doi: 10.1007/s10236-009-0218-1 |
| [31] |
WAI O W H, WANG C H, LI Y S , et al, 2004. The formation mechanisms of turbidity maximum in the Pearl River estuary, China[J]. Marine Pollution Bulletin, 48(5-6):441-448.
doi: 10.1016/j.marpolbul.2003.08.019 pmid: 14980460 |
| [32] |
WANG CHONGYANG, LI WEIJIAO, CHEN SHUISEN , et al, 2018. The spatial and temporal variation of total suspended solid concentration in Pearl River Estuary during 1987-2015 based on remote sensing[J]. Science of the Total Environment, 618:1125-1138.
doi: 10.1016/j.scitotenv.2017.09.196 pmid: 29102182 |
| [33] |
WARNER J C, SHERWOOD C R, SIGNELL R P , et al. Development of a three-dimensional, regional, coupled wave, current, and sediment-transport model[J]. Computers & Geosciences, 2008,34(10):1284-1306.
doi: 10.1371/journal.pone.0226611 pmid: 31910214 |
| [34] |
WOLANSKI E, SPAGNOL S, KING B , et al, 1999. Patchiness in the Fly River plume in Torres strait[J]. Journal of Marine Systems, 18(4):369-381.
doi: 10.1016/S0924-7963(98)00020-7 |
| [35] | WONG L A, CHEN J C, XUE H , et al, 2003. A model study of the circulation in the Pearl River Estuary (PRE) and its adjacent coastal waters: 1. Simulations and comparison with observations[J]. Journal of Geophysical Research: Oceans, 108(C5):3156. |
| [36] |
ZHANG WEI, WEI XIAOYAN, ZHENG JINHAI , et al, 2012. Estimating suspended sediment loads in the Pearl River Delta region using sediment rating curves[J]. Continental Shelf Research, 38:35-46.
doi: 10.1016/j.csr.2012.02.017 |
| [1] | SONG Xingyu, LIN Yajun, ZHANG Liangkui, XIANG Chenhui, HUANG Yadong, ZHENG Chuanyang. Distribution characteristics and influencing factors of meso- and micro-zooplankton communities in the offshore waters of the Guangdong-Hong Kong-Macao Greater Bay Area* [J]. Journal of Tropical Oceanography, 2023, 42(3): 136-148. |
| [2] | TANG Ling, NIE Yuhua, WANG Ping, TANG Chaolian. Trend analysis of marine heatwaves variability in the outer Pearl River estuary from 1974 to 2020 [J]. Journal of Tropical Oceanography, 2022, 41(6): 143-150. |
| [3] | SHANG Bowen, WU Yunchao, JIANG Zhijian, LIU Songlin, HUANG Xiaoping. Characteristics and sources of organic matter in sediments of the Pearl River Estuary: Carbon storage implications [J]. Journal of Tropical Oceanography, 2022, 41(3): 16-28. |
| [4] | YIN Tianqi, WANG Qing, YANG Yufeng, CEN Jingyi. Comparative study on zooplankton community structure in Pearl River Estuary based on morphological and DNA identification [J]. Journal of Tropical Oceanography, 2022, 41(3): 172-185. |
| [5] | ZENG Dianting, LI Junyi, XIE Lingling, YE Xiaomin, ZHOU Da. Analysis of temporal characteristics of chlorophyll a in Lingding Bay during summer [J]. Journal of Tropical Oceanography, 2022, 41(2): 16-25. |
| [6] | SHUAI Yiping, CHEN Yinchao, LIU Zijia, GE Zaiming, MA Mengzhen, ZHANG Yuanfang, LI Qian. Distribution of Pearl-River diluted water and its ecological characteristics during spring monsoon transitional period in 2016* [J]. Journal of Tropical Oceanography, 2021, 40(5): 63-71. |
| [7] | LAN Xuan, LI Feng, ZHANG Chao, DONG Hanying, YANG Qingshu, YU Minghui, WEN Rubing, YANG Yujie. Ecological risk assessment of thallium in Pearl River Estuary and network based on the SOM model [J]. Journal of Tropical Oceanography, 2021, 40(3): 132-142. |
| [8] | CAI Jiannan, LIU Hailong, JIANG Bo, CHEN Yinhui, LI Jiehong, WU Sixiao, LIANG Jianxia, HUANG Hua, XING Qianguo. Retrieval of non-optically active water quality parameters by hyperspectra for river network waters in the Pearl River estuary [J]. Journal of Tropical Oceanography, 2021, 40(1): 58-64. |
| [9] | SU Xinying, ZHONG Yu, LI Yao, TAN Meiting, HUANG Yadong, LIU Shan, XU Xiangrong, SONG Xingyu. Distribution characteristics and influencing factors of phytoplankton in waters around typical islands in the Pearl River Estuary* [J]. Journal of Tropical Oceanography, 2020, 39(5): 30-42. |
| [10] | YANG Bifeng, XIONG Cheng, CAO Jinghe, SUN Jinlong, WAN Kuiyuan, XIA Shaohong. Constrains of sliding wave phases on the low-velocity layer in the Pearl River Estuary [J]. Journal of Tropical Oceanography, 2020, 39(1): 106-119. |
| [11] | Suying OU. Surface suspended sediment distribution of Pearl River estuary under tropical storms with different wind and river discharge forcing [J]. Journal of Tropical Oceanography, 2019, 38(3): 22-31. |
| [12] | Weikang ZHAN,Jie WU,Xing WEI,Shilin TANG,Haigang ZHAN. Quantile trend analysis for suspended sediment concentration in the Pearl River Estuary based on remote sensing [J]. Journal of Tropical Oceanography, 2019, 38(3): 32-42. |
| [13] | Chuang XU,Yongji XU,Jiatang HU,Shiyu LI,Jintao LIU. Study on the seasonal and interannual variability of river plume in the Pearl River Estuary based on a high-resolution ocean dynamic model [J]. Journal of Tropical Oceanography, 2019, 38(3): 43-52. |
| [14] | Wenxi CAO, Zhaohua SUN, Cai LI, Guowang ZOU. Design and application of data collecting system and data receiving system for water quality monitoring buoy [J]. Journal of Tropical Oceanography, 2018, 37(5): 1-6. |
| [15] | Wenxi CAO, Zhaohua SUN, Cai LI, Guowang ZOU. Biofouling protection for water quality monitoring buoy and sensors [J]. Journal of Tropical Oceanography, 2018, 37(5): 7-12. |
|
||