
Journal of Tropical Oceanography ›› 2024, Vol. 43 ›› Issue (4): 57-67.doi: 10.11978/2023096CSTR: 32234.14.2023096
• Marine Hydrology • Previous Articles Next Articles
Ocean stratification in the Indonesian-Australian basin and its influencing factors
LIN Guihuan1,2( ), YAN Youfang1(), LIU Ying1,2
- 1. State Key Laboratory of Tropical Marine Environment, South China Sea Institute of Oceanology, Chinese Academy of Sciences, Guangzhou 510301, China
2. University of Chinese Academy of Sciences, Beijing 100049, China
-
Received:2023-07-12Revised:2023-08-15Online:2024-07-10Published:2024-07-22 -
Supported by:Special Project on Strategic Pioneering Science and Technology of Chinese Academy of Sciences(XDB42010000); National Natural Science Foundation of China(42276023); Coupled Initialization of Earth System Model of Chinese Academy of Sciences(ZDBS-LY-DQC010)
Cite this article
LIN Guihuan, YAN Youfang, LIU Ying. Ocean stratification in the Indonesian-Australian basin and its influencing factors[J].Journal of Tropical Oceanography, 2024, 43(4): 57-67.
share this article
Add to citation manager EndNote|Reference Manager|ProCite|BibTeX|RefWorks
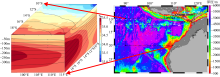
Fig. 1
Location of the Indonesian-Australian Basin in the southeast Indian Ocean (black box on the right panel), distribution of temperature (contours on the left panel) and salinity (filled color on the left panel) within the basin, and location of the three main outflow straits (Lombok Strait, Ombai Strait, and Timor Strait) of the Indonesia Throughflow (ITF) (solid black line on the right panel), and paths of outflow of the water (vector arrows)"

Fig. 1
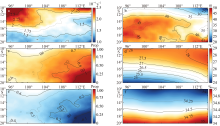
Fig. 2
The left panel shows the buoyancy frequency (a), and the proportion (Prop) of the contribution of its temperature (c) and salinity (e) components at the bottom of pycnocline in the climatology; the right panel shows the IAB mixed layer depth (b), mixed layer temperature (d) and mixed layer salinity (f) in the climatology"

Fig. 2
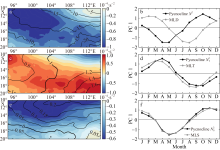
Fig. 3
The left panel shows the seasonal climate state of the buoyancy frequency (a, filled color), and its temperature component (c, filled color) and salinity component (e, filled color) at the bottom of the pycnocline, as well as the seasonal climatology of the mixed layer depth (a, contours), and mixed layer temperature (c, contours) and mixed layer salinity (e, contours), spatial modes of seasonal variation obtained by EOF analysis; the right panel shows the first principal temporal component of the variables of interest, with the explained variance, respectively: N 2(84%), N T 2 (78%), N S 2 (82%), MLD(89%), MLT(95%), MLS(58%)"

Fig. 3

Fig. 4
Variation in temperature and salinity obtained by volume averaging over the basin area at 300 m depth (black line), and sea surface fluxes (red line) and advective processes (blue line) affecting temperature (a) and salinity (b) within the basin, with the gray dashed line being the sum of the two; (b) and (d) are the advective contributions of temperature and salinity at the four boundaries, respectively, and the error bars are the seasonal standard deviations of each component"
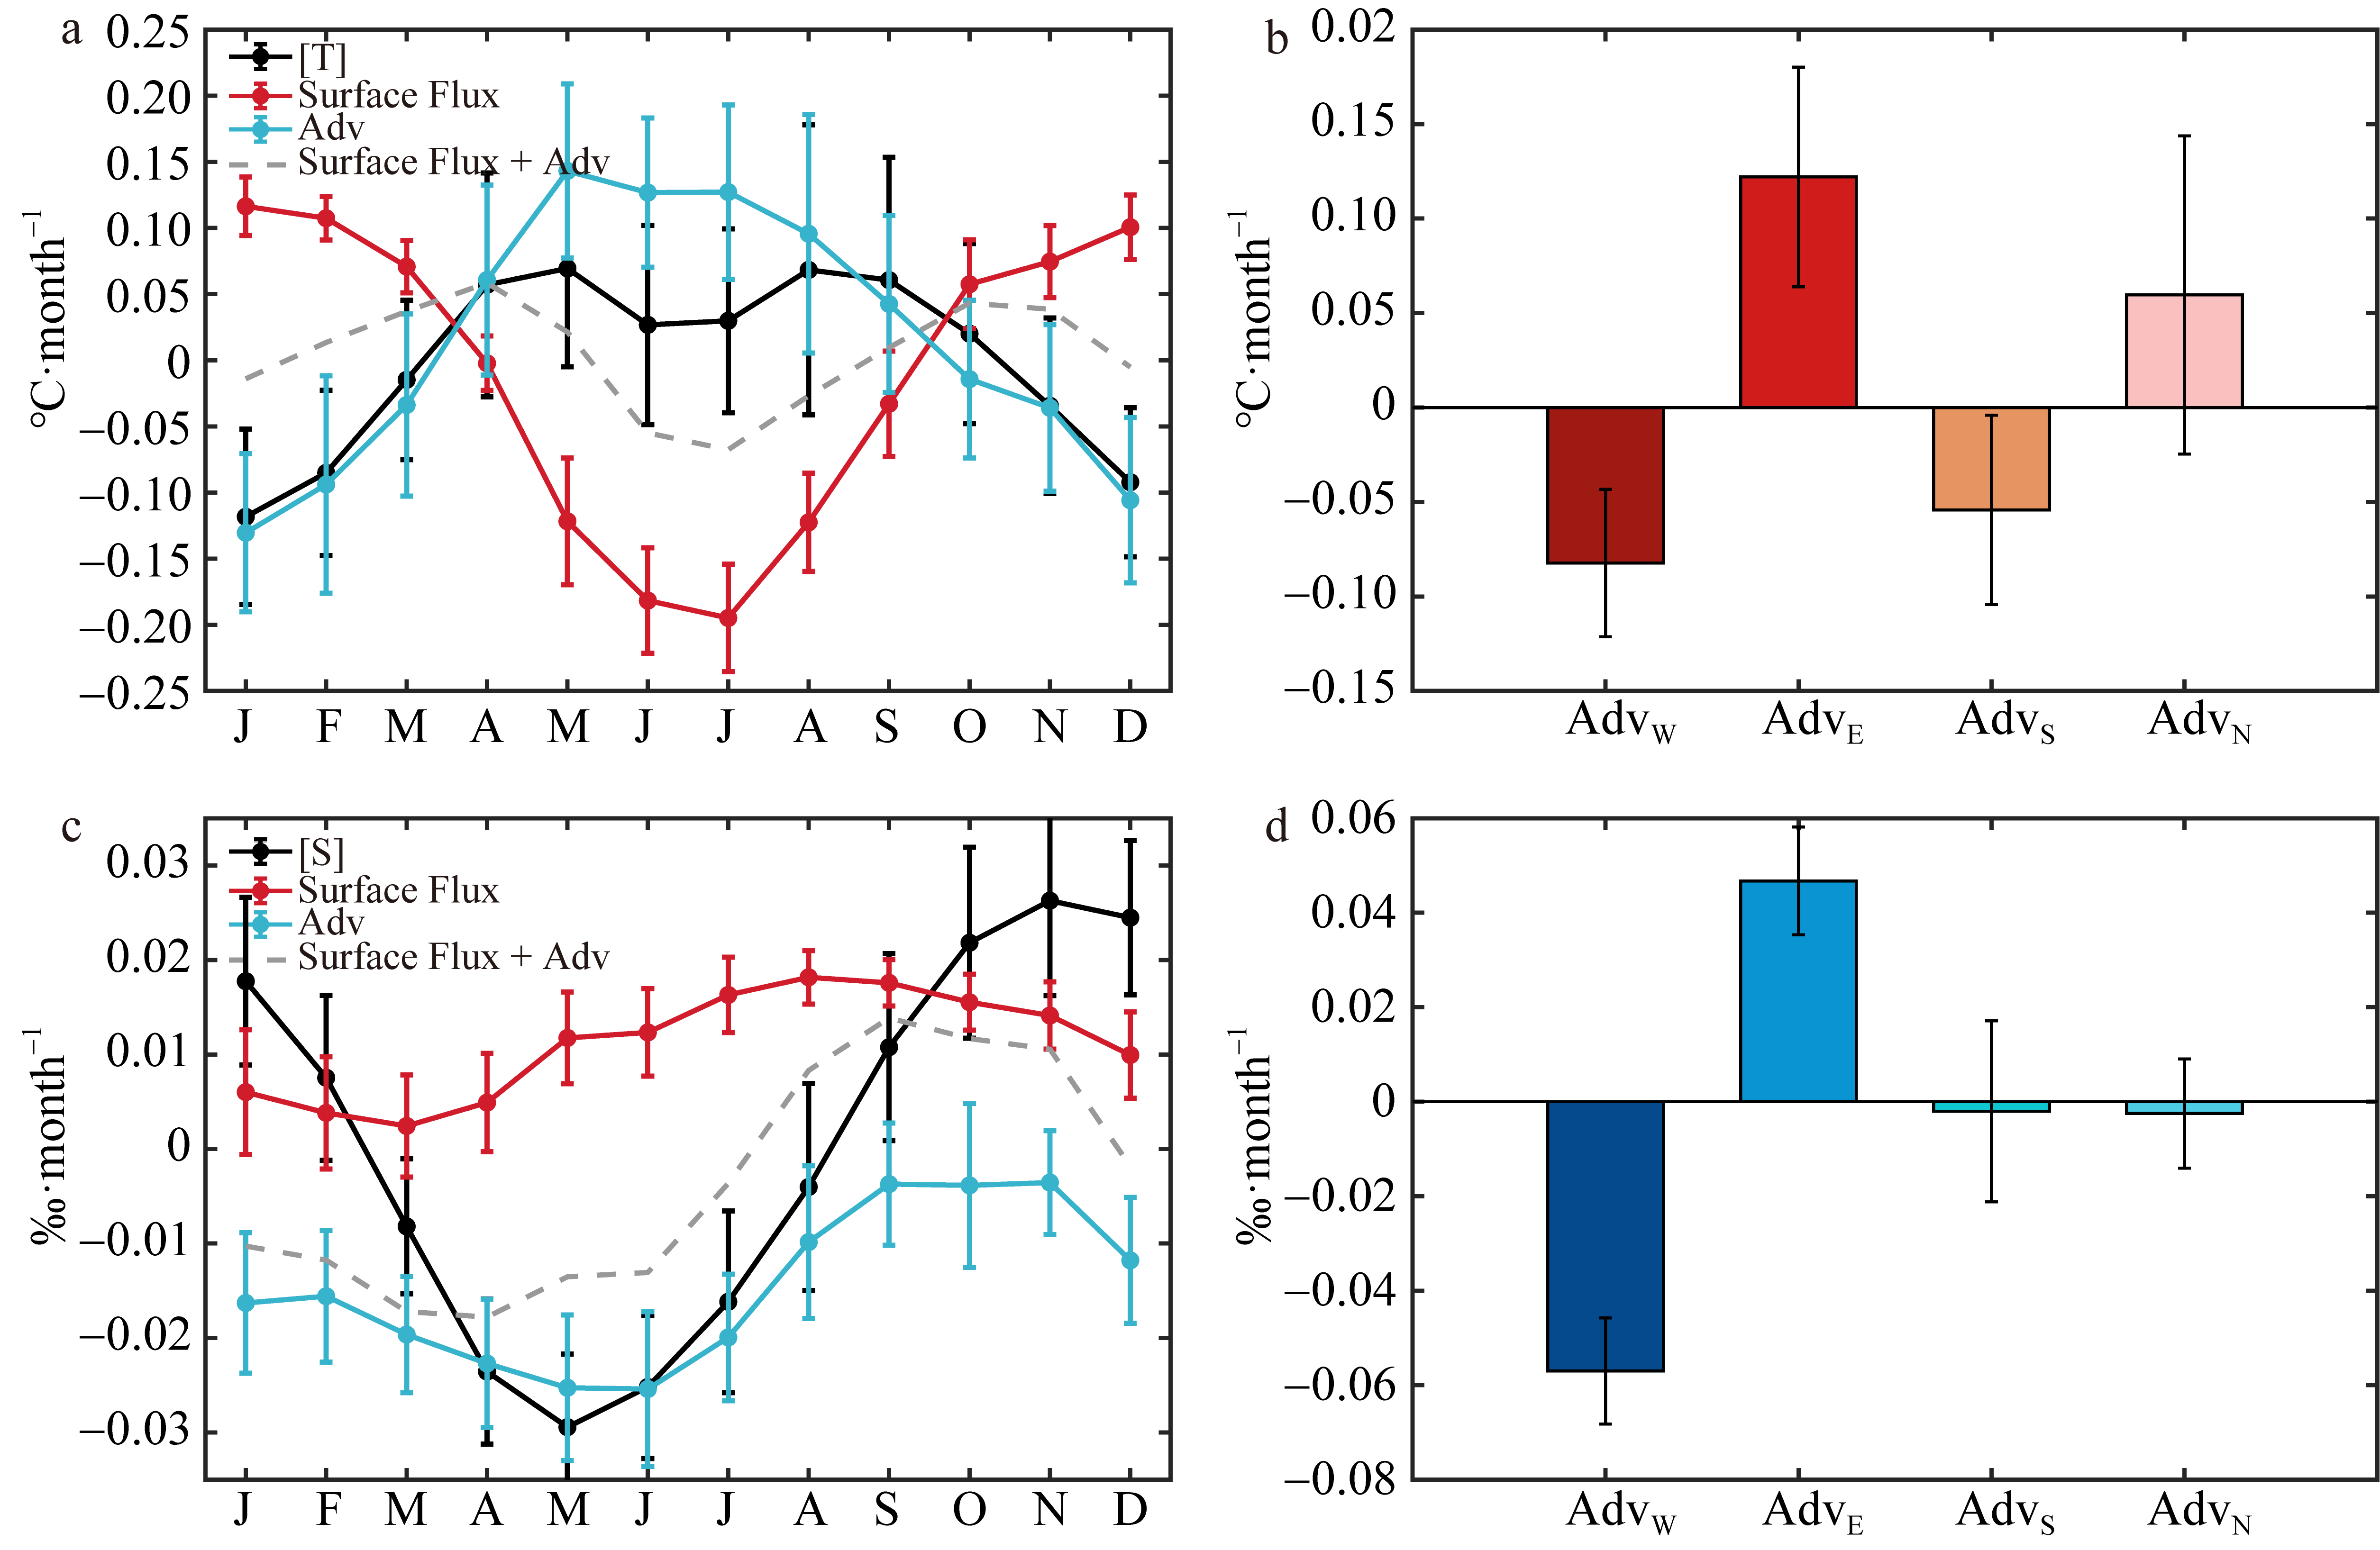
Fig. 4
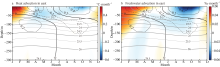
Fig. 5
Seasonal variation of advection—induced temperature anomalies (a) and salinity anomalies (b) at the eastern boundary of the basin (filled part). The solid gray line is the seasonal variation of the mean vertical potential density profile in the basin, and the solid black line represents positive potential density anomalies in the basin and the dashed black line represents negative potential density anomalies in the basin"

Fig. 5
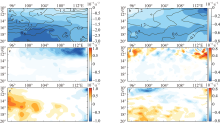
Fig. 6
In the climatological boreal summer, the distribution of buoyancy frequency anomalies due to mixed layer temperature anomalies (a, filled color) and mixed layer salinity anomalies (b, filled color) induced by sea surface fluxes, and the distribution of temperature buoyancy frequency (a, contours) and salinity buoyancy frequency (b, contours) in climatology. Similarly, (c) and (d) are the temperature and salinity anomalies induced by zonal advection respectively, while (e) and (f) are buoyancy frequency anomalies induced by meridional advection, respectively"

Fig. 6
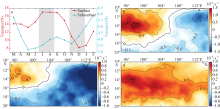
Fig. 7
The seasonal variation of the transport of the Indonesian Throughflow in the three main straits (a), (b) is the buoyancy frequency anomaly obtained by the buoyancy frequency from the period of the strong surface transport (red lines in the two shaded parts of the a figure: JAS—NDJ) at the bottom of pycnocline, and the horizontal distribution of the buoyancy frequency component due to the vertical gradient of temperature (c) and salinity(d), which are associated with the variation of the transport of Indonesian Throughflow (d)"

Fig. 7
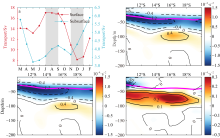
Fig. 8
The seasonal variation of the transport of the Indonesian Throughflow in the three main straits (a), (b) is the buoyancy frequency anomaly zonal profile obtained by the buoyancy frequency from the period of the strong surface transport(red lines in the two shaded parts of the a figure: JAS—NDJ) at the bottom of the mixed layer, and the vertical distribution of the buoyancy frequency component due to the vertical gradient of temperature (c) and salinity (d), which are associated with the variation of the transport of Indonesian Throughflow (d)"

Fig. 8
Fig. 9
In the climatology, the horizontal (a, c) and vertical (b, d) distributions of the correlation coefficients between the surface (a, b) and subsurface (c, d) transport of Indonesian Throughflow in the straits (ahead 3 months) and the buoyancy frequency at the bottom of pycnocline in the IAB; as well as lead\lag correlation coefficient between the buoyancy frequency averaged over the IAB and the transport of Indonesian Throughflow (f), and the linear coefficients (e) that regress the surface (red) and subsurface transport (blue) of the straits transport to the buoyancy frequency at bottom of pycnocline. Marks represent the sea area of correlation coefficients above the 95% confidence level"
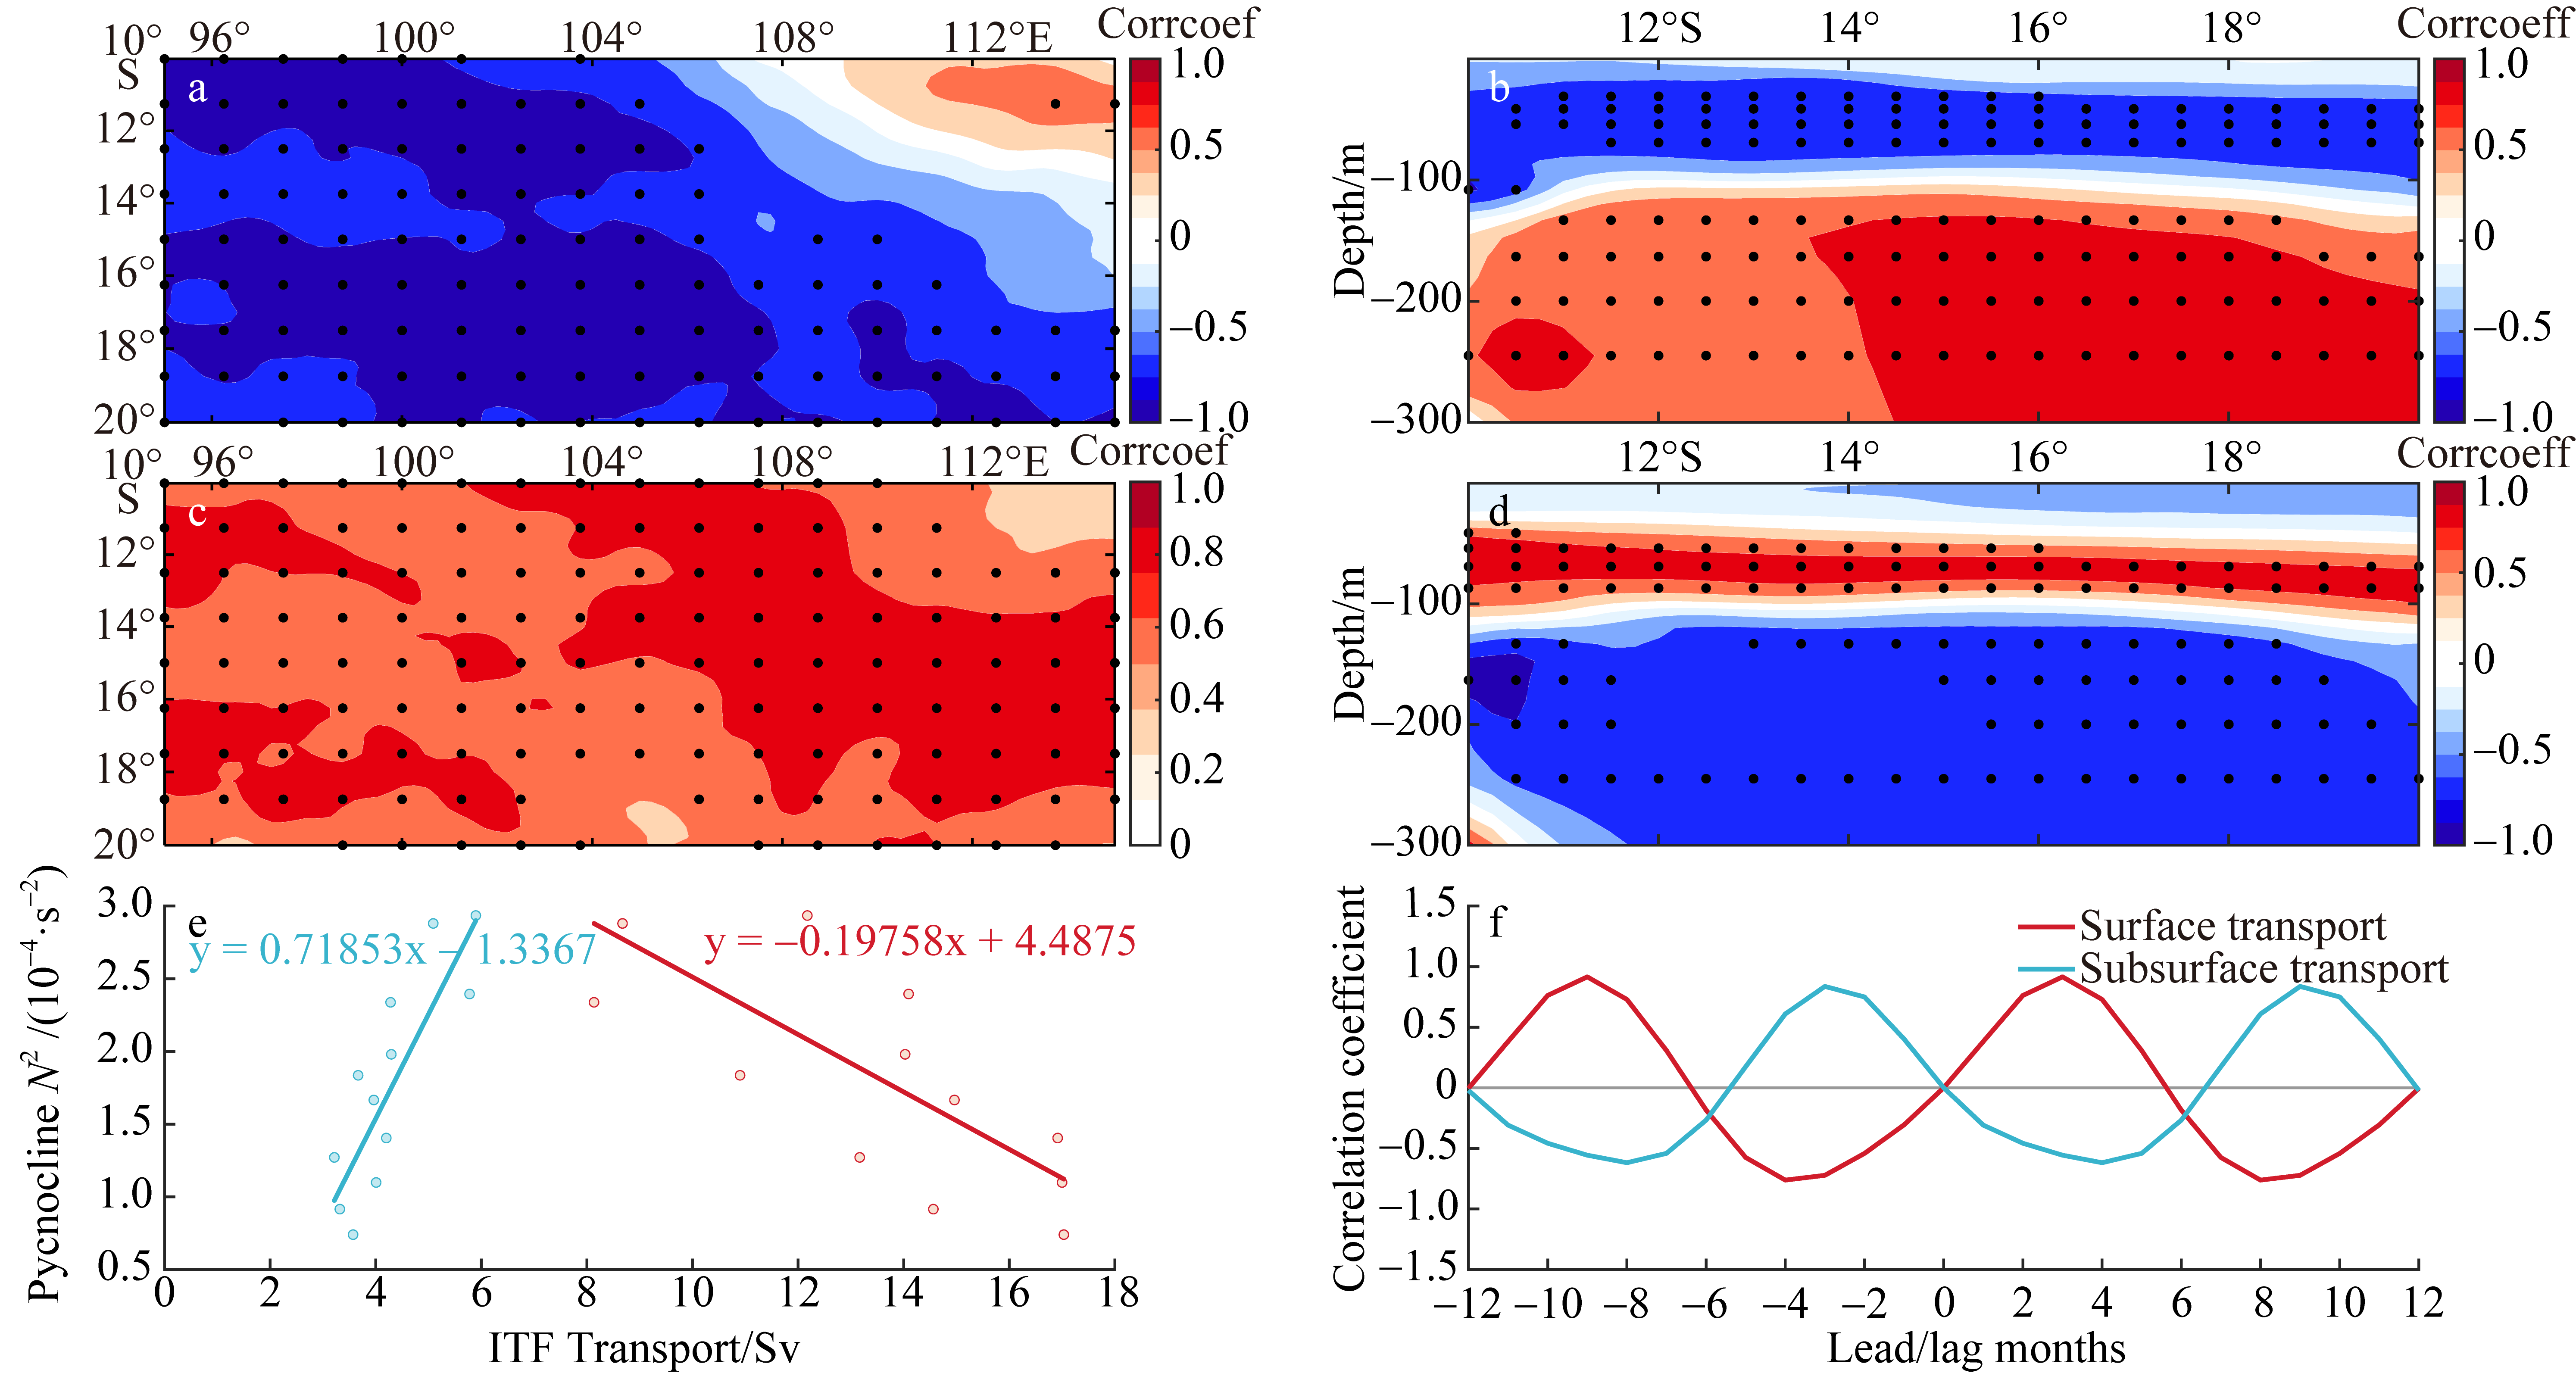
Fig. 9
| [1] |
|
| [2] |
|
| [3] |
|
| [4] |
|
| [5] |
|
| [6] |
|
| [7] |
doi: 10.1038/srep16050 pmid: 26522168 |
| [8] |
|
| [9] |
|
| [10] |
|
| [11] |
|
| [12] |
|
| [13] |
|
| [14] |
|
| [15] |
|
| [16] |
|
| [17] |
doi: 10.1002/2016GL072494 pmid: 28405053 |
| [18] |
|
| [19] |
|
| [20] |
|
| [21] |
|
| [22] |
|
| [23] |
|
| [24] |
doi: 10.1038/s41467-019-10109-z pmid: 31068581 |
| [25] |
|
| [26] |
|
| [27] |
|
| [28] |
|
| [29] |
|
| [30] |
|
| [31] |
|
| [32] |
|
| [33] |
|
| [34] |
|
| [35] |
|
| [36] |
|
| [37] |
|
| [38] |
|
| [39] |
|
| [40] |
|
| [41] |
|
| [42] |
|
| [43] |
|
| [44] |
|
| [45] |
|
| [46] |
|
| [1] | SUN Zeming, HAN Shuzong, WANG Mingjie, SU Hanxiang. Statistical study on the influence of typhoon with different path on the temperature of coastal waters of China [J]. Journal of Tropical Oceanography, 2024, 43(5): 17-31. |
| [2] | QI Huandong, ZHU Cheng, LI Xuchun, JING Xindi, SONG Derui. Rule set and multilayer perceptron based quality control method for Argo temperature data* [J]. Journal of Tropical Oceanography, 2024, 43(5): 190-202. |
| [3] | MO Danyang, NING Zhiming, YANG Bin, XIA Ronglin, LIU Zhijin. Response of dissimilatory nitrate reduction processes in coral reef sediments of the Weizhou island to temperature changes [J]. Journal of Tropical Oceanography, 2024, 43(4): 137-143. |
| [4] | WENG Shaojia, CAI Jinhai, PANG Yunxi, LUO Rongzhen. Application of convolutional neural network to sea surface temperature prediction in the coastal waters [J]. Journal of Tropical Oceanography, 2024, 43(1): 40-47. |
| [5] | LIAO Kuo, LI Kailin, DANG Haofei, LIN Bin, ZHAO Dongzhi, LI Hui. Process and characteristics of occurrence and dissipation of sea fog in the west coast of the Taiwan Strait based on coastal automatic weather station* [J]. Journal of Tropical Oceanography, 2024, 43(1): 79-93. |
| [6] | SUN Wenjie, LI Jiamin, WANG Hualong, MI Tiezhu, ZHEN Yu. Transcriptomic analysis of fatty acid metabolism in the Thalassiosira pseudonana under low salinity stress [J]. Journal of Tropical Oceanography, 2023, 42(5): 92-103. |
| [7] | TANG Jiaoyu, WANG Weiqiang, XU Kang, ZHANG Zhenqiu. Interannual variability of subsurface high salinity water in eastern equatorial Indian Ocean* [J]. Journal of Tropical Oceanography, 2023, 42(1): 10-21. |
| [8] | LYU Hongke, GONG Yuanfa, WANG Guihua. A linear Markov model for the forecast of sea surface salinity in the Indian Ocean and its improvement method [J]. Journal of Tropical Oceanography, 2022, 41(6): 151-158. |
| [9] | TANG Chaoli, TAO Xinhua, WEI Yuanyuan, DAI Congming, WEI Heli. Spatiotemporal modal analysis and prediction of surface temperature in East Asia and the Western Pacific* [J]. Journal of Tropical Oceanography, 2022, 41(6): 183-192. |
| [10] | SHI Xiaohan, ZOU Dinghui, HE Quan, LI Gang. Photophysiological characteristics of the branch and stolon of macroalga Caulerpa lentillifera (Caulerpaceae, Caulerpa) under different growth light conditions, and their responses to temperature rise [J]. Journal of Tropical Oceanography, 2022, 41(5): 150-160. |
| [11] | LI Gang, WAN Mingyue, SHI Xiaohan, QIN Geng, MAI Guangming, HUANG Liangmin, TAN Yehui, ZOU Dinghui. Comparative study on photophysiology of four macroalgae from the Zhongsha Atoll, with special reference to the effects of temperature rise* [J]. Journal of Tropical Oceanography, 2022, 41(3): 101-110. |
| [12] | DONG Lanfang, XU Mingzhu, LIU Haijuan, ZENG Mengqing, CHEN Ruifang, LI Shicai. Effects of salinity on growth, molting, Na+-K+-ATP enzyme activities, immune index, and antioxidantion of juvenile Chinese horseshoe crab, Tachypleus tridentatus [J]. Journal of Tropical Oceanography, 2022, 41(3): 156-163. |
| [13] | LIAO Ying, XIA Xiaomin. Effects of salinity on the growth and transcriptome of euryhaline Synechococcus sp. K1* [J]. Journal of Tropical Oceanography, 2022, 41(2): 159-169. |
| [14] | CHEN Kehai, XIE Xuetong, ZHANG Jinlan, ZHENG Yan. An SST dependent geophysical model function for HY-2A scatterometer [J]. Journal of Tropical Oceanography, 2022, 41(2): 90-102. |
| [15] | NIE Wangchen, WANG Xidong, CHEN Zhiqiang, HE Zikang, FAN Kaigui. Research and application of global three-dimensional thermohaline reconstruction technology based on neural network [J]. Journal of Tropical Oceanography, 2022, 41(2): 1-15. |
|
||