
Journal of Tropical Oceanography ›› 2026, Vol. 45 ›› Issue (2): 81-95.doi: 10.11978/2025074CSTR: 32234.14.2025074
Previous Articles Next Articles
A preliminary study on the regulatory and responsive relationship between upper and middle ocean heat content and typhoons in the northwestern Pacific based on GDCSM_Argo
SHU Bo1( ), ZHANG Chunling1,2,3(), SU Han1, HU Song1,2,3
- 1
College of Oceanography and Ecological Science ,Shanghai Ocean University
2Demonstration Center for Experimental Teaching of Marine Science and Technology ,Shanghai Ocean University
3Key Laboratory of Marine Ecological Monitoring and Restoration Technologies ,Ministry of Natural Resources
-
Received:2025-06-05Revised:2025-07-29Online:2026-03-10Published:2026-03-26 -
Contact:ZHANG Chunling. email: clzhang@shou.edu.cn -
Supported by:Float Special Outsourcing Project(D-8006-21-0082)
CLC Number:
- P732.31
Cite this article
SHU Bo, ZHANG Chunling, SU Han, HU Song. A preliminary study on the regulatory and responsive relationship between upper and middle ocean heat content and typhoons in the northwestern Pacific based on GDCSM_Argo[J].Journal of Tropical Oceanography, 2026, 45(2): 81-95.
share this article
Add to citation manager EndNote|Reference Manager|ProCite|BibTeX|RefWorks

Fig. 1
The distribution of average ocean heat content anomaly within the depth range of 0 to 2000 m in the Northwest Pacific from 2004 to 2023, corresponding to typhoon tracks (solid gray lines), typhoon generation locations (blue triangles), typhoon maximum wind speed locations (green triangles), and typhoon dissipation locations (red triangles)"
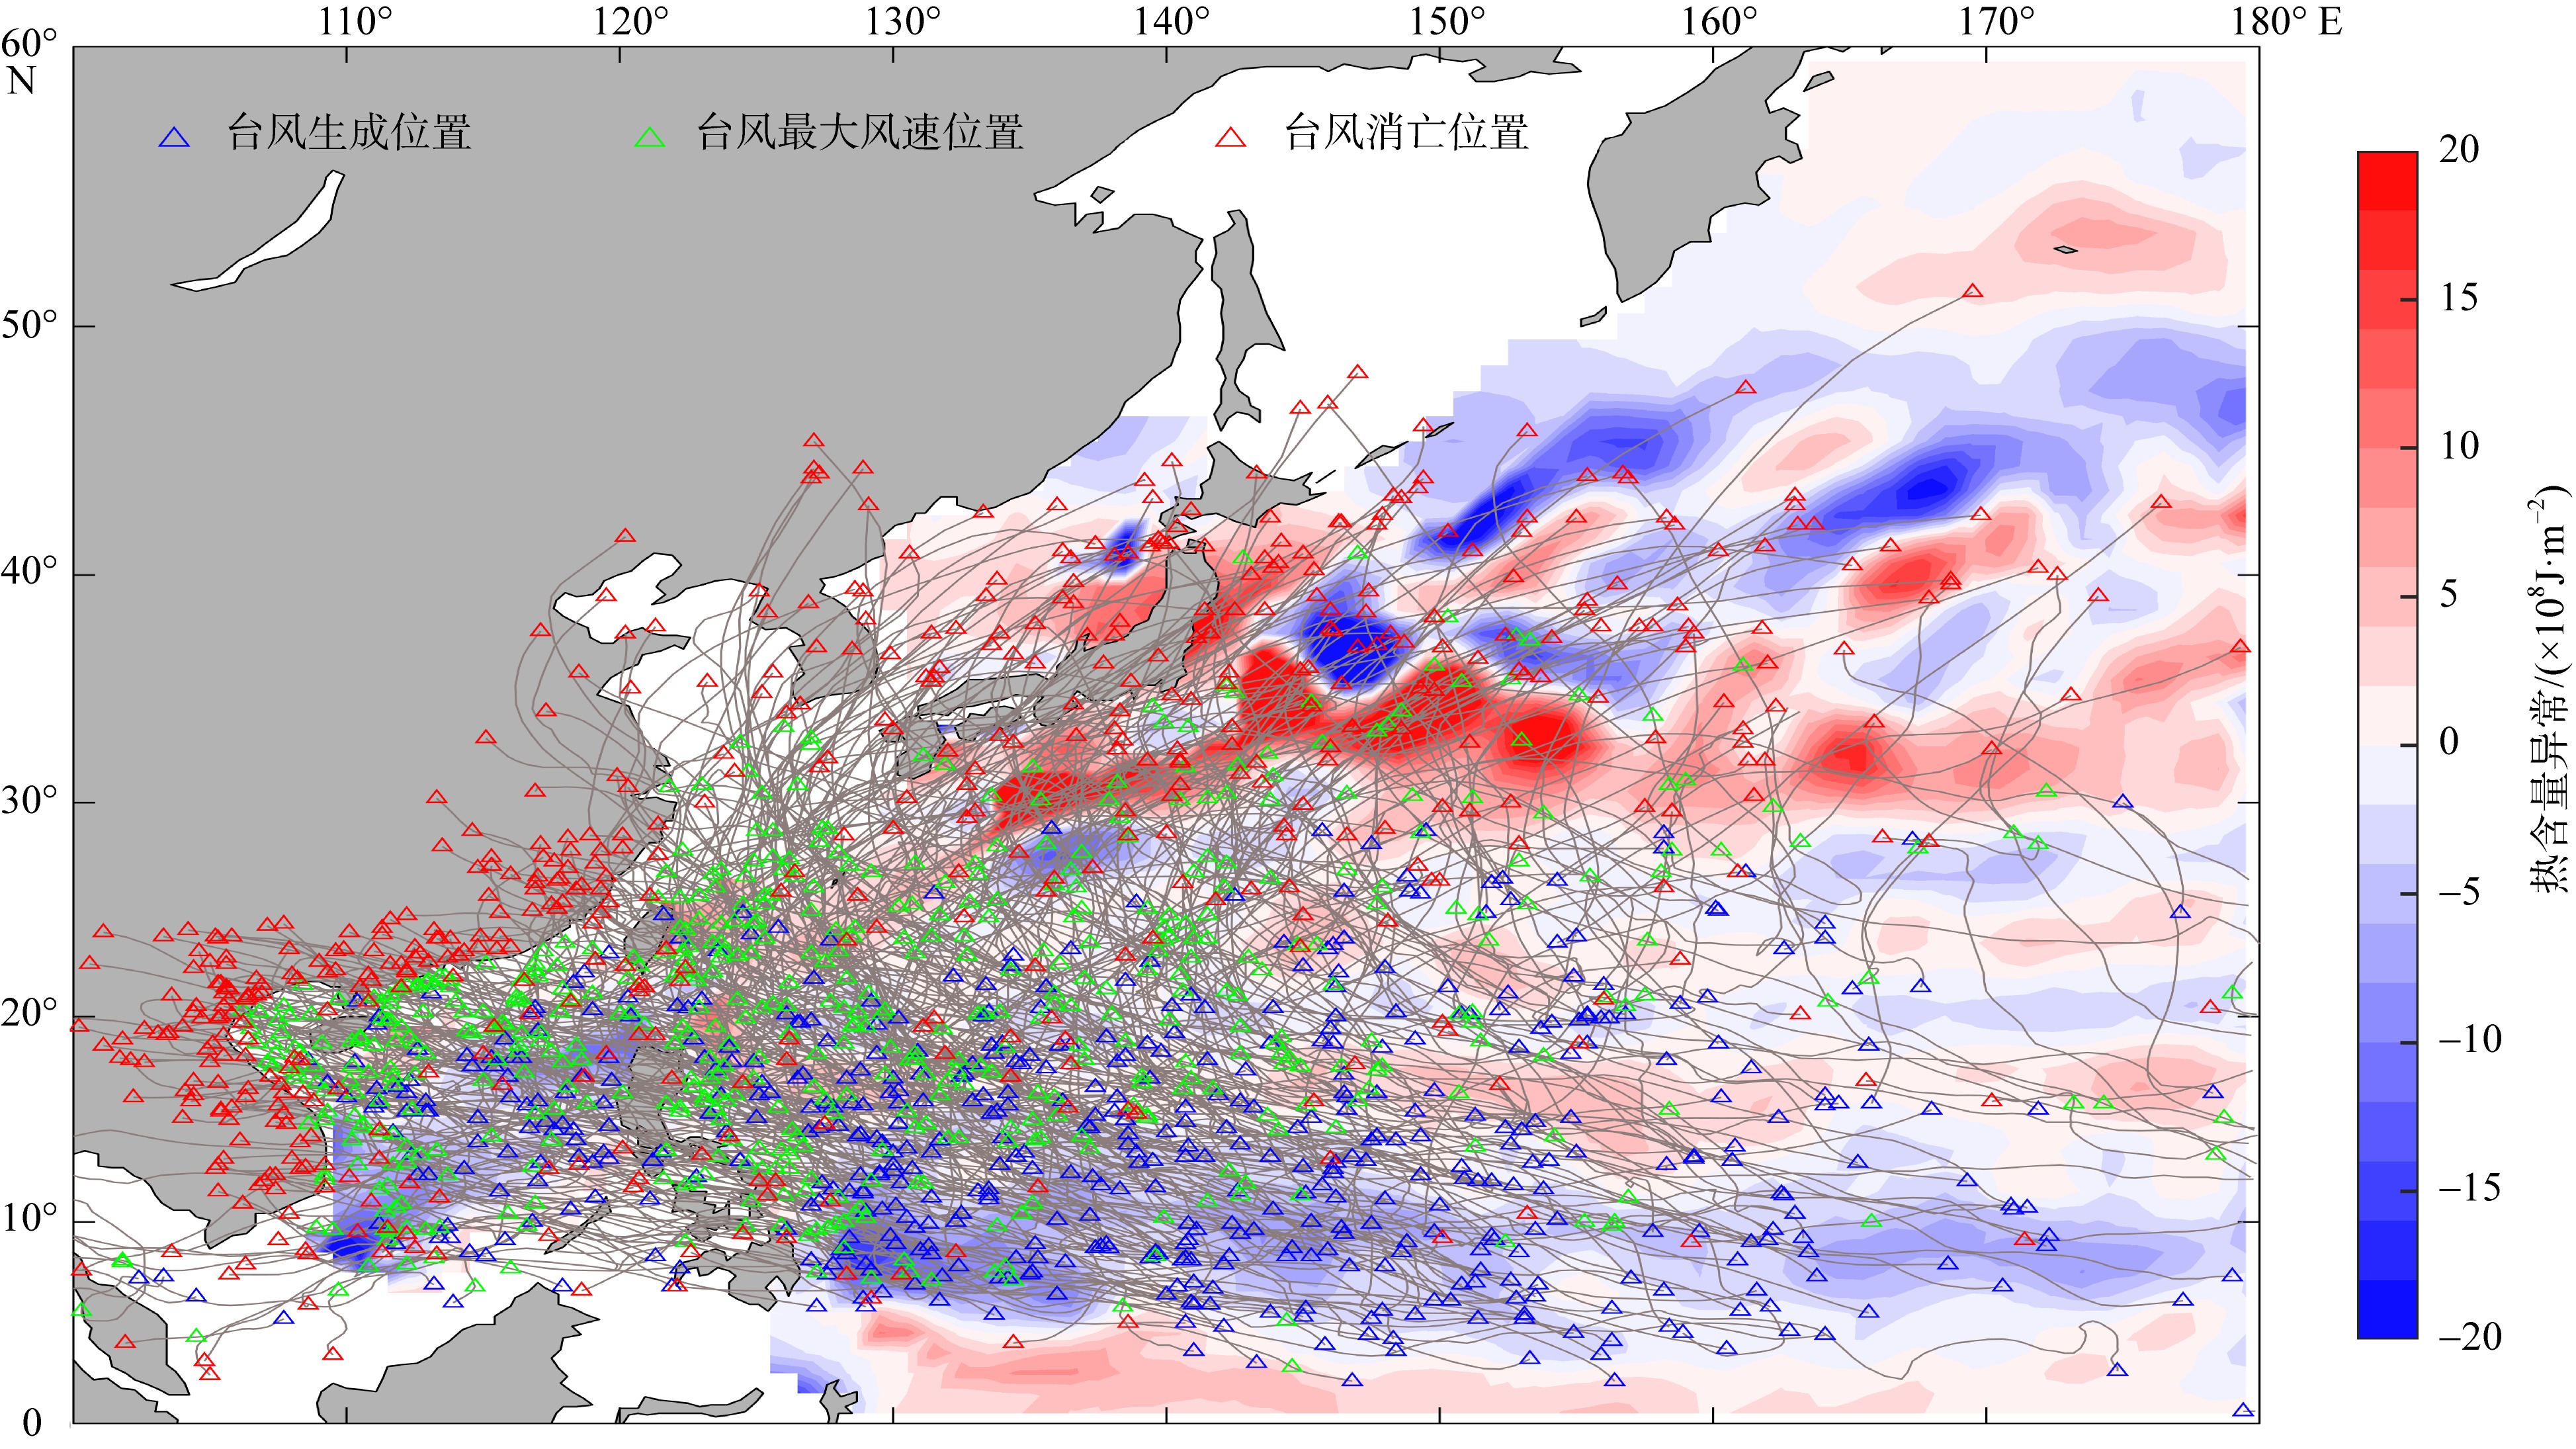
Fig. 1

Fig. 2
The frequency of typhoons in the Northwest Pacific from 2004 to 2023 (a) and the time series of ocean heat content anomaly in the middle and upper layers (b). The red, green, and blue boxes correspond to the time periods of 2005 to 2012, 2014 to 2016, and 2016 to 2020, respectively; The isopleths in Fig. 2b represent OHCA"
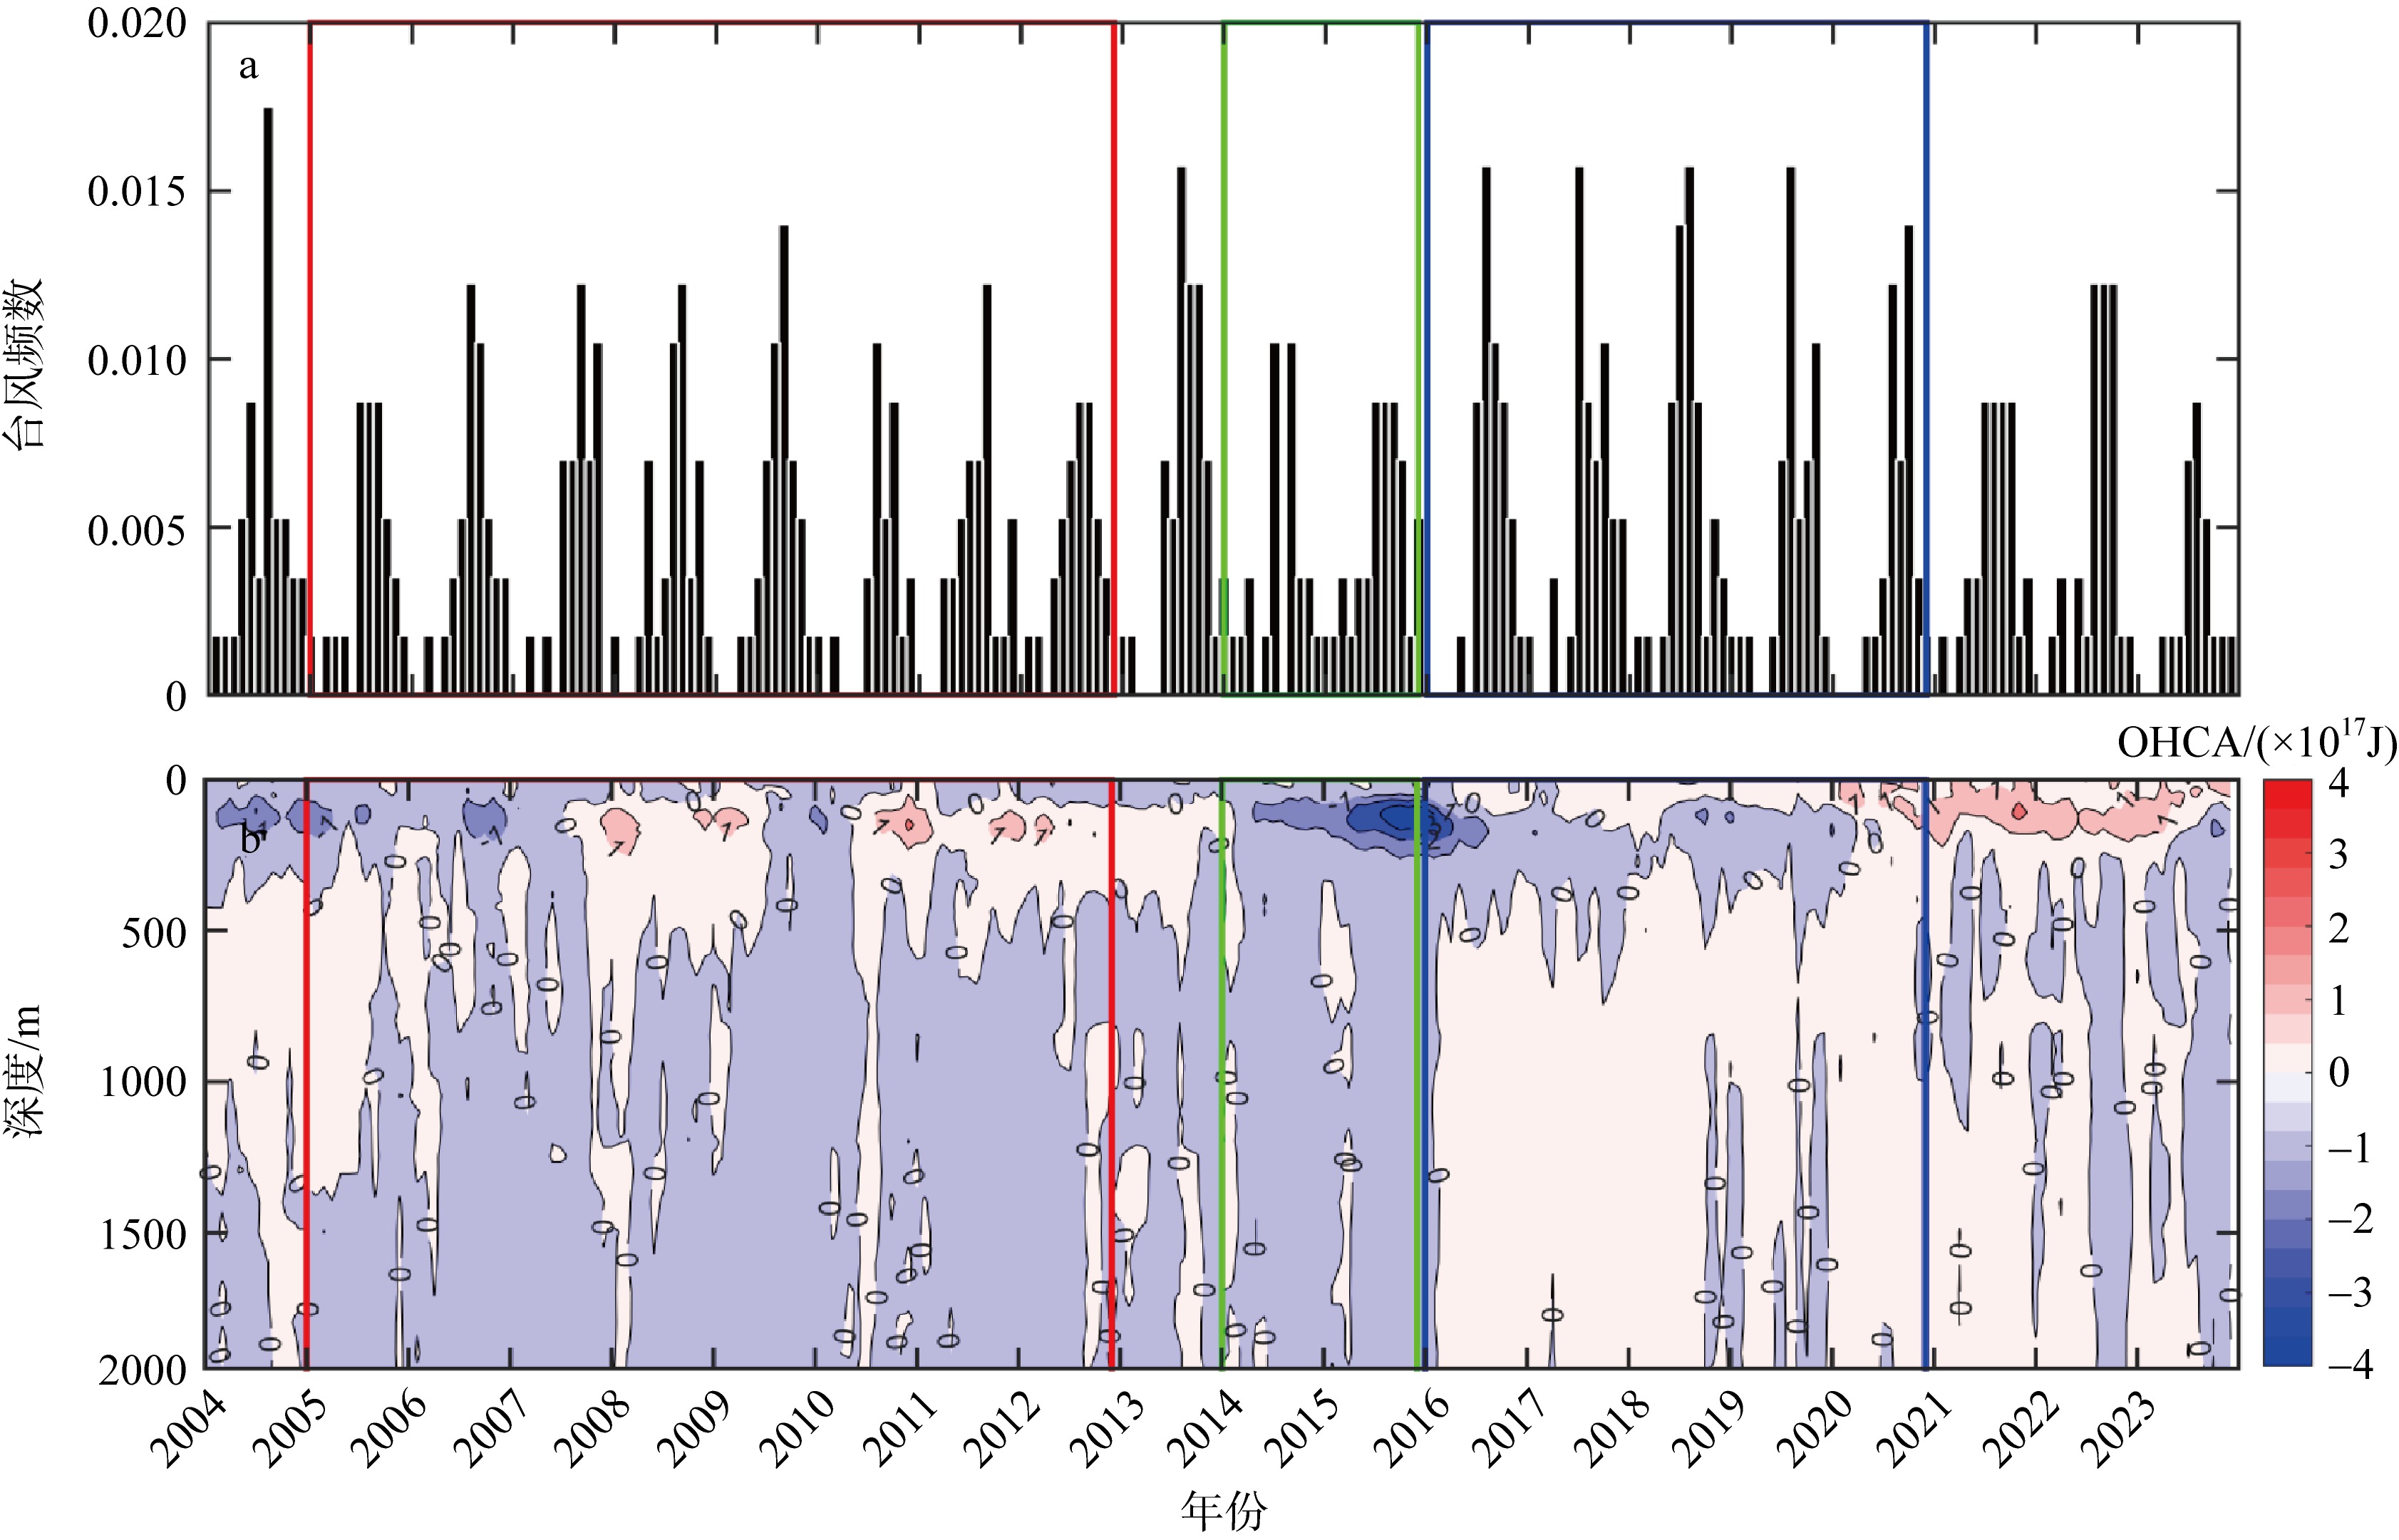
Fig. 2
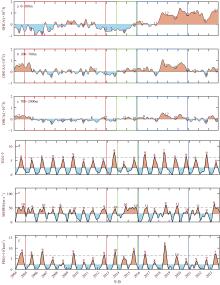
Fig. 3
The corresponding distributions of ocean heat content anomaly time series (a—c) and TGN (d), MMWS (e), and PDI (f) time series at different depths. The black solid line in (d—f) represents the average value of the corresponding parameter, and the black dashed line represents the annual average of extreme values. Red asterisks indicate the months within each year in which the OHCA reaches its minimum and the typhoon parameters reach their maximum. The red, green, and blue boxes correspond to the time periods of 2005 to 2012, 2014 to 2016, and 2016 to 2020, respectively"

Fig. 3
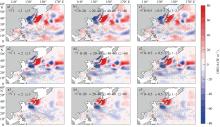
Fig. 4
Lagged spatial distribution of ocean heat uptake anomaly (OHUA) at different depths and corresponding typhoon parameters. (a1), (b1), and (c1) are the relative distributions of OHUA with a lag of one month compared to typhoon genesis number (TGN), mean maximum wind speed (MMWS), and power dissipation index (PDI) at 0 to 300 m, respectively; (a2), (b2), and (c2) are the relative distributions of OHUA with a lag of 3 months compared to TGN, MMWS, and PDI at 300 to 700 m, respectively; (a3), (b3), and (c3) are the relative distributions of thermal OHUA with a lag of 6 months compared to TGN, MMWS, and PDI at 700 to 2000 m, respectively"
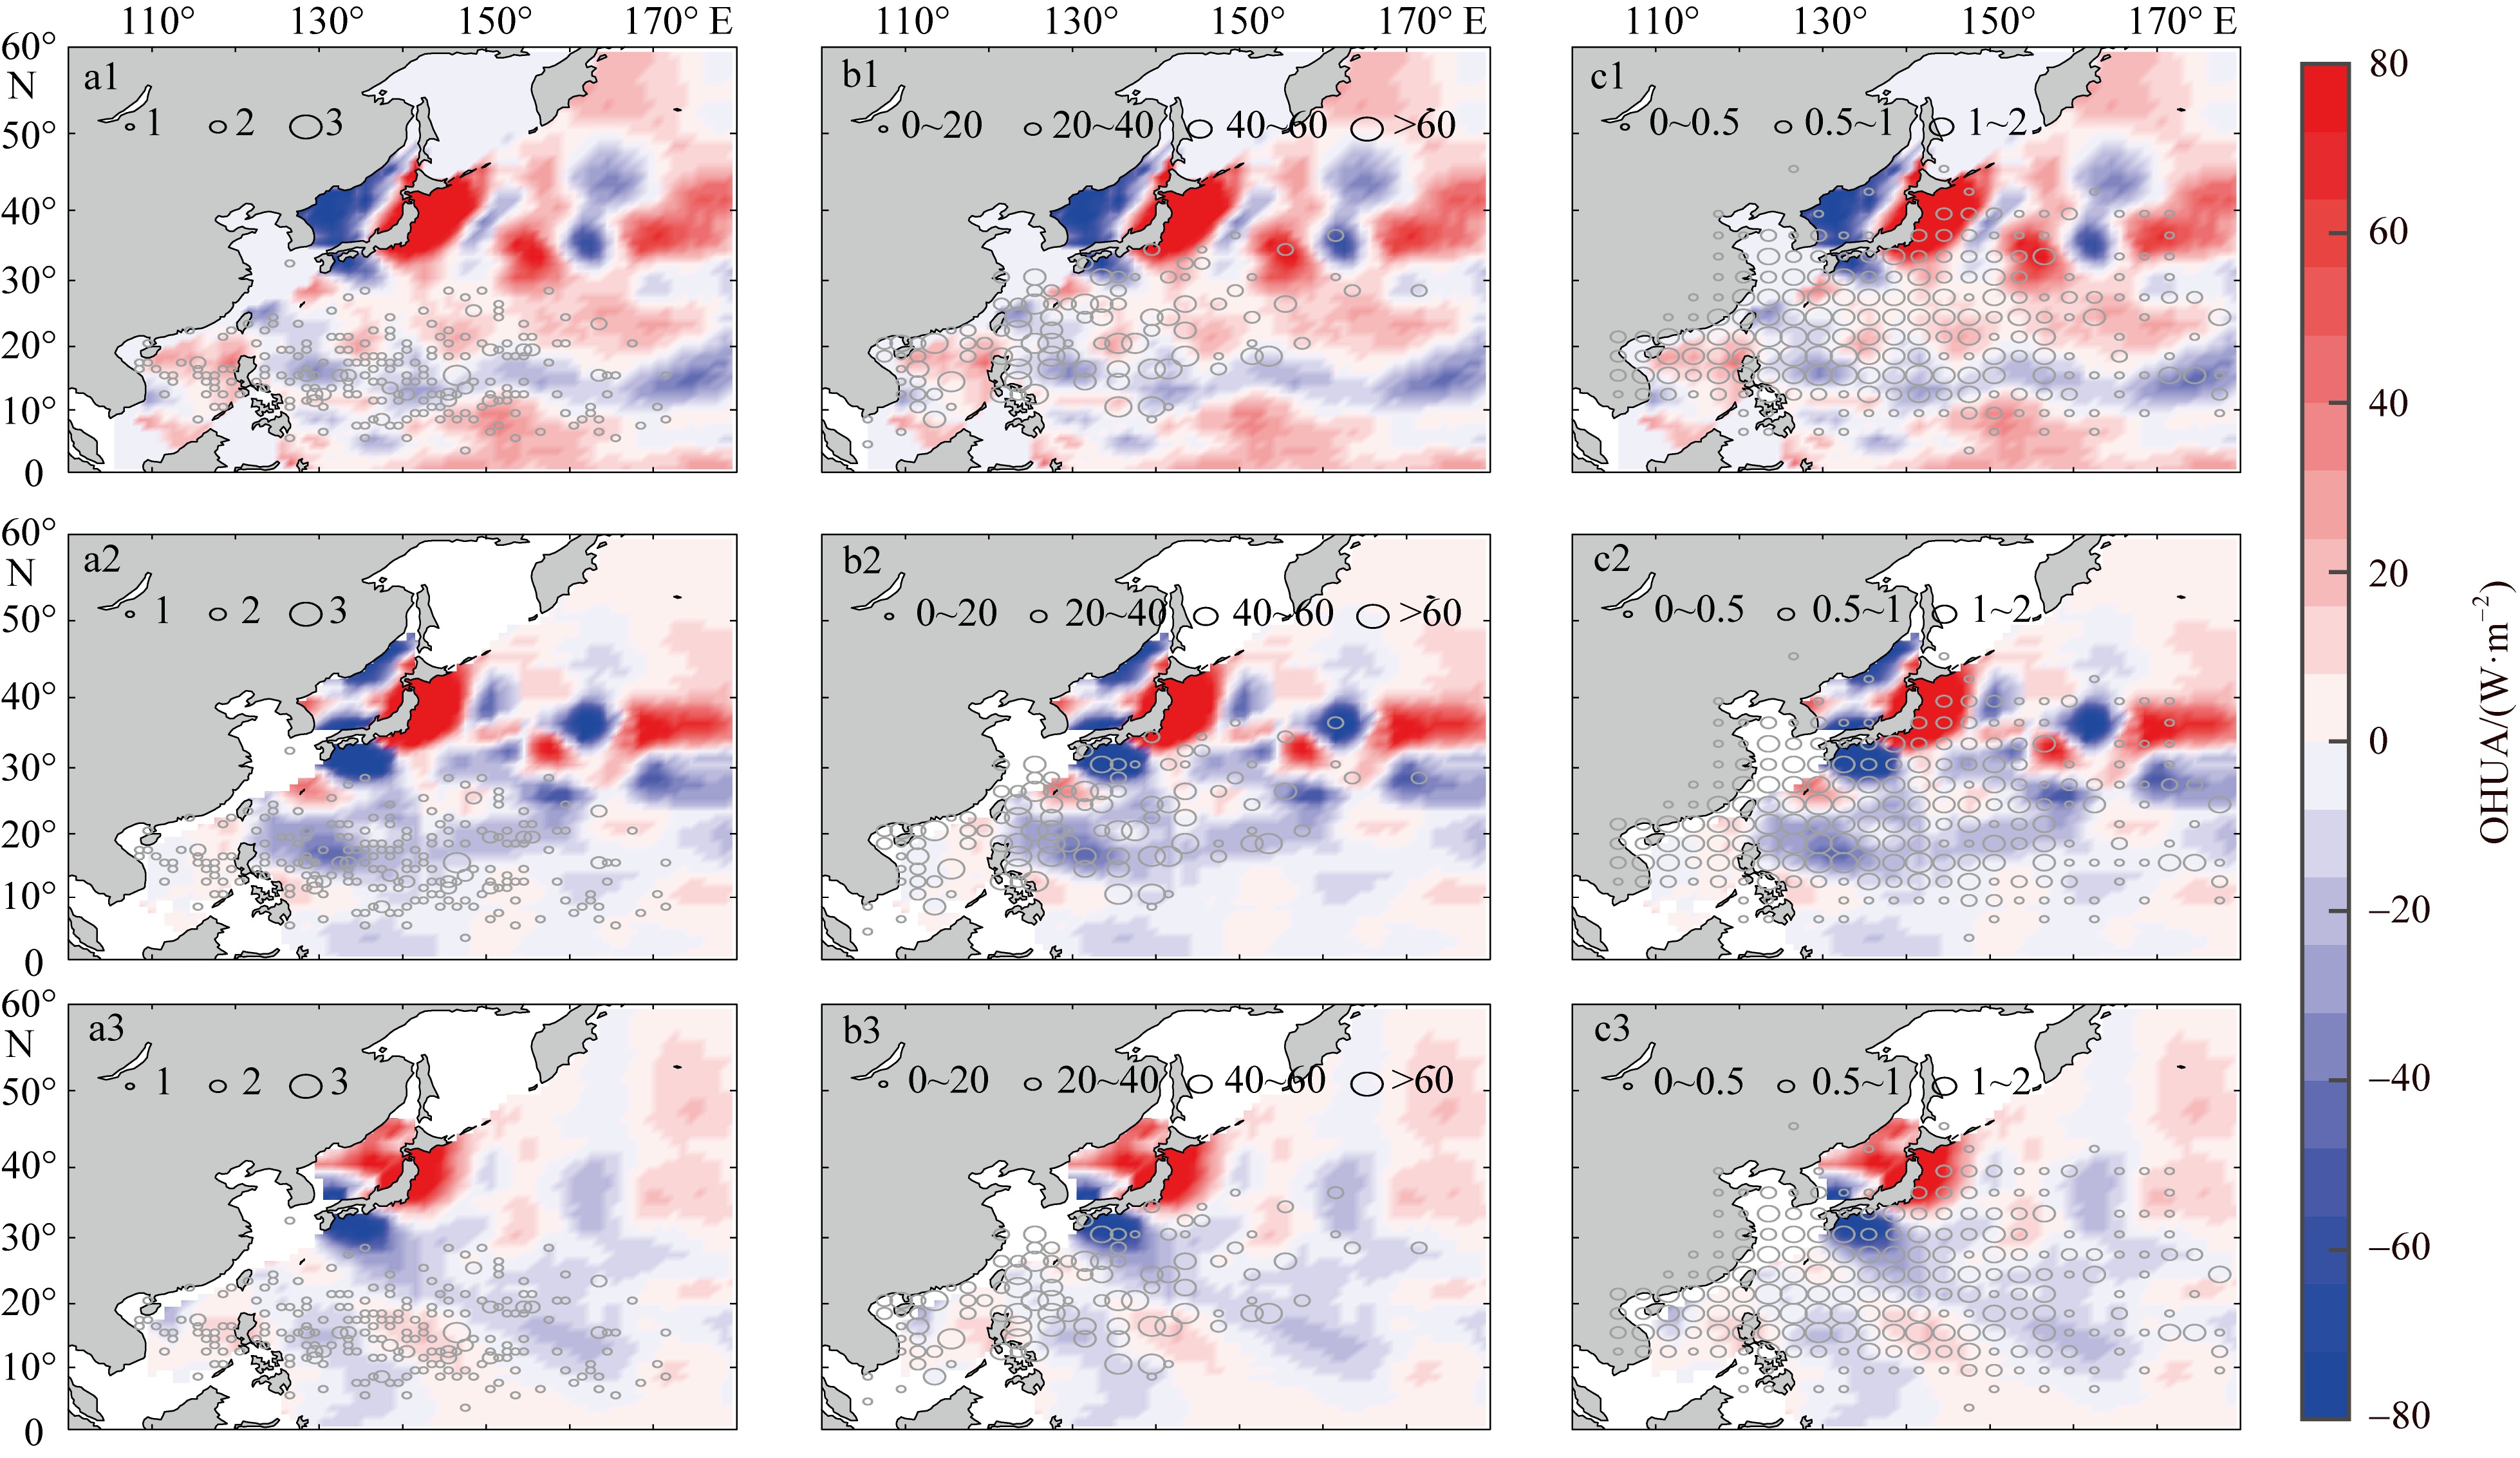
Fig. 4

Fig. 5
Distribution of lagged correlation coefficients between typhoon parameters and ocean heat uptake anomaly (OHUA) at different depths: a1, b1, c1: from the surface to the mixed layer depth, with typhoon parameters lagging OHUA by 1 month; a2, b2, c2: from the mixed layer to 300 m depth, with typhoon parameters lagging OHUA by 2 months; a3, b3, c3: at depths between 300 and 700 m, with typhoon parameters lagging OHUA by 3 months; a4, b4, c4: at depths between 700 and 2000 m, with typhoon parameters lagging OHUA by 6 months. The first column is TGN, the second column is MMWS and the third column is PDI"
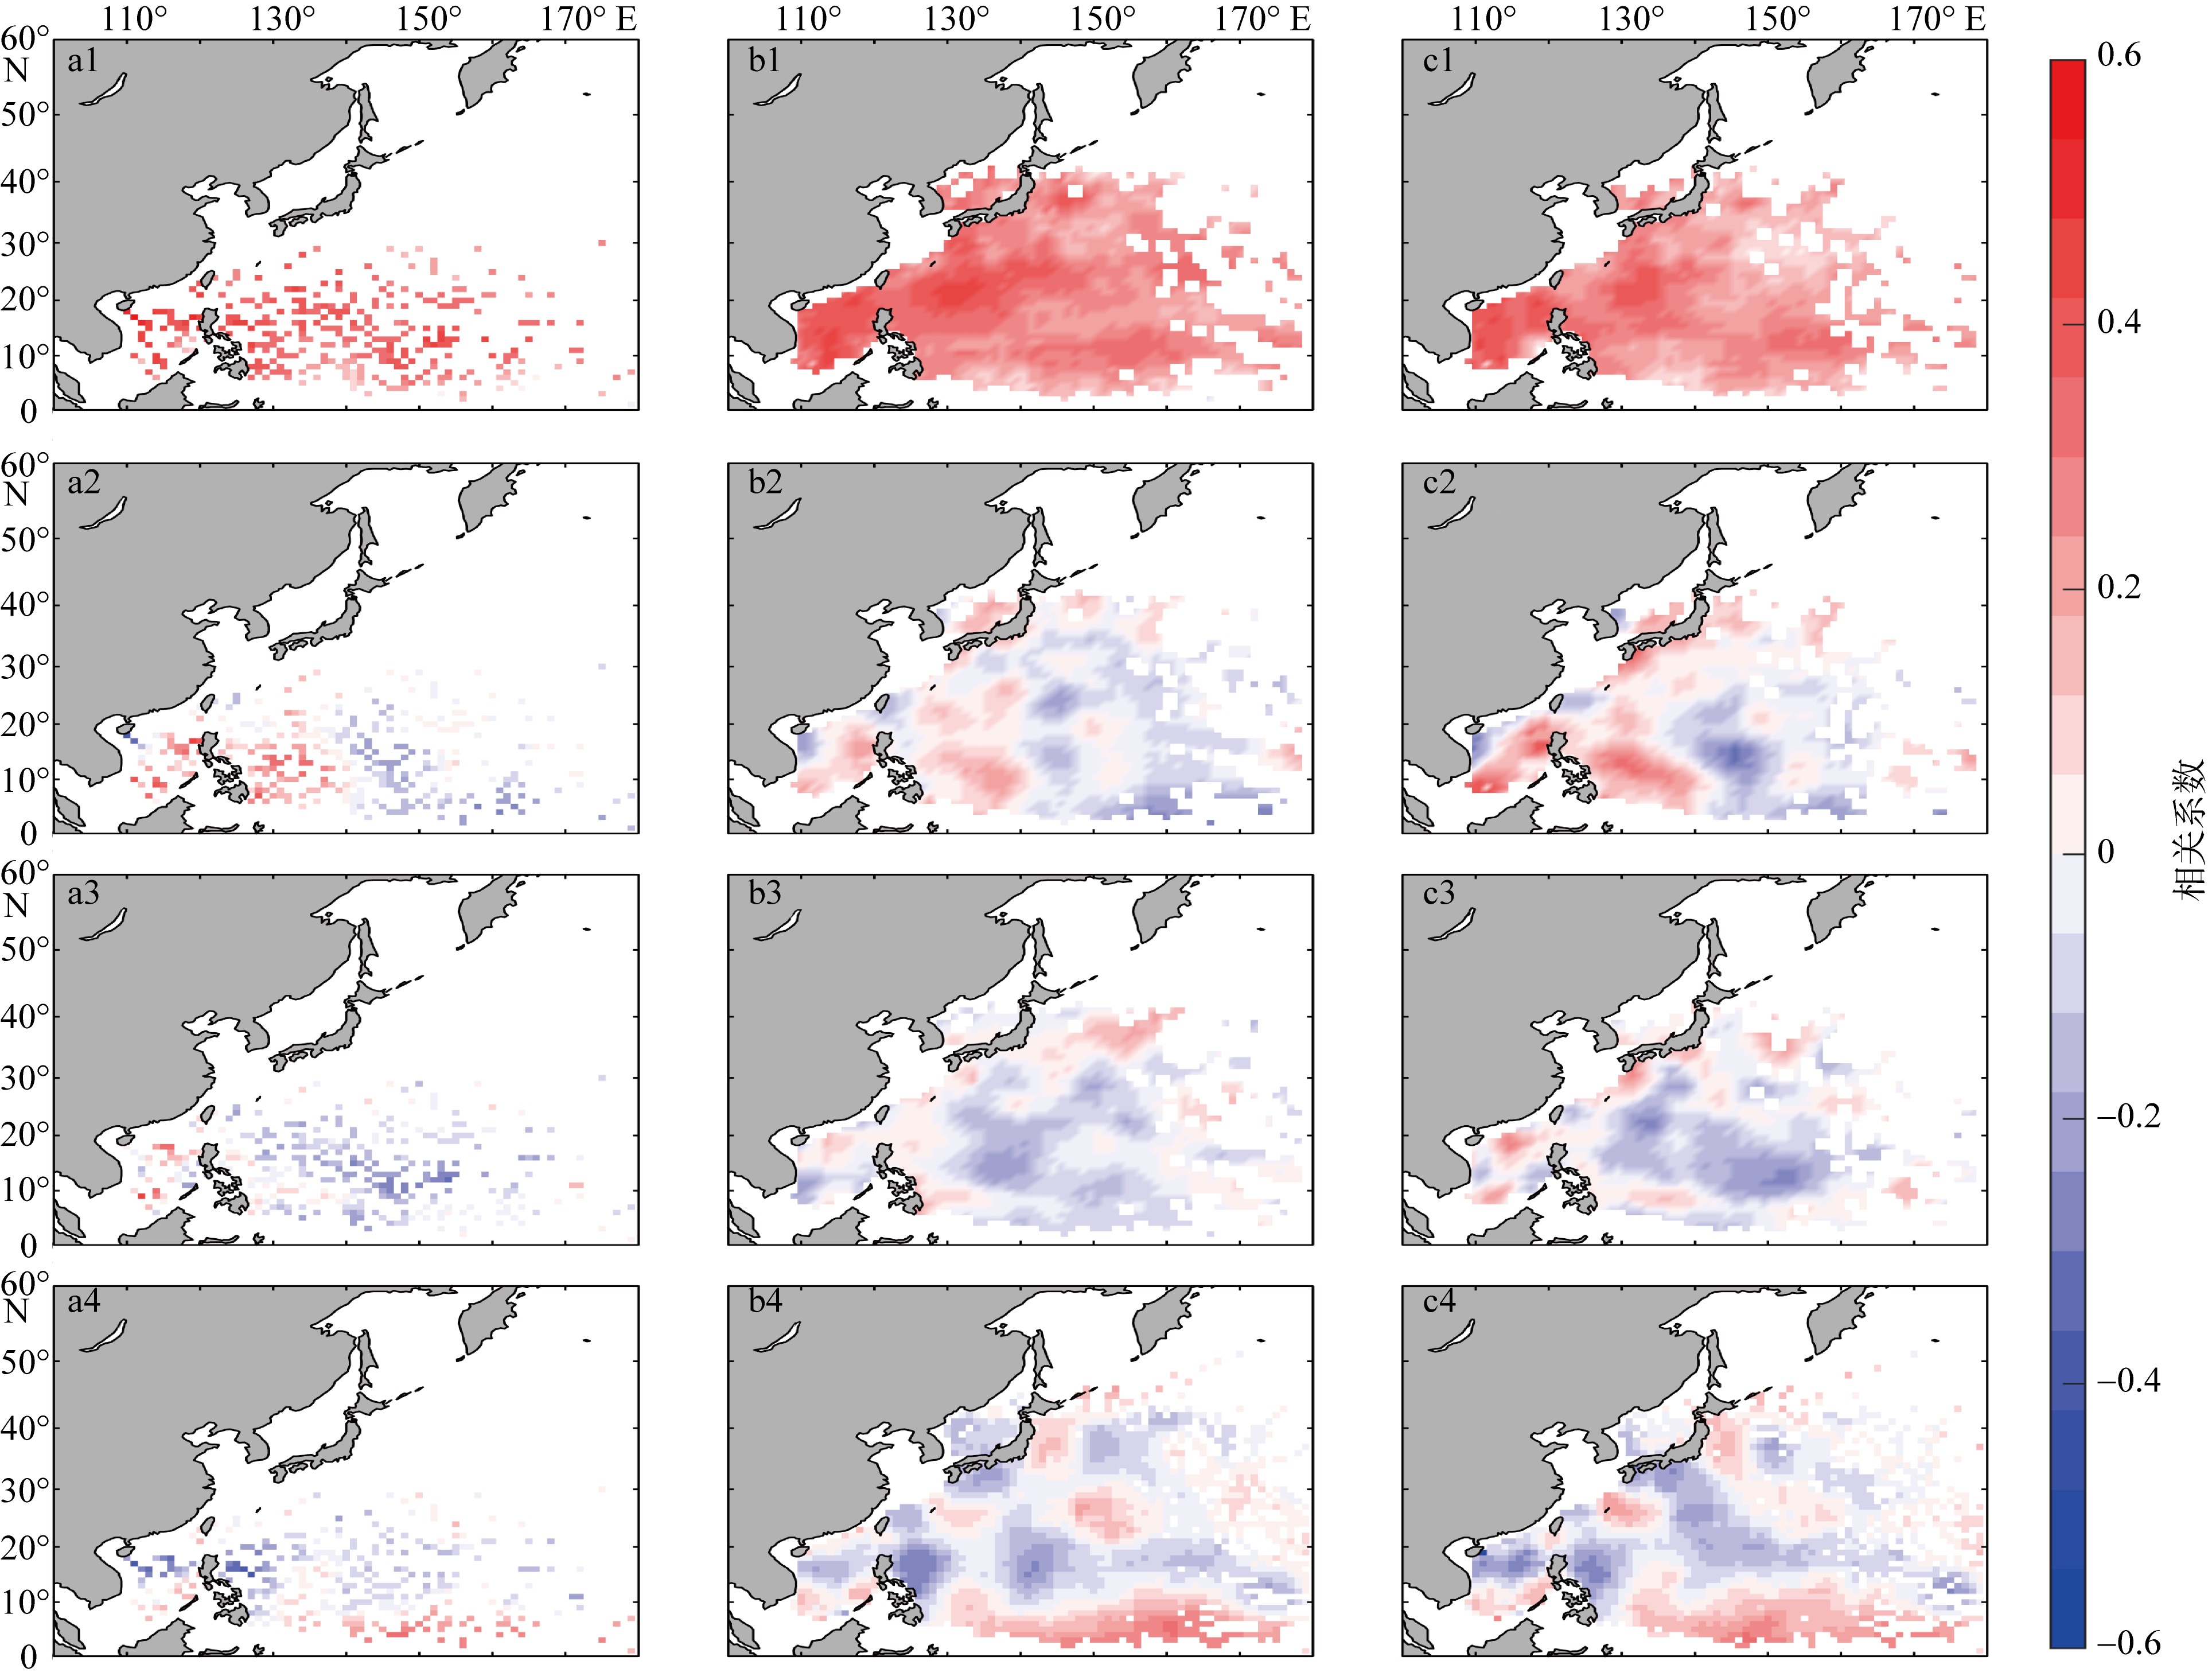
Fig. 5
Fig. 6
Spatial distribution of Richardson number (RI) averaged over multiple years and months at different depths corresponding to the peak typhoon months. a1 to a4 represent the RI values within the mixed layer, from the mixed layer to 300 m, from 300 m to 700 m, and from 700 m to 2000 m in August, respectively; b1 to b4 represent the RI values within the mixed layer, from the mixed layer to 300 m, from 300 m to 700 m,, and from 700 m to 2000 m in September, respectively"
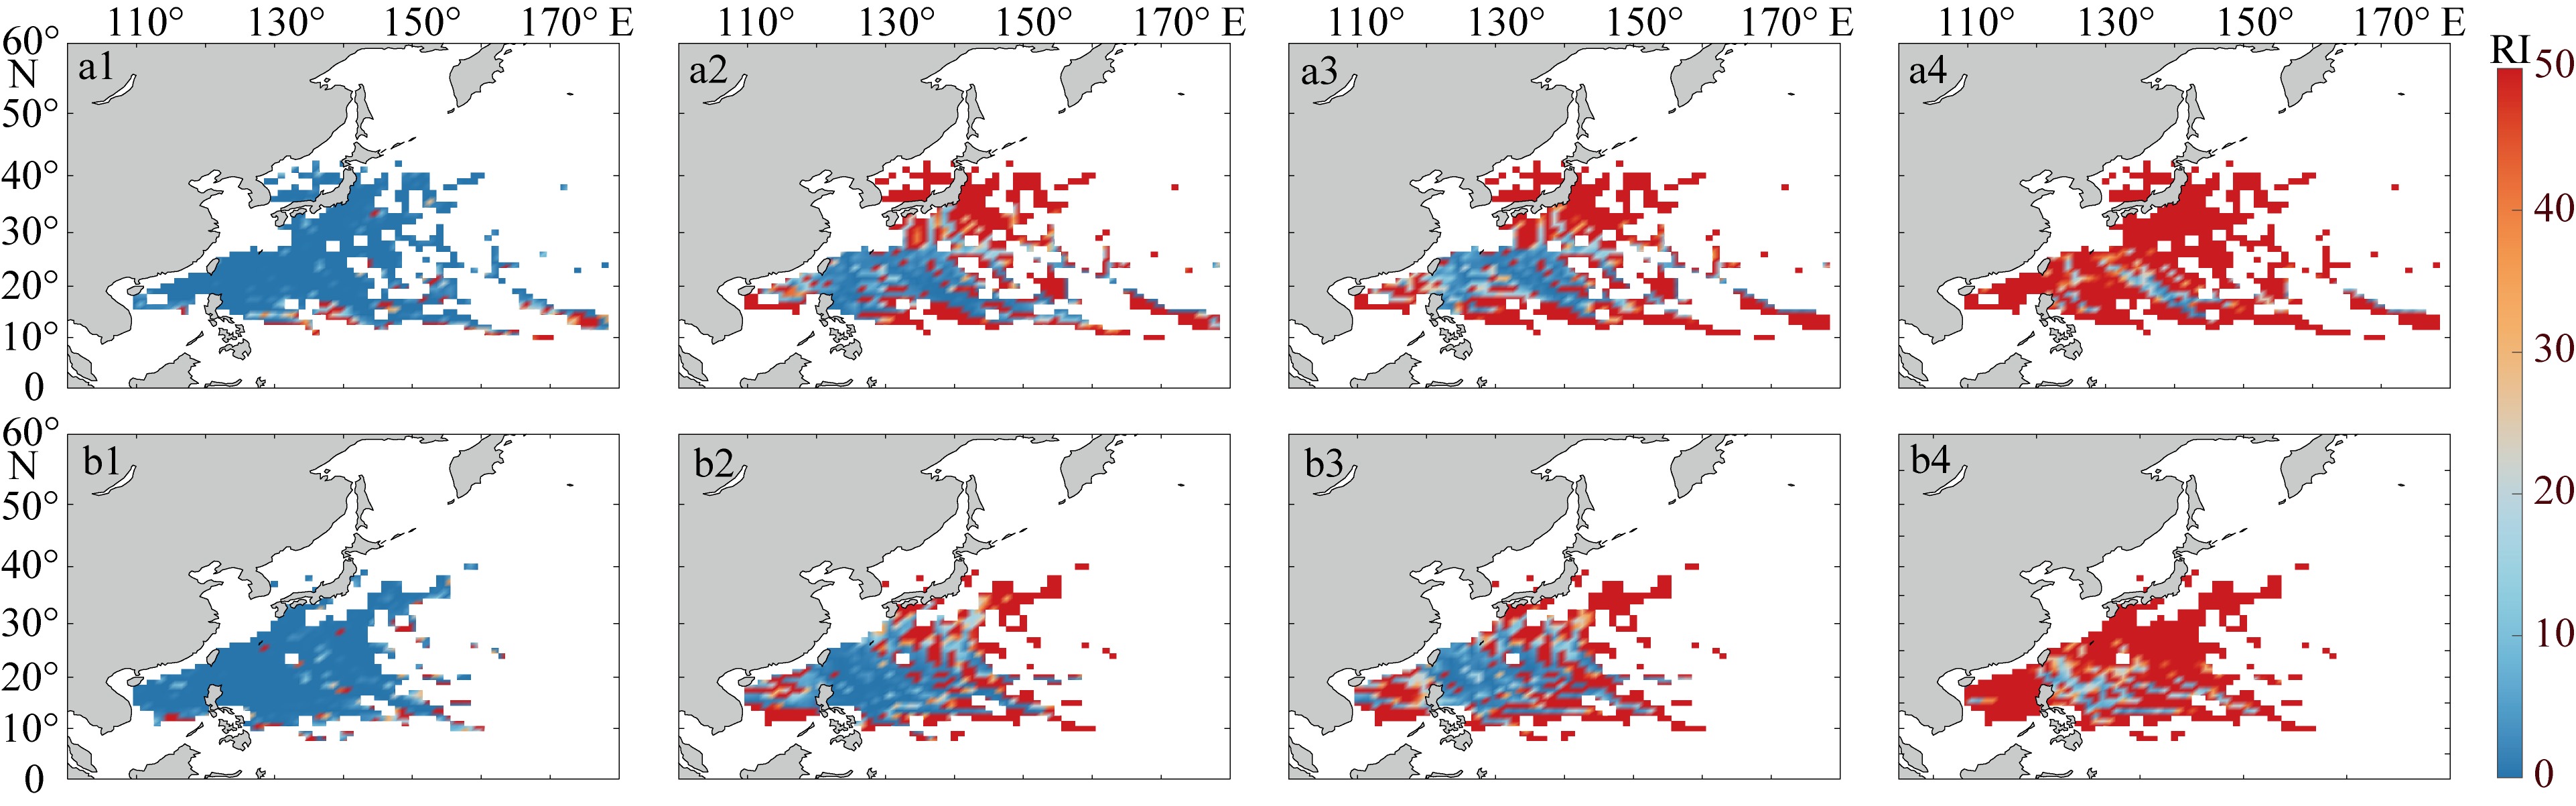
Fig. 6
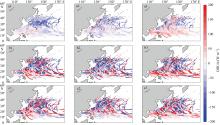
Fig. 7
Ocean heat uptake anomaly (OHUA) at different depths along the typhoon path in August and September. (a1) to (a3), (b1) to (b3), and (c1) to (c3) are the OHUA values that lag by 0, 1, and 2 months within the mixed layer, from the mixed layer to 300 m, and from 300 m to 700 m, respectively"
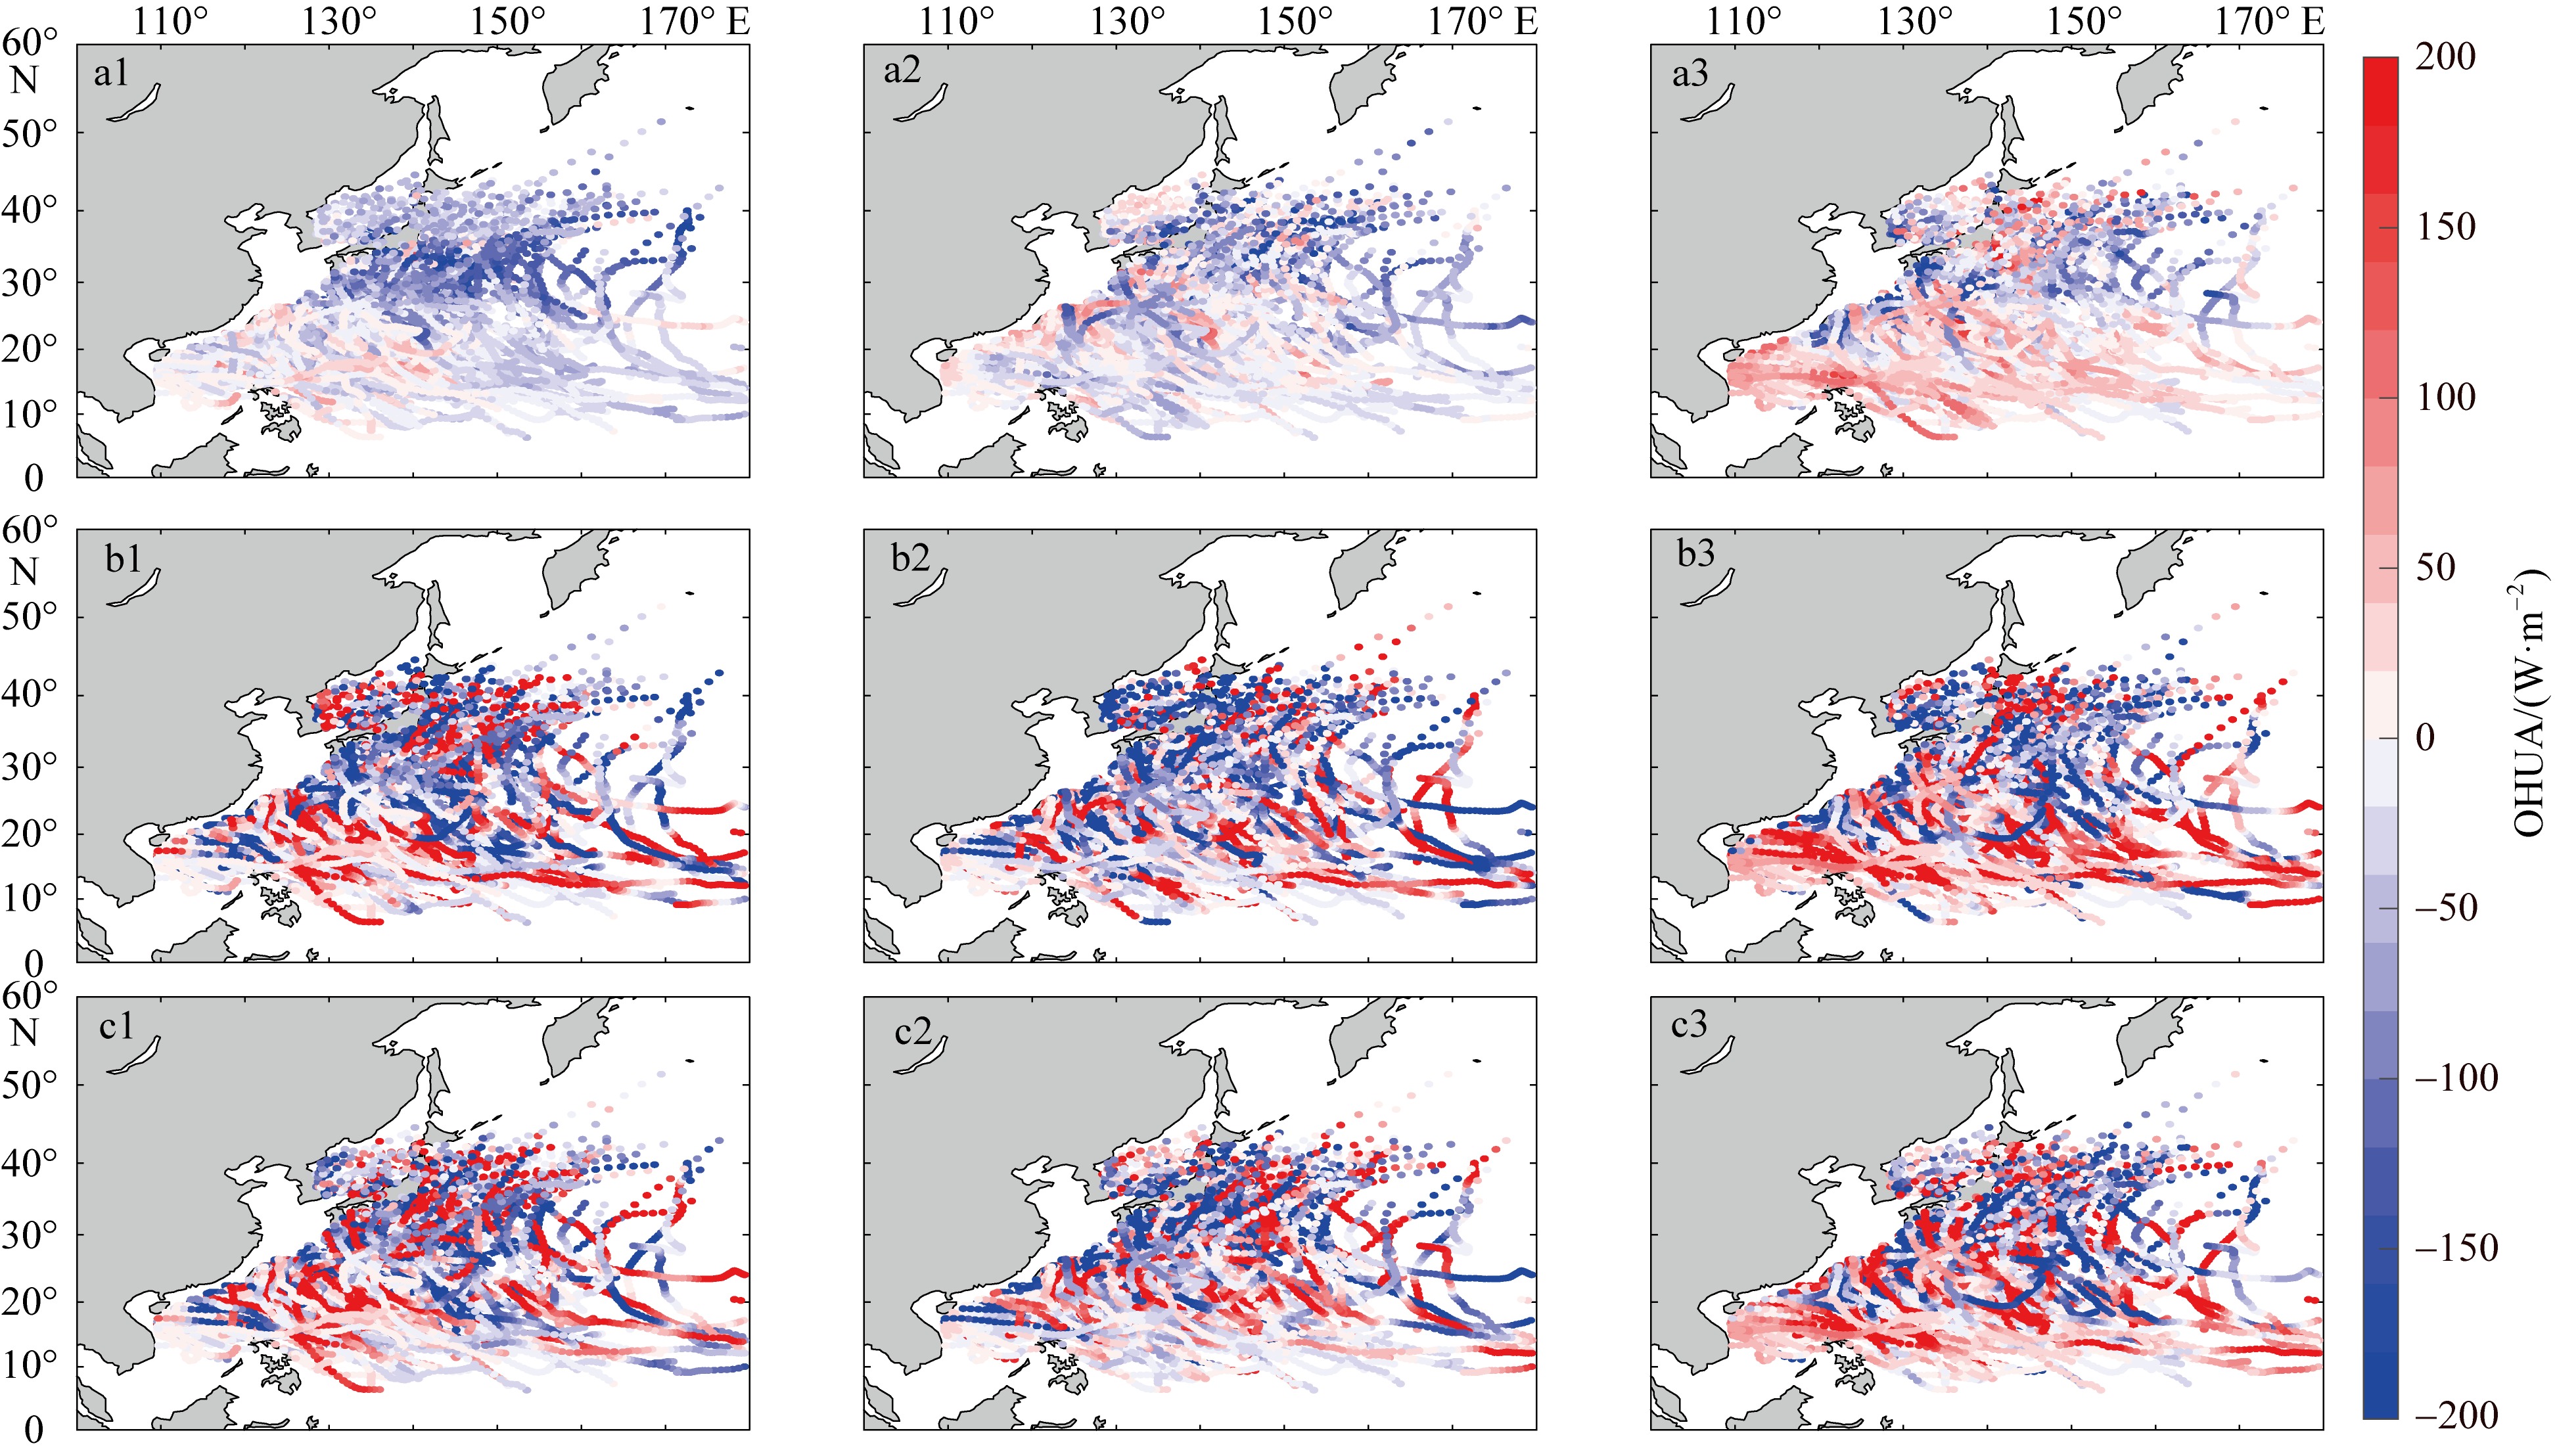
Fig. 7
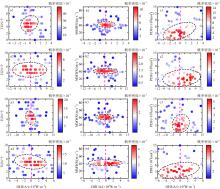
Fig. 8
Relative scatter probability density distribution of ocean heat uptake anomaly (OHUA) versus typhoon parameters at different depths during the typhoon season (July to October). (a1) to (a4) are the relative distribution of OHUA and typhoon generation quantities within the mixed layer, from the mixed layer to 300 m, from 300 m to 700 m, and from 700 m to 2000 m, respectively; (b1) to (b4) are similar to (a1) to (a4), except that the typhoon parameter is the maximum wind speed; (c1) to (c4) are similar to (a1) to (a4), except that the typhoon parameter is the energy dissipation index. The coloring in the figure represents statistical probability density, the black circle represents the high probability density distribution range (above average), and the purple dashed line represents the zero contour of OHUA"
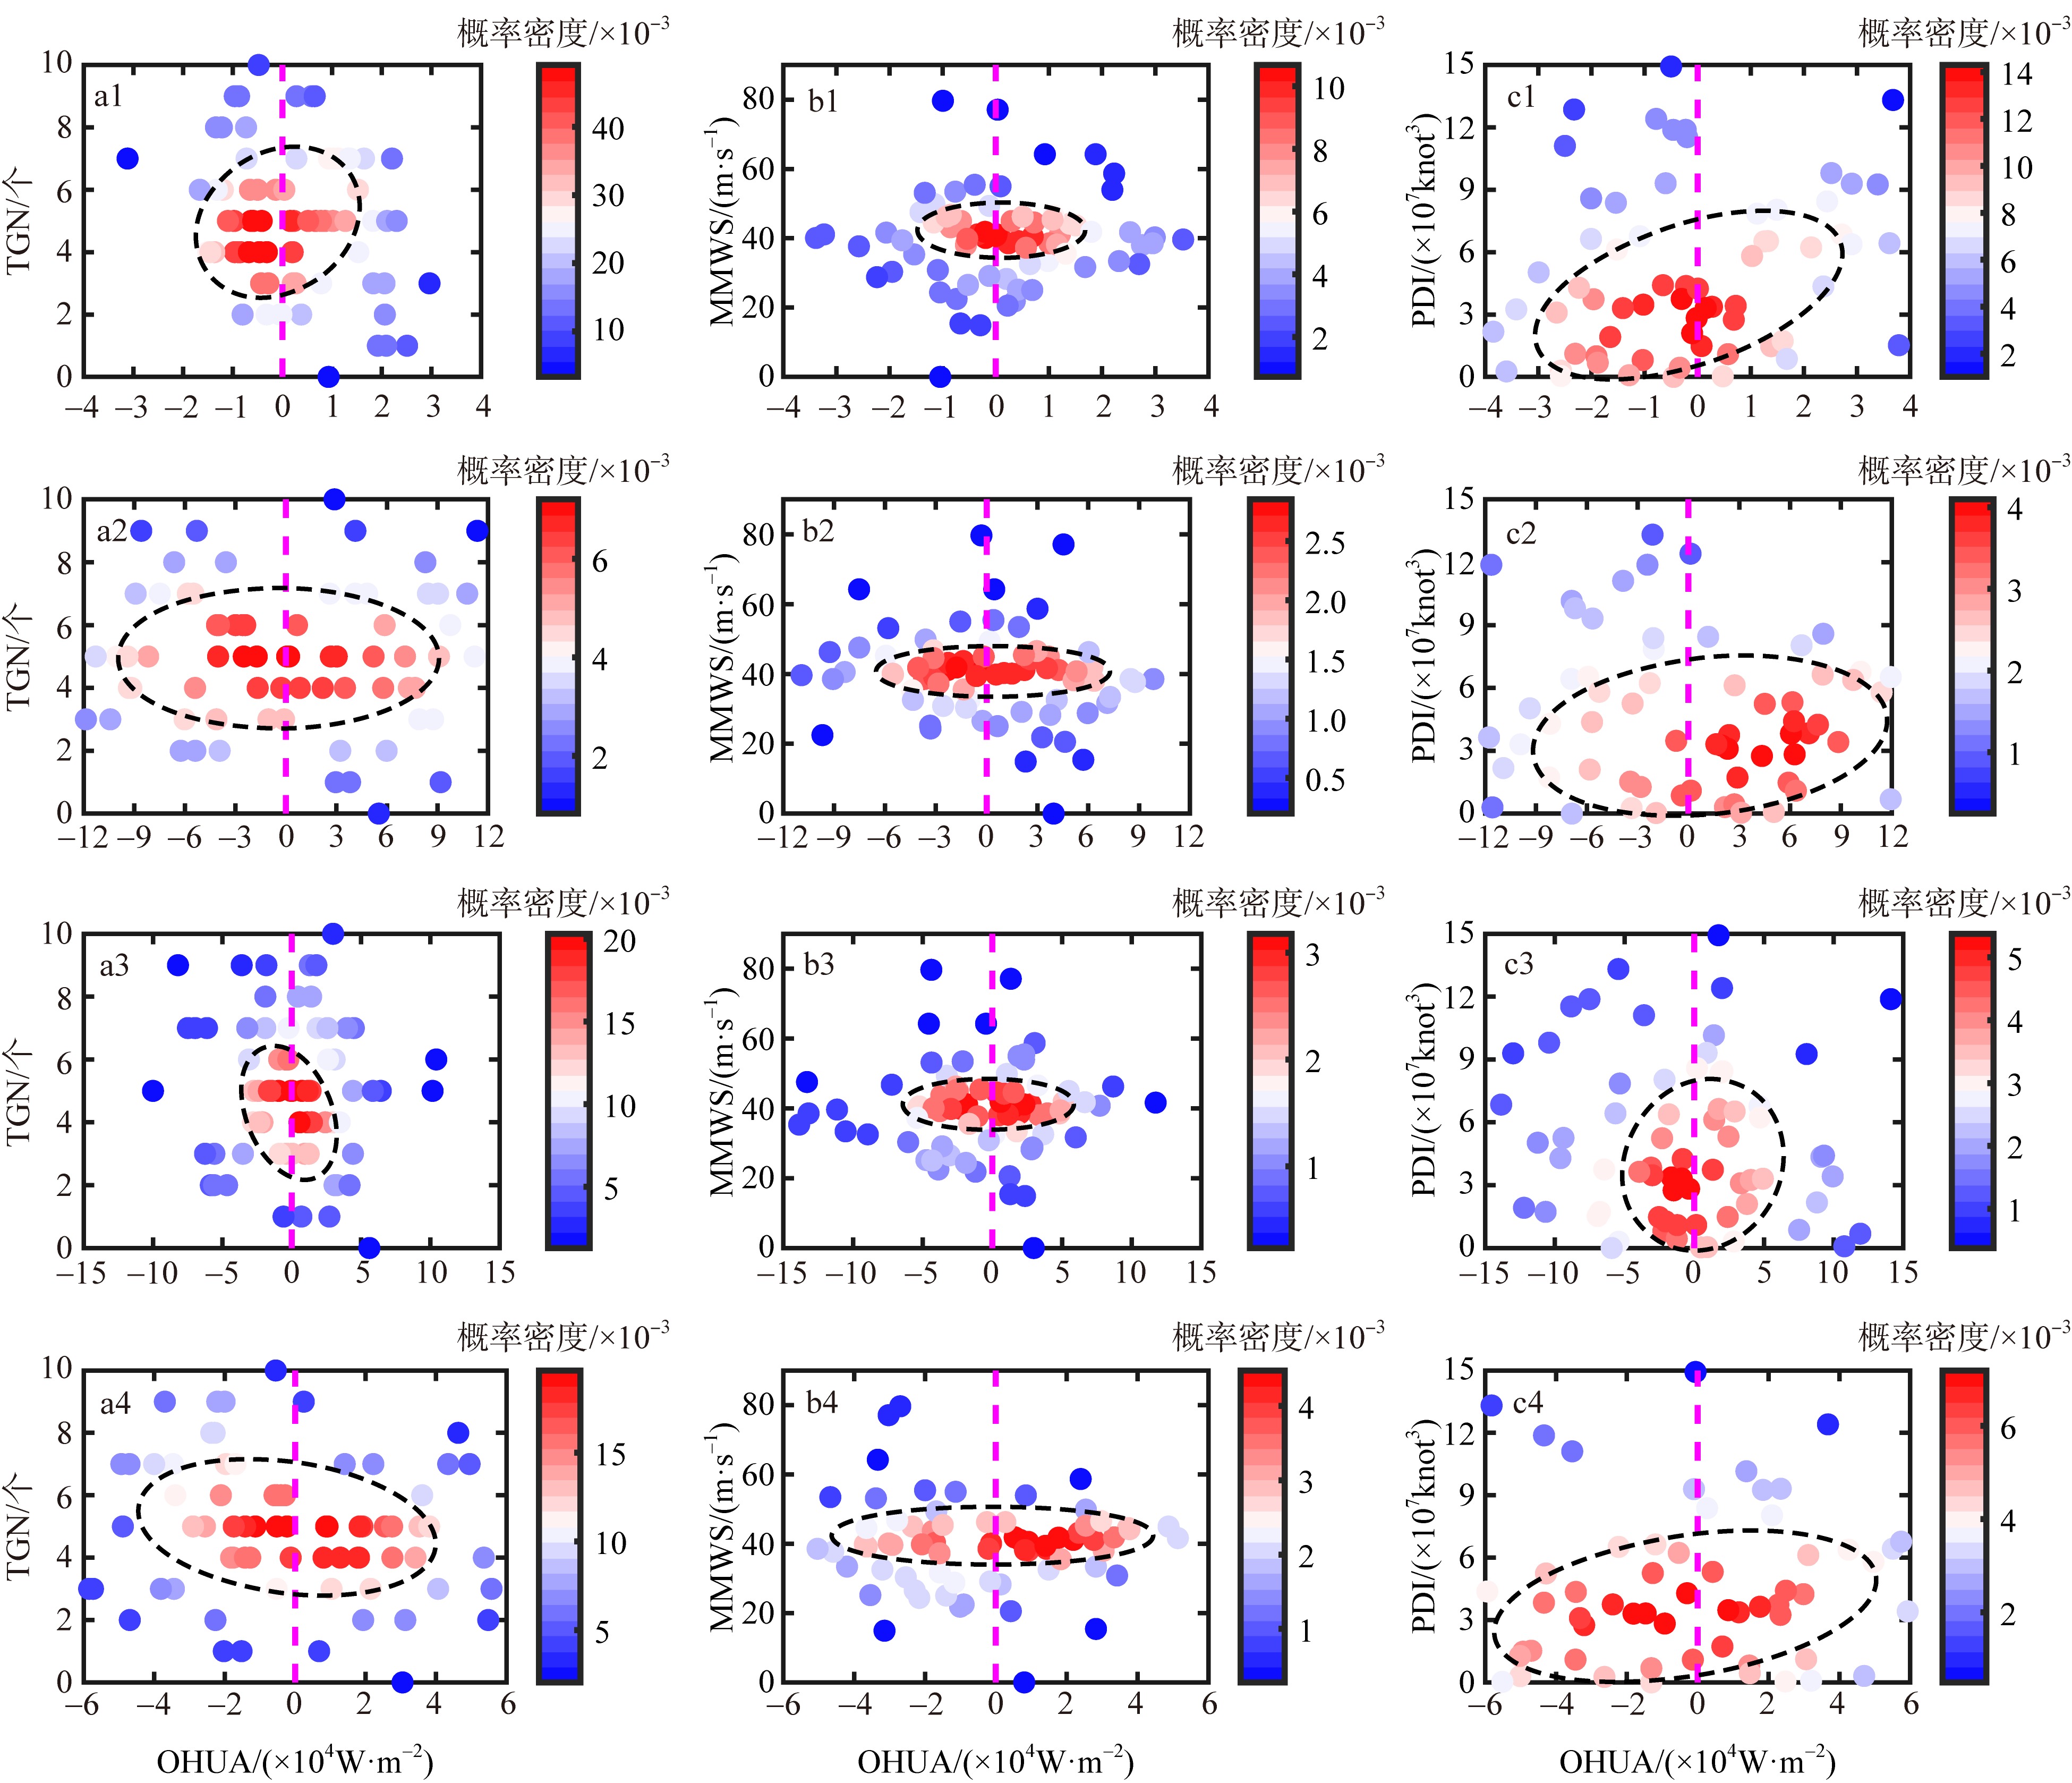
Fig. 8
Tab. 1
Lag correlation coefficients between ocean heat uptake anomaly (OHUA) at different depths and typhoon parameters"
| 深度 | 台风参数 | 滞后月份 | ||||||||||||
|---|---|---|---|---|---|---|---|---|---|---|---|---|---|---|
| -6 | -5 | -4 | -3 | -2 | -1 | 0 | 1 | 2 | 3 | 4 | 5 | 6 | ||
| 混合层 以内 | TGN | -0.23 | -0.44 | -0.62 | -0.67 | -0.52 | -0.20 | 0.02 | 0.37 | 0.64 | 0.75 | 0.63 | 0.28 | -0.18 |
| MMWS | -0.24 | -0.38 | -0.36 | -0.30 | -0.22 | -0.12 | 0.02 | 0.32 | 0.47 | 0.45 | 0.25 | 0.06 | -0.11 | |
| PDI | -0.23 | -0.36 | -0.44 | -0.47 | -0.40 | -0.19 | -0.03 | 0.28 | 0.52 | 0.61 | 0.49 | 0.18 | -0.17 | |
| 混合层’300m | TGN | -0.30 | -0.40 | -0.38 | -0.20 | -0.03 | 0.12 | -0.10 | 0.06 | 0.30 | 0.36 | 0.22 | 0.17 | 0.05 |
| MMWS | -0.22 | -0.30 | -0.28 | -0.21 | -0.12 | 0.17 | -0.08 | 0.03 | 0.00 | 0.20 | 0.28 | 0.15 | 0.04 | |
| PDI | -0.34 | -0.37 | -0.32 | -0.22 | -0.10 | 0.11 | -0.10 | 0.07 | 0.20 | 0.24 | 0.21 | 0.18 | 0.14 | |
| 300~700m | TGN | 0.08 | 0.25 | 0.17 | 0.09 | -0.05 | -0.20 | 0.13 | 0.10 | -0.04 | -0.02 | -0.21 | -0.32 | -0.23 |
| MMWS | 0.00 | 0.06 | 0.03 | 0.01 | -0.03 | -0.06 | 0.21 | 0.13 | -0.14 | -0.10 | -0.09 | -0.14 | -0.16 | |
| PDI | -0.03 | 0.17 | 0.14 | 0.07 | 0.02 | -0.17 | 0.09 | 0.10 | 0.02 | -0.05 | -0.14 | -0.28 | -0.15 | |
| 0~2000m | TGN | -0.26 | -0.41 | -0.54 | -0.52 | -0.38 | -0.14 | 0.03 | 0.34 | 0.54 | 0.65 | 0.45 | 0.15 | -0.17 |
| MMWS | -0.25 | -0.36 | -0.36 | -0.31 | -0.21 | -0.03 | 0.06 | 0.28 | 0.28 | 0.34 | 0.27 | 0.08 | -0.12 | |
| PDI | -0.30 | -0.36 | -0.40 | -0.39 | -0.30 | -0.13 | -0.02 | 0.28 | 0.44 | 0.49 | 0.38 | 0.11 | -0.10 | |
Tab. 1
Fig. 9
Frequency statistics of 0 to 2000 m ocean heat content anomaly (OHCA) and typhoon parameters under different climatic conditions in the Northwest Pacific from 2004 to 2023. (a) to (d) show the frequency statistics of OHCA, OHUA, TGN, MMWS, and PDI, respectively. The red solid line in the figure represents the temperature anomaly value and the red and blue shadows represent El Niño and La Niña events, respectively"
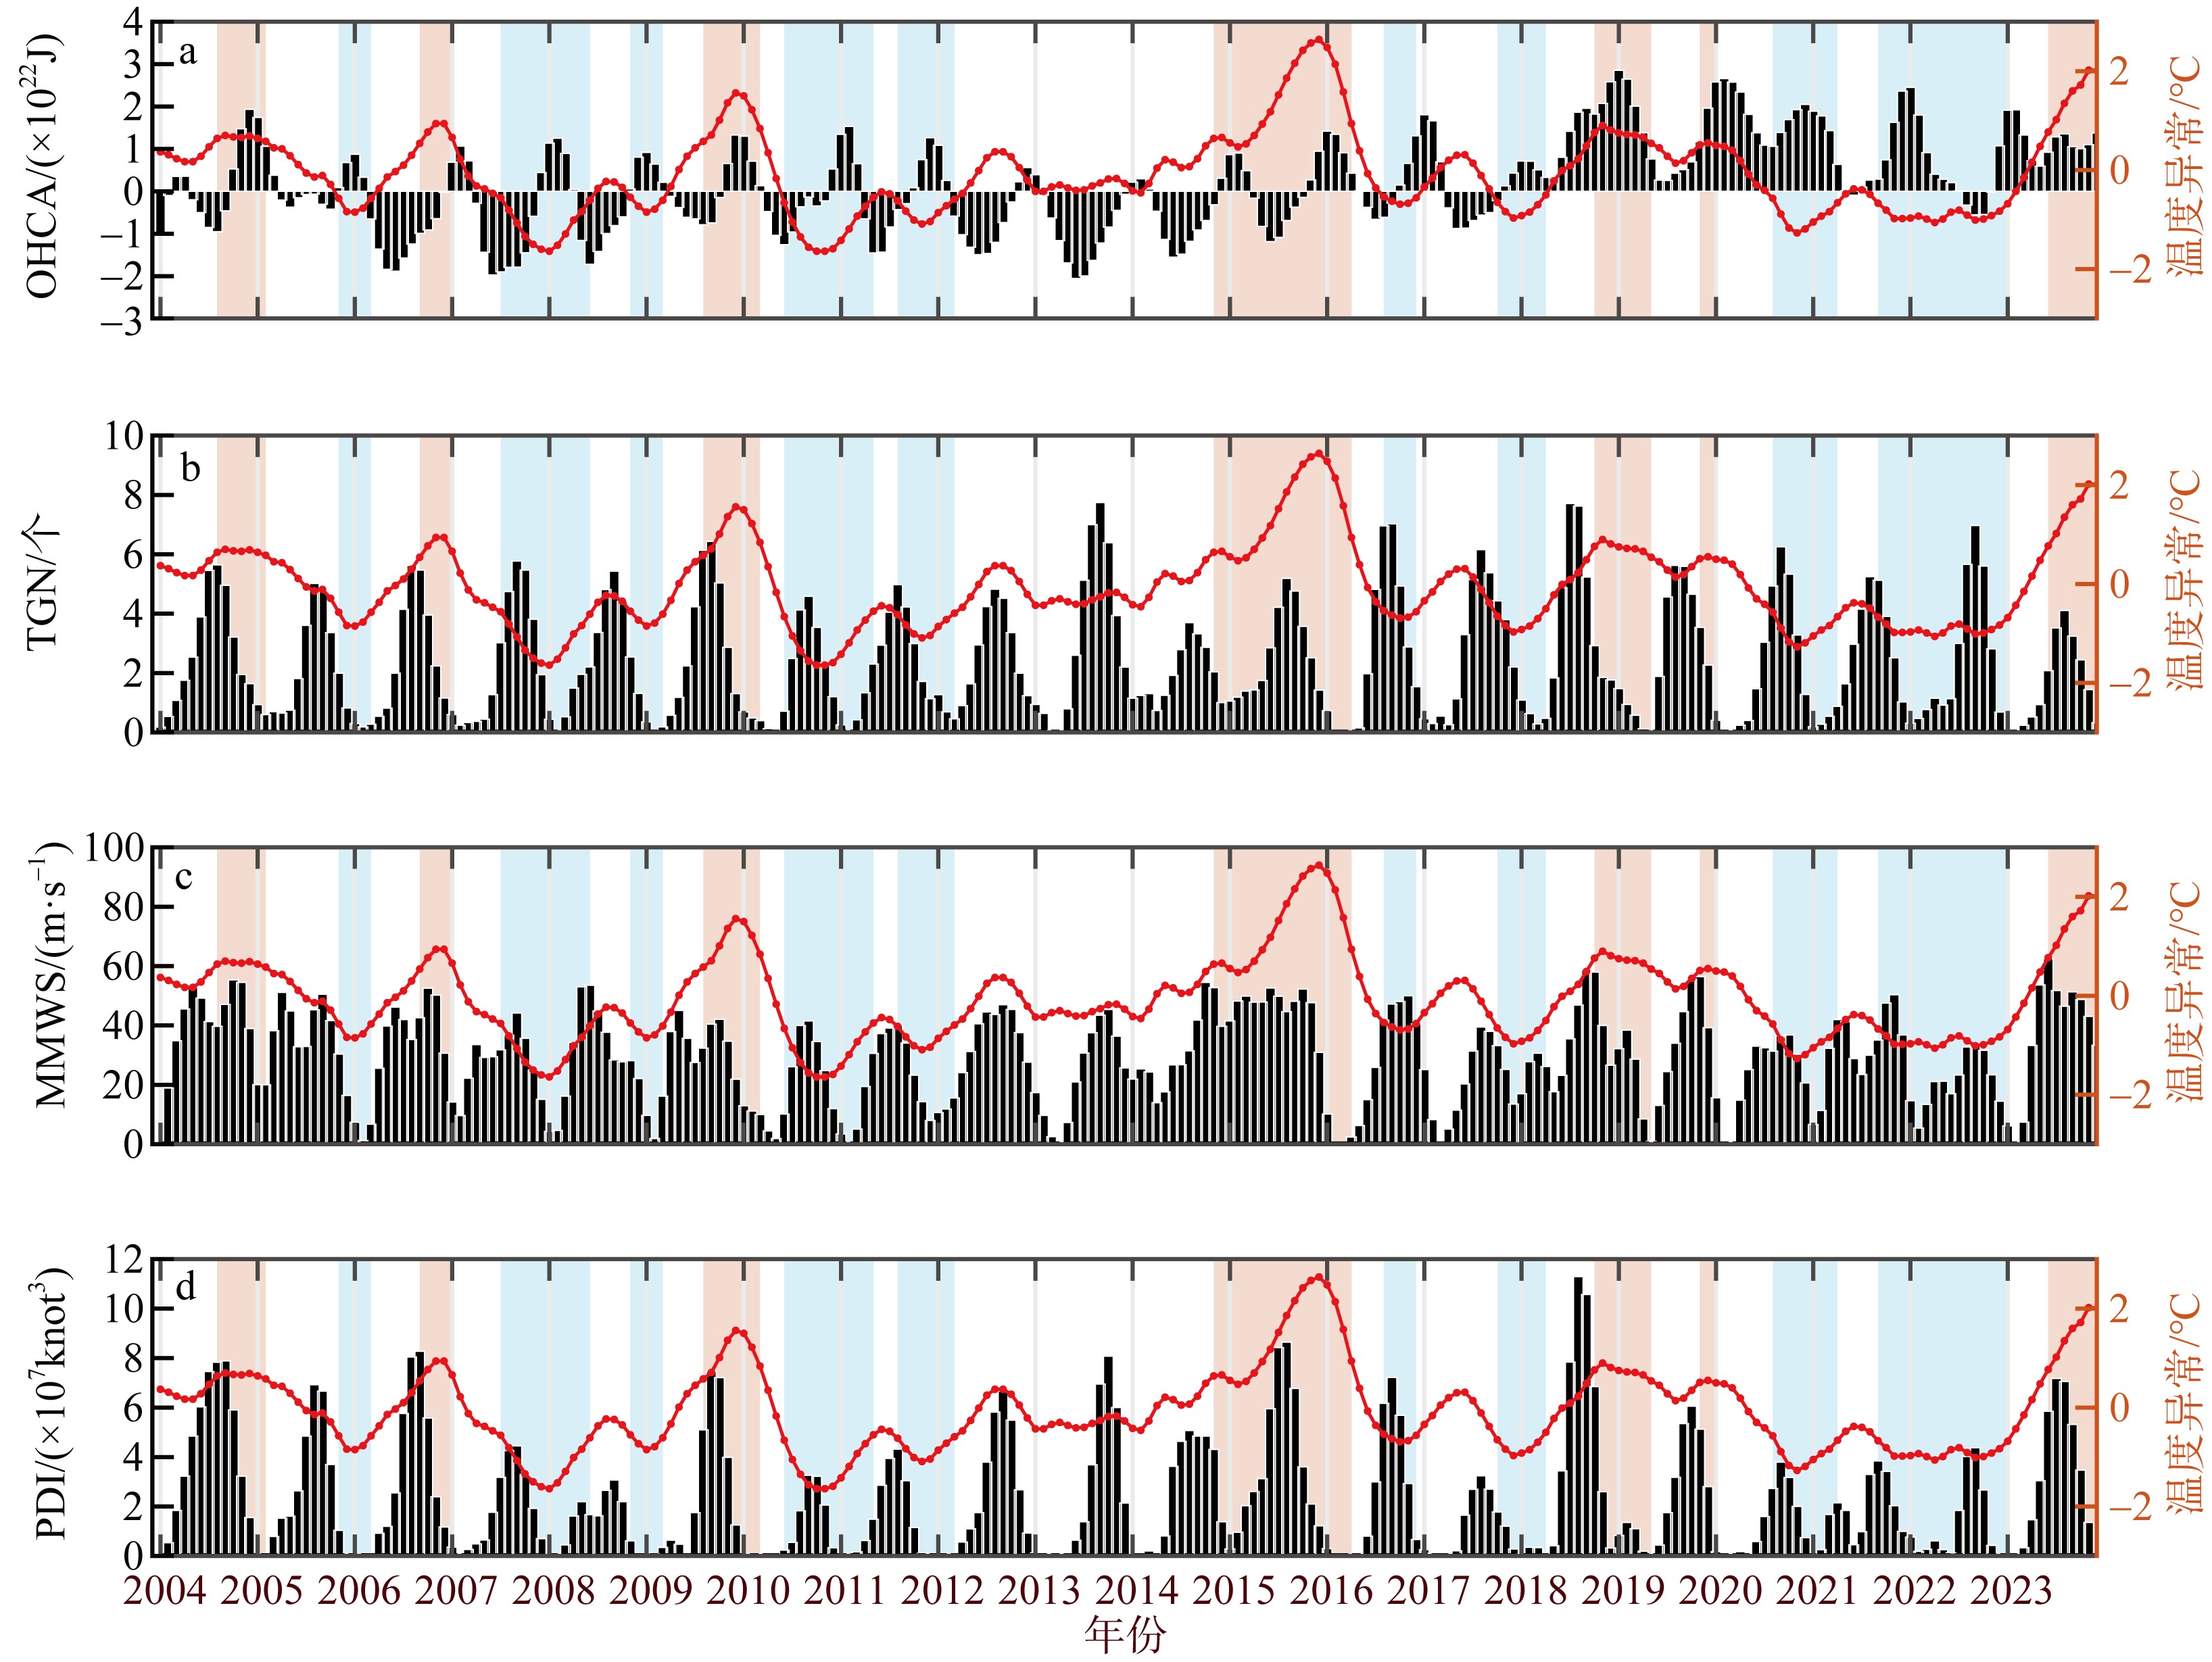
Fig. 9
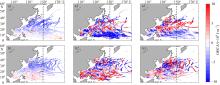
Fig. 10
Variations in ocean heat content anomaly (OHCA) along typhoon tracks in various water layers under different climatic conditions in the Northwest Pacific from 2004 to 2023. (a1) to (a3) and (b1) to (b3) represent OHCA changes within the mixed layer depth, from the mixed layer to 300 m, and from 300 m to 700 m along typhoon tracks during El Niño and La Niña events, respectively. The black dashed line in the figure represents 150°E"

Fig. 10
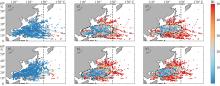
Fig. 11
Spatial distribution of Richardson number (RI) under different climatic conditions in the Northwest Pacific from 2004 to 2023. (a1) to (a3) and (b1) to (b3) represent the average RI distribution within the mixed layer depth, from the mixed layer to 300 m, and from 300 m to 700 m during El Niño and La Niña events, respectively. The black dashed circle in the figure represents the distribution range of low RI values, and the black dashed line represents 150°E"
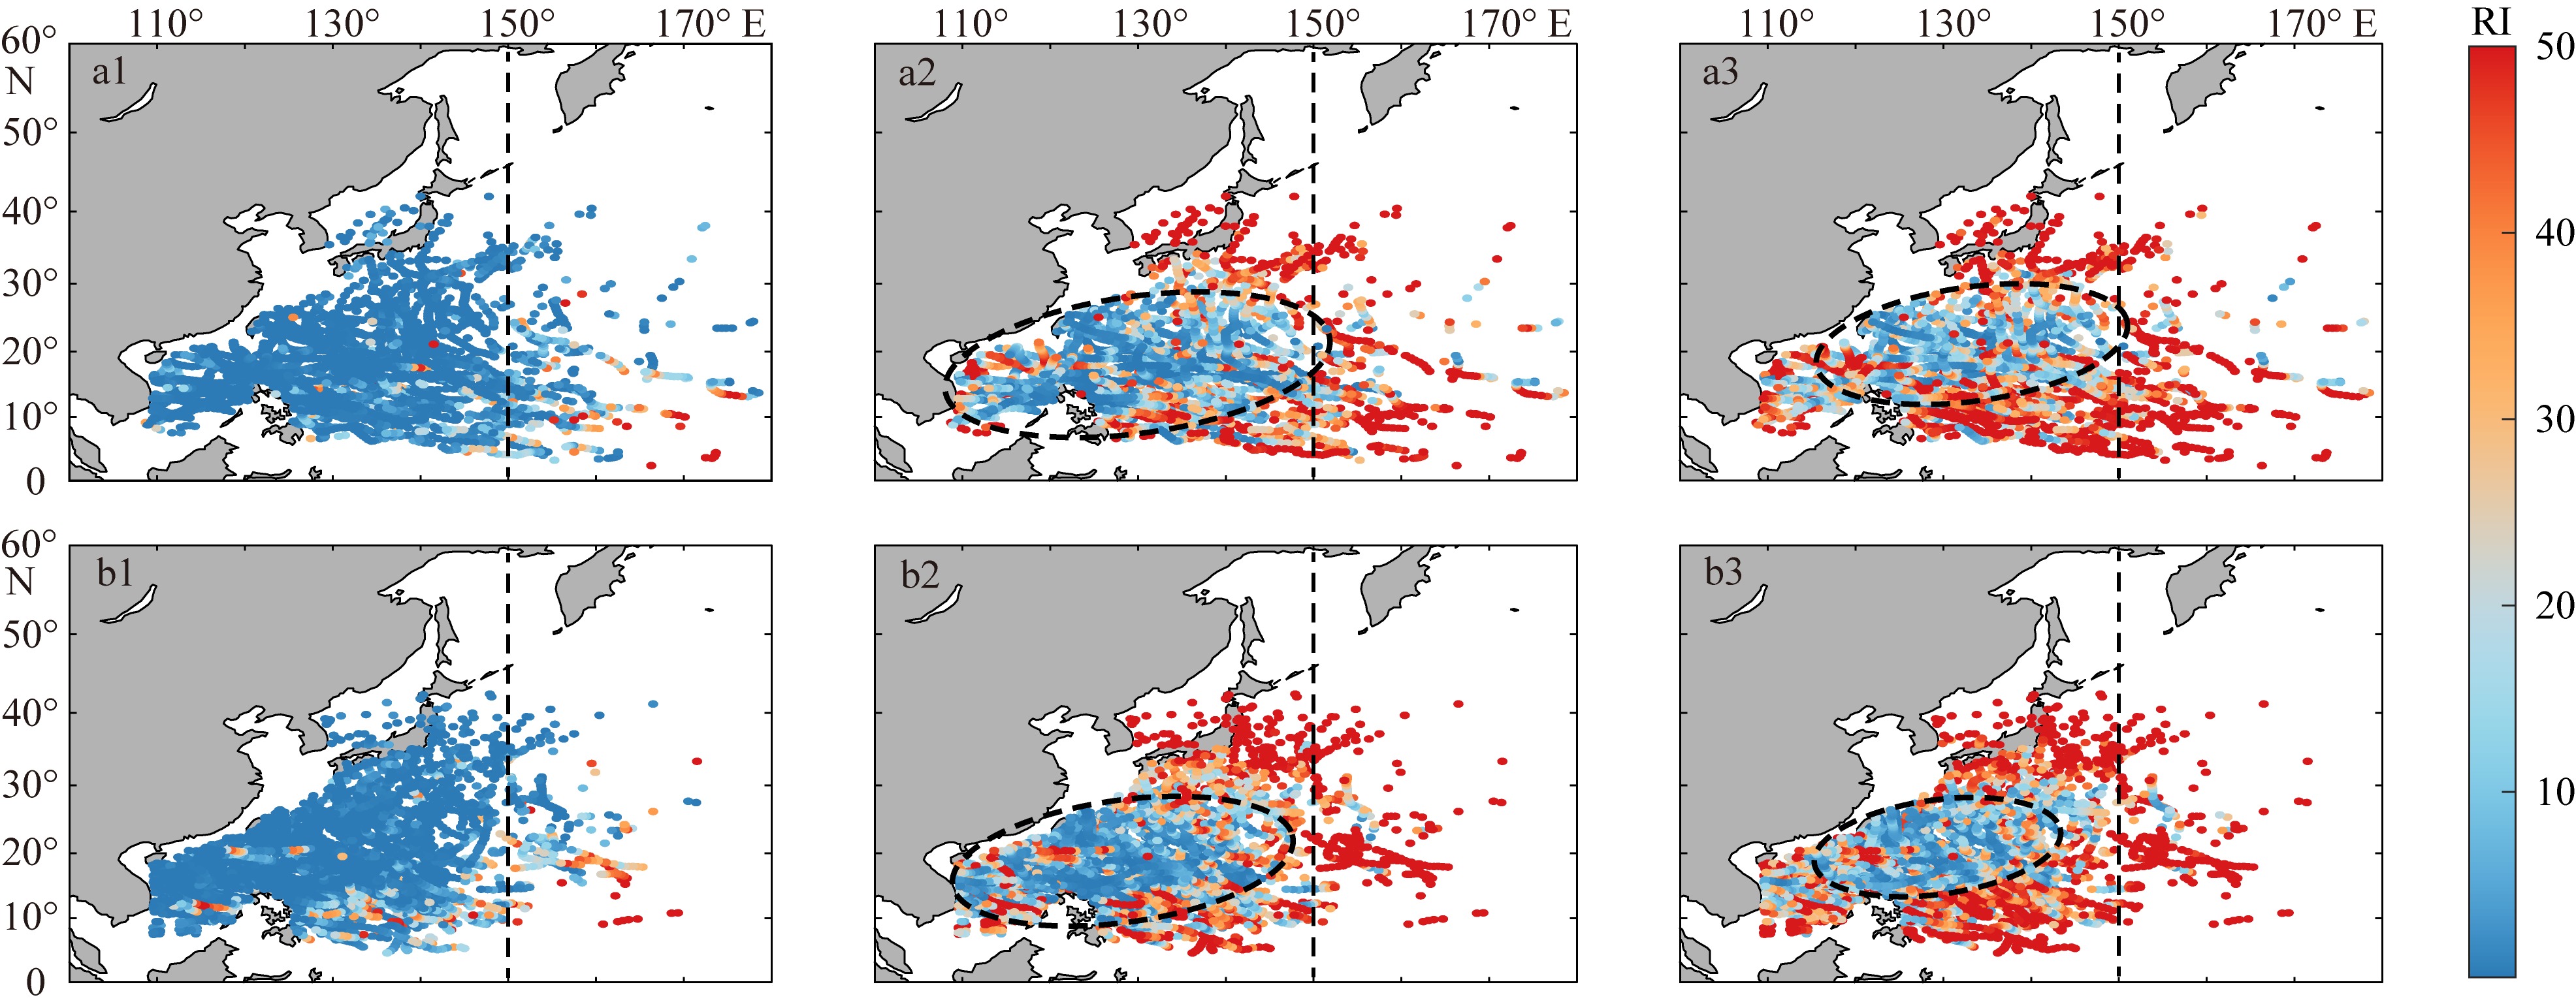
Fig. 11
| [18] |
|
| [19] |
doi: 10.1175/JCLI-D-24-0398.1 |
| [20] |
doi: 10.1175/JCLI-D-22-0949.1 |
| [21] |
|
| [22] |
|
| [23] |
doi: 10.1038/ngeo2792 |
| [24] |
doi: 10.5194/os-5-351-2009 |
| [25] |
doi: 10.1175/1520-0485(1981)011<0153:UORTAH>2.0.CO;2 |
| [26] |
doi: 10.1175/1520-0485(1994)024<0233:FSRTAM>2.0.CO;2 |
| [27] |
|
| [28] |
doi: 10.2151/sola.2022-011 |
| [29] |
|
| [30] |
doi: 10.1088/1748-9326/acd2ed |
| [31] |
doi: 10.1073/pnas.1314721110 pmid: 24014590 |
| [32] |
doi: 10.1038/nature05785 |
| [33] |
|
| [34] |
|
| [35] |
doi: 10.1029/2018EF000825 |
| [36] |
doi: 10.1126/science.1116448 pmid: 16166514 |
| [37] |
doi: 10.1007/s00376-024-4076-z |
| [1] |
doi: 10.1088/1748-9326/8/4/044009 |
| [2] |
doi: 10.1002/grl.v42.16 |
| [3] |
|
| [4] |
doi: 10.1126/sciadv.1601545 |
| [5] |
|
| [6] |
doi: 10.1175/JCLI-D-19-0305.1 |
| [7] |
doi: 10.1038/nature03906 |
| [8] |
doi: 10.1029/2000JD900641 |
| [9] |
doi: 10.1175/1520-0469(2004)061<0843:ECOTCI>2.0.CO;2 |
| [10] |
doi: 10.1038/s41467-022-35530-9 pmid: 36517474 |
| [38] |
doi: 10.3389/fmars.2023.1245348 |
| [39] |
doi: 10.1111/fog.v30.1 |
| [40] |
doi: 10.1002/jgrc.v121.9 |
| [41] |
doi: 10.1002/grl.v42.12 |
| [11] |
doi: 10.1175/2008JCLI2131.1 |
| [12] |
doi: 10.1038/s41586-024-08051-2 |
| [13] |
doi: 10.1175/1520-0485(1972)002<0218:HHPOTG>2.0.CO;2 |
| [14] |
doi: 10.1126/science.287.5461.2225 |
| [15] |
|
| [16] |
doi: 10.1002/jgrc.v121.11 |
| [17] |
|
| [1] | LIANG Shun, HUANG Guibin, HE Guomei, ZHANG Yongchui, ZHOU Yi, WANG Yang, HONG Mei. Analysis of spatiotemporal variation characteristics of local typhoons in the South China Sea [J]. Journal of Tropical Oceanography, 2026, 45(2): 59-70. |
| [2] | FENG Zhanquan, SU Maoliang, DU Yuanyuan, ZHONG Youling, ZHANG Junbin. MaxEnt model predicting potential distribution of Trichiurus japonicus in the coastal waters of China under global climate change [J]. Journal of Tropical Oceanography, 2025, 44(5): 77-85. |
| [3] | ZHOU Yunxia, ZHAI Liping, QIN Hao, HUANG Qing, QI Liyan. Diagnostic analysis and causes of the northward turning path of typhoon Chaba after landfall [J]. Journal of Tropical Oceanography, 2025, 44(4): 67-76. |
| [4] | HUANG Zhaoyong, XU Guilin, MO Zhiming. Research on a prediction model for direct economic losses caused by typhoons in Guangxi [J]. Journal of Tropical Oceanography, 2025, 44(4): 56-66. |
| [5] | XIAO Haiting, HUANG Rongyong, LIU Yi, YU Kefu. Spatiotemporal changes of lime-sand islands in the Xisha Islands under the impacts of typhoons [J]. Journal of Tropical Oceanography, 2025, 44(2): 157-177. |
| [6] | LIU Jie, YAN Tong, JING Zhiyou. Observations of near-inertial waves generated by three successive typhoons in the northwestern South China Sea [J]. Journal of Tropical Oceanography, 2025, 44(1): 66-81. |
| [7] | SUN Zeming, HAN Shuzong, WANG Mingjie, SU Hanxiang. Statistical study on the influence of typhoon with different path on the temperature of coastal waters of China [J]. Journal of Tropical Oceanography, 2024, 43(5): 17-31. |
| [8] | SHANG Jie, WU Ying, ZOU Yike, MA Jingwen. Retrieval of typhoon precipitation rate over ocean surface based on FY-3D/MWRI Data* [J]. Journal of Tropical Oceanography, 2024, 43(5): 32-40. |
| [9] | SUN Tingting, HAO Wenjin, XU Pengzhen, YE Lijing, DONG Zhijun. Effects of seawater acidification on microorganisms associated with Aurelia coerulea polyps [J]. Journal of Tropical Oceanography, 2023, 42(6): 111-119. |
| [10] | ZHANG Zheran, HU Junyang, ZHOU Kai, ZHANG Penghui, XING Jiuxing, CHEN Shengli. Storm surge simulations of the coastal area of Shenzhen using different types of typhoon meteorological fields—a case study of Typhoon Mangkhut* [J]. Journal of Tropical Oceanography, 2023, 42(6): 1-14. |
| [11] | LI Junmin, LI Bo, CHEN Wuyang, LIU Junliang. Observation characteristics of coastal waves in Sanya and their responses to typhoon processes [J]. Journal of Tropical Oceanography, 2023, 42(4): 25-35. |
| [12] | GAO Na, ZHAO Mingli, MA Yi, XU Wanming, ZHAN Haigang, CAI Shuqun. Effect of typhoon on storm surge in the Pearl River Estuary [J]. Journal of Tropical Oceanography, 2023, 42(1): 32-42. |
| [13] | SHU Aiqing, XU Dongmei, LI Hong, WU Haiying, SHEN Feifei, DEND Hua, BAI Yawen. Assimilating MWHS-2 radiance of FY-3D satellite and its influence on the forecast of Typhoon Mitag* [J]. Journal of Tropical Oceanography, 2022, 41(5): 17-28. |
| [14] | GUO Junli, SHI Lianqiang, CHEN Shenliang, ZHANG Min, CHANG Yang, ZHANG Daheng. Dynamic variations of different sedimentary geomorphology of sandy and gravel embayed beaches on the Zhujiajian Island during typhoon season [J]. Journal of Tropical Oceanography, 2022, 41(4): 82-96. |
| [15] | XI Yangyang, WANG Riming, FENG Bingbin, CHEN Bo. Morphodynamic processes of the Yintan Beach in response to typhoon [J]. Journal of Tropical Oceanography, 2022, 41(4): 97-104. |
|
||