
Journal of Tropical Oceanography ›› 2022, Vol. 41 ›› Issue (5): 29-42.doi: 10.11978/2021190CSTR: 32234.14.2021190
• Marine Meteorology • Previous Articles Next Articles
A case study of the influence of the cold surge and ocean front on the evolution of atmospheric ducts in the northwestern South China Sea
SHI Rui1,2( ), CHEN Ju1,3(), HE Yunkai1,3, SUI Dandan4, SHU Yeqiang1
- 1. State Key Laboratory of Tropical Oceanography (South China Sea Institute of Oceanology, Chinese Academy of Sciences), Guangzhou 510301, China
2. Southern Marine Science and Engineering Guangdong Laboratory (Guangzhou), Guangzhou 511548, China
3. Xisha Marine Environmental National Observation and Research Station (South China Sea Institute of Oceanology, Chinese Academy of Sciences), Guangzhou 510301, China
4. Equipment Public Service Center (South China Sea Institute of Oceanology, Chinese Academy of Sciences), Guangzhou 510301, China
-
Received:2021-12-31Revised:2022-03-12Online:2022-09-10Published:2022-03-21 -
Contact:CHEN Ju E-mail:shirui@scsio.ac.cn;jchen@scsio.ac.cn -
Supported by:Key Special Project for Introduced Talents Team of Southern Marine Science and Engineering Guangdong Laboratory (Guangzhou)(GML2019ZD0304);National Natural Science Foundation of China(41676018);Science and Technology Planning Project of Guangzhou City, China(202002030490)
CLC Number:
- P732.6
Cite this article
SHI Rui, CHEN Ju, HE Yunkai, SUI Dandan, SHU Yeqiang. A case study of the influence of the cold surge and ocean front on the evolution of atmospheric ducts in the northwestern South China Sea[J].Journal of Tropical Oceanography, 2022, 41(5): 29-42.
share this article
Add to citation manager EndNote|Reference Manager|ProCite|BibTeX|RefWorks
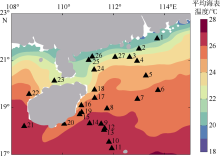
Fig. 1
The investigated area in the northern South China Sea from December 13rd to 22th, 2012. The black triangles are sounding observation sites"
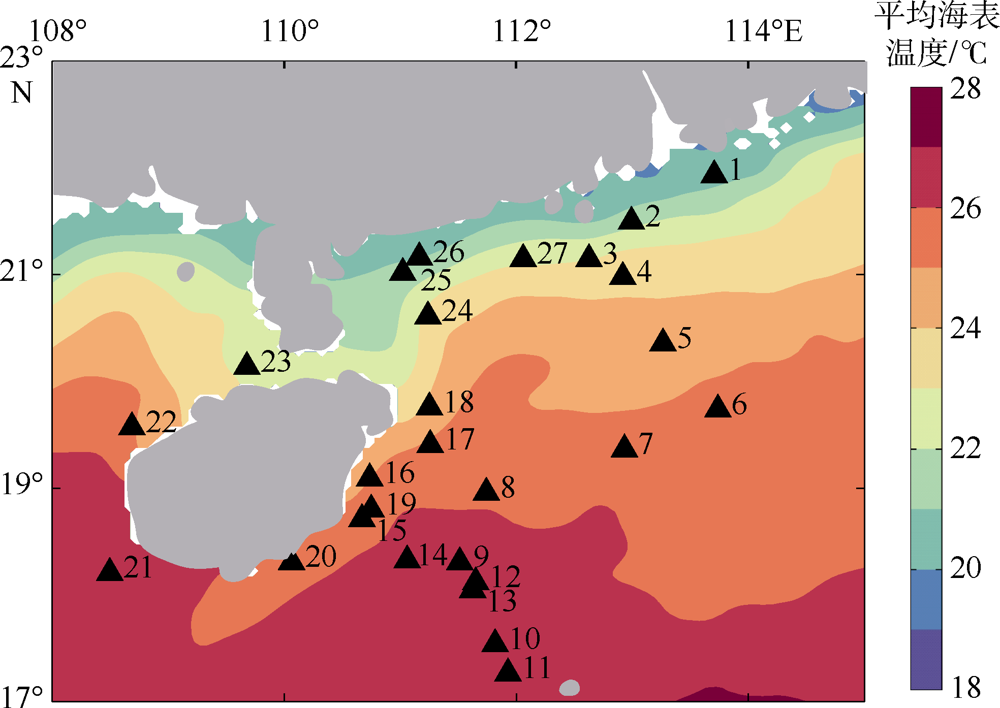
Fig. 1

Fig. 2
Schematic diagram of the basic parameters to describe the characteristics of atmospheric duct. The pink layer is the duct layer, where h0 is the bottom heigh of the duct layer, h1 is the height of trapping layer, and h2 is top height of the duct layer. d0 and ΔM respectively denotes the depth and strength of the duct. A point marks the place where the gradient of M turns into negative, B point marks the place where the gradient of M turns into positive, and C point marks the place where have the same value of M as B point"
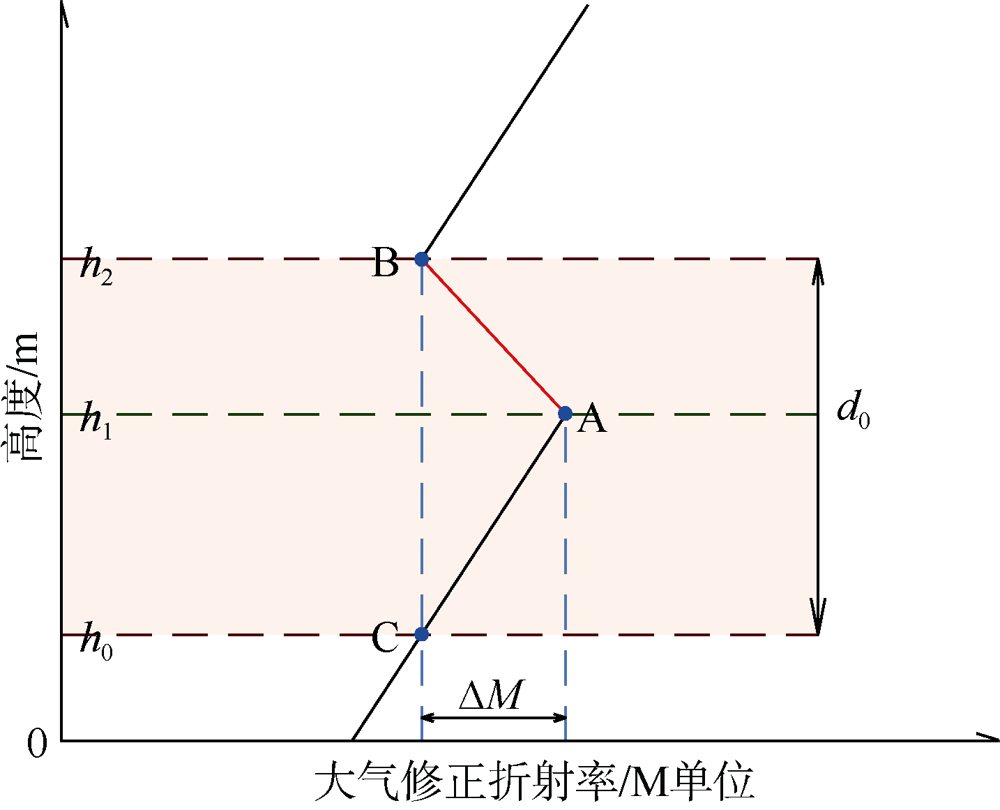
Fig. 2
Fig. 3
Vertical profile of the atmospheric modified refractive index M before (blue lines) and after polynomial fitting and moving average (red lines), the results of sounding No. 2 (a) and No. 17 (b) are shown as examples here"
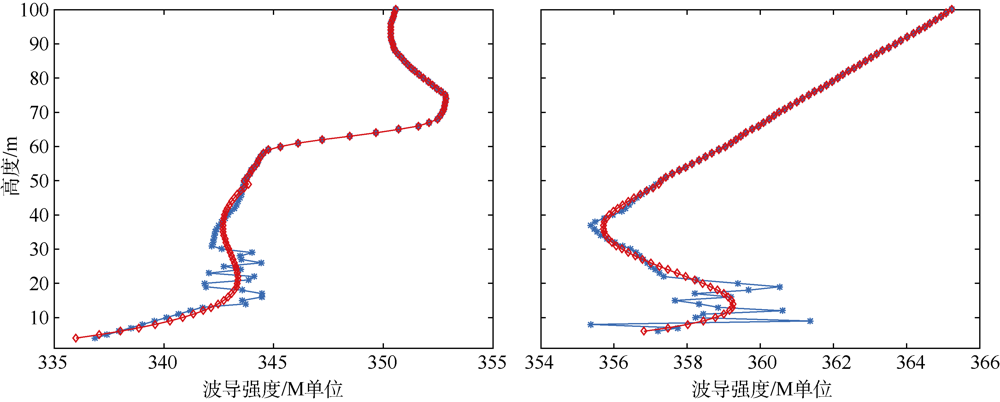
Fig. 3

Fig. 4
(a) The wind speed vector, sea level pressure, and relative humidity observed by the shipboard automatic weather station (AWS) from December 17th to 22nd; (b) The sea surface air temperature from AWS and the water temperature recorded by the SBE-21 sailing thermometer and salinometer installed on the bottom of the ship. The ordinate in Fig. 4a marks the absolute value of the wind vector, and the 0-value line is the tail of the wind vector. The magenta inverted triangle indicates the sounding release point and number"
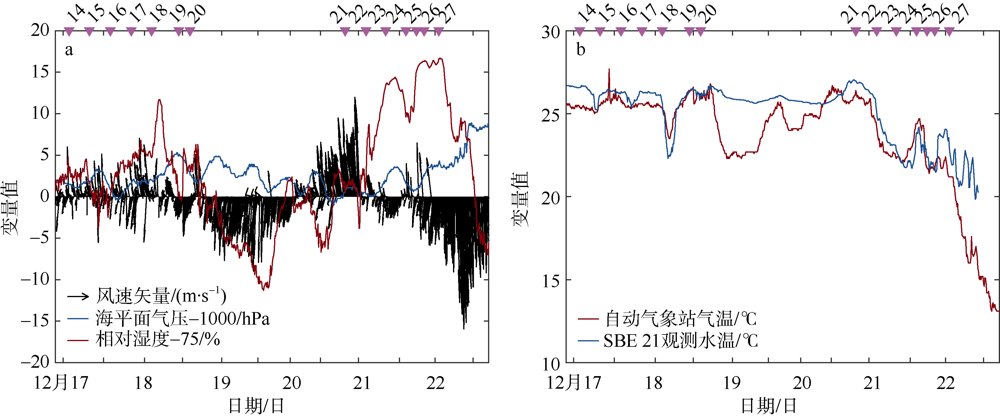
Fig. 4
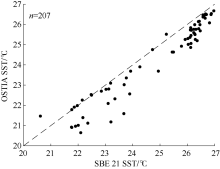
Fig. 5
Comparison of the water temperature recorded by the SBE 21 from December 16th to 22nd and the OSTIA SST. n is the number of samples, which is the sum of the number of SBE 21 observation records closest to the OSTIA grid point in the study area on that day. Dashed line is the linear regression line with a slope of one"

Fig. 5
Tab.1
Information for the northern South China Sea investigation observation from December 13rd to 22nd, 2012, including the GPS sounding observation time, sea surface temperature, and whether the atmospheric ducts were observed"
| 探空编号 | 观测时间 | 海表温度/℃ | 表面/蒸发波导 | 悬空波导 |
|---|---|---|---|---|
| 1 | 13日09时 | 20.45 | √ | |
| 2 | 13日14时 | 21.63 | √ | √ |
| 3 | 13日20时 | 23.02 | ||
| 4 | 14日14时 | 23.71 | √ | |
| 5 | 14日20时 | 24.67 | √ | √ |
| 6 | 15日02时 | 25.57 | √ | |
| 7 | 15日08时 | 25.93 | √ | √ |
| 8 | 15日14时 | 26.35 | √ | √ |
| 9 | 15日20时 | 26.76 | √ | |
| 10 | 16日02时 | 26.66 | √ | |
| 11 | 16日08时 | 26.89 | √ | √ |
| 12 | 16日14时 | 26.47 | √ | √ |
| 13 | 16日20时 | 26.48 | √ | |
| 14 | 17日02时 | 26.38(26.49) | √ | |
| 15 | 17日08时 | 25.71(25.91) | √ | √ |
| 16 | 17日14时 | 25.25(25.74) | √ | |
| 17 | 17日20时 | 25.27(25.81) | √ | |
| 18 | 18日02时 | 24.19(24.99) | √ | √ |
| 19 | 18日11时 | 25.56(25.93) | √ | √ |
| 20 | 18日14时 | 25.49(25.76) | √ | |
| 21 | 20日20时 | 26.67(26.82) | √ | |
| 22 | 21日02时 | 24.97(25.15) | √ | |
| 23 | 21日08时 | 22.65(22.77) | √ | |
| 24 | 21日14时 | 23.14(23.49) | √ | |
| 25 | 21日17时 | 21.23(21.79) | ||
| 26 | 21日20时 | 20.92(21.32) | √ | |
| 27 | 22日01时 | 22.13(22.73) | √ | |
| 合计次数(发生概率) | 17(0.62) | 17(0.62) |
Tab.1
Tab. 2
Characteristics of the surface duct observed during the investigation, and only the atmospheric duct layer with ΔM > 1 M-unit was counted"
| 探空编号 | 观测时间 | 海表温度/℃ | 波底高度/m | 波导厚度/m | 波导强度/M单位 | ||
|---|---|---|---|---|---|---|---|
| 5 | 14日20时 | 24.67 | 28.0 | 17.0* | 2.55 | ||
| 7 | 15日08时 | 25.93 | 23.0 | 12.0* | 3.22 | ||
| 7 | 15日08时 | 25.93 | 44.0 | 22.0 | 2.67 | ||
| 8 | 15日14时 | 26.35 | 23.0 | 15.0* | 12.7 | ||
| 11 | 16日08时 | 26.89 | 23.0 | 23.0* | 2.53 | ||
| 12 | 16日14时 | 26.47 | 25.0 | 23.0* | 4.92 | ||
| 15 | 17日08时 | 25.91 | 28.0 | 30.0* | 4.61 | ||
| 16 | 17日14时 | 25.74 | 29.0 | 29.0* | 7.48 | ||
| 17 | 17日20时 | 25.81 | 26.0 | 18.0* | 3.37 | ||
| 18 | 18日02时 | 24.99 | 26.0 | 18.0* | 1.35 | ||
| 19 | 18日11时 | 25.93 | 23.0 | 17.0 | 2.04 | ||
| 22 | 21日02时 | 25.15 | 35.0 | 10.0* | 4.32 | ||
| 23 | 21日08时 | 22.77 | 13.5 | 22.0 | 5.08 | ||
| 24 | 21日13时 | 23.49 | 39.0 | 21.0 | 5.20 | ||
| 26 | 21日20时 | 21.32 | 7.5 | 18.0 | 3.03 | ||
| 27 | 22日01时 | 22.13 | 23.0 | 26.0 | 1.25 | ||
| 平均值 | 26.0 | >20.06 | 4.15 | ||||
Tab. 2
Tab. 3
Characteristics of the elevated ducts observed during the investigation, and only the waveguide layer with ΔM > 1 M-unit was counted"
| 探空编号 | 观测时间 | 海表温度/℃ | 波底高度/m | 波导厚度/m | 波导强度/M单位 |
|---|---|---|---|---|---|
| 1 | 13日09时 | 20.45 | 1608.70 | 76.30 | 4.06 |
| 2 | 13日14时 | 21.63 | 75.34 | 28.66 | 2.40 |
| 4 | 14日14时 | 23.71 | 1269.41 | 105.59 | 3.19 |
| 6 | 15日02时 | 25.57 | 672.45 | 312.55 | 21.49 |
| 7 | 15日08时 | 25.93 | 474.43 | 275.57 | 10.62 |
| 8 | 15日14时 | 26.35 | 63.10 | 33.90 | 1.19 |
| 8 | 15日14时 | 26.35 | 497.40 | 87.60 | 5.50 |
| 8 | 15日14时 | 26.35 | 706.14 | 288.86* | 15.76 |
| 9 | 15日20时 | 26.76 | 794.75 | 235.25* | 11.50 |
| 9 | 15日20时 | 26.76 | 1314.59 | 115.51 | 8.94 |
| 10 | 16日0时 | 26.66 | 430.20 | 339.80 | 23.11 |
| 11 | 16日08时 | 26.89 | 311.15 | 383.85 | 22.56 |
| 12 | 16日14时 | 26.47 | 514.96 | 455.04 | 32.39 |
| 13 | 16日20时 | 26.48 | 509.21 | 235.79 | 12.80 |
| 14 | 17日02时 | 26.39 | 525.07 | 269.93 | 8.25 |
| 15 | 17日08时 | 25.71 | 953.33 | 161.67 | 10.71 |
| 18 | 18日02时 | 24.19 | 1508.97 | 86.03 | 2.32 |
| 19 | 18日11时 | 25.56 | 1034.52 | 75.48 | 3.84 |
| 20 | 18日14时 | 25.49 | 256.57 | 88.43* | 1.90 |
| 20 | 18日14时 | 25.49 | 1272.41 | 47.59 | 1.87 |
| 平均值 | 739.64 | 185.17 | 10.21 |
Tab. 3
Fig. 6
(a) Vertical profile of the atmospheric modified refractive index M (blue line) and its vertical gradient (black line) observed at 02:00 on December 15th; (b) Vertical profile of the virtual potential temperature gradient (units: K∙m-1); (c) Vertical profile of the virtual potential temperature (minus 290K, black line), temperature (minus 8 ℃, gray line), and specific humidity (units: ×10-3kg∙kg-1, blue line). The red and magenta painted parts on the profiles are the stable elevated duct layer identified by ΔM > 1 M-unit"
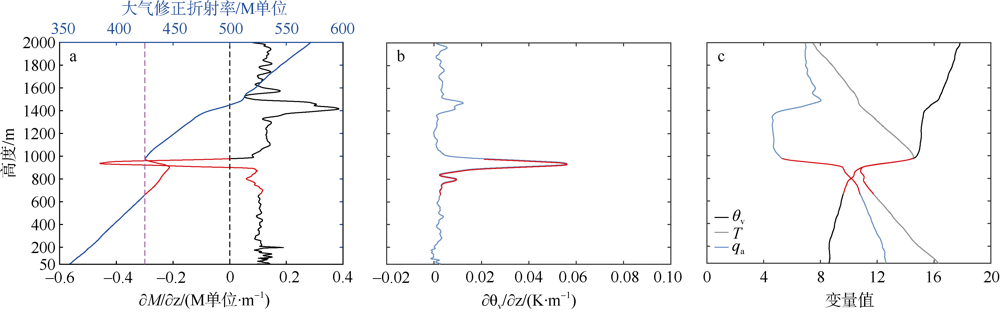
Fig. 6
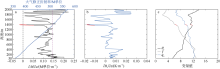
Fig. 7
(a) Vertical profile of the atmospheric modified refractive index M (blue line) and its vertical gradient (black line) observed at 01:00 on December 22nd; (b) Vertical profile of the virtual potential temperature gradient (units: K∙m-1); (c) Vertical profile of the virtual potential temperature (minus 290K, black line), temperature (minus 8 ℃, gray line), and specific humidity (units: ×10-3kg∙kg-1, blue line). The red painted parts on the profiles are the duct layer but ΔM > 1 M-unit"
Fig. 7
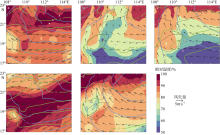
Fig. 8
Daily average weather map of 925 hPa from December 13th to 21st. (a) December 13th; (b) December 15th; (c) December17th; (d) December 19th; (e) December 21st. The coloring is relative humidity, the blue line is the geopotential height, the green line is the temperature, and the gray line is coastline"
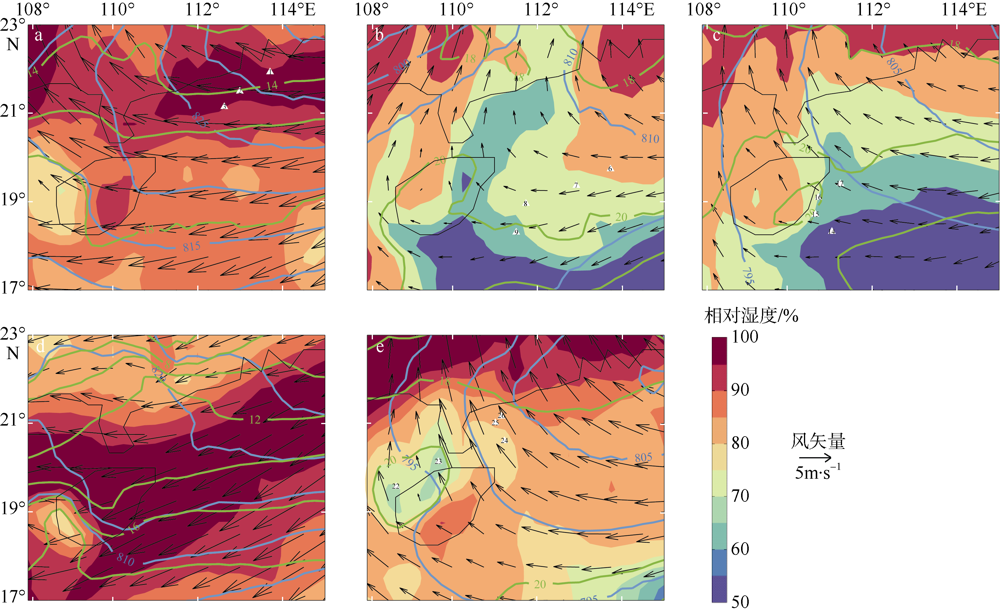
Fig. 8
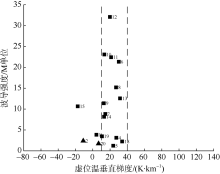
Fig. 9
The strength (ΔM) of the elevated duct layers shown in Tab. 3 (vertical axis) and the average value of the vertical gradient of the virtual potential temperature ($\partial {{\theta }_{\text{v}}}/\partial z$) in the elevated duct layers. The black square represents the elevated ducts with d0 > 50 m, and the black triangle represents the elevated ducts with d0 < 50 m. The right side of the graphic symbol is the sounding number. The gray dashed lines are the value range for 10 K·km–1 < $\partial {{\theta }_{\text{v}}}/\partial z$< 40 K·km–1"

Fig. 9
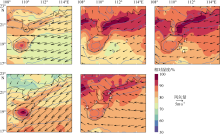
Fig. 10
Daily average weather map of surface from December 13th to 21st. (a) December 13th; (b) December 15th; (c) December 17th; (d) December 19th; (e) December 21st. The coloring is relative humidity, the blue line is the temperature, and the gray line is coastline"

Fig. 10
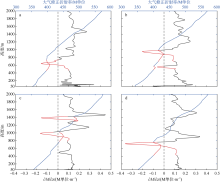
Fig. 11
Vertical profile of the atmospheric modified refractive index M (blue line) and its vertical gradient (black line, after three-points moving average) observed from 08:00 on December 15th to 02:00 on December 16th. The red painted parts on the profiles are the stable elevated duct layer identified by ΔM > 1 M-unit"
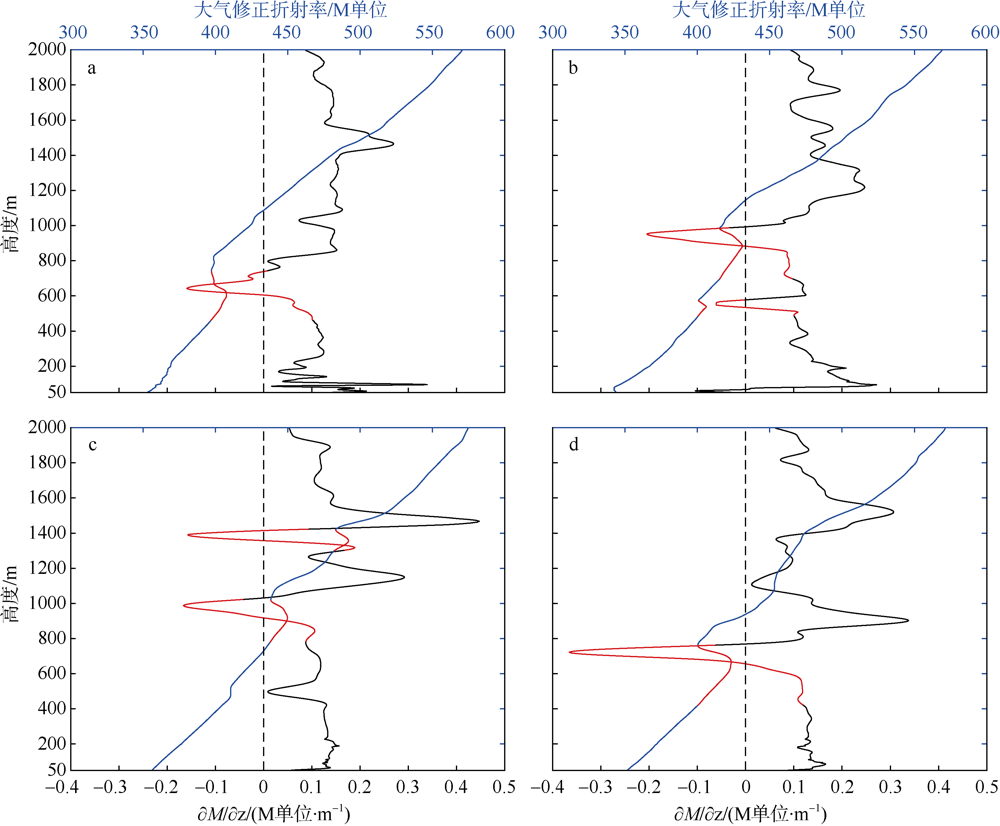
Fig. 11
Figure 12
Vertical profile of the atmospheric modified refractive index M (blue line) and its vertical gradient (black line is no smoothing result and red line is the three-point moving average) observed from 07:00 to 20:00 on December 21st. There is no red painted part on the profiles due to the non-existence of the stable elevated duct layer identified by ΔM > 1 M-unit"
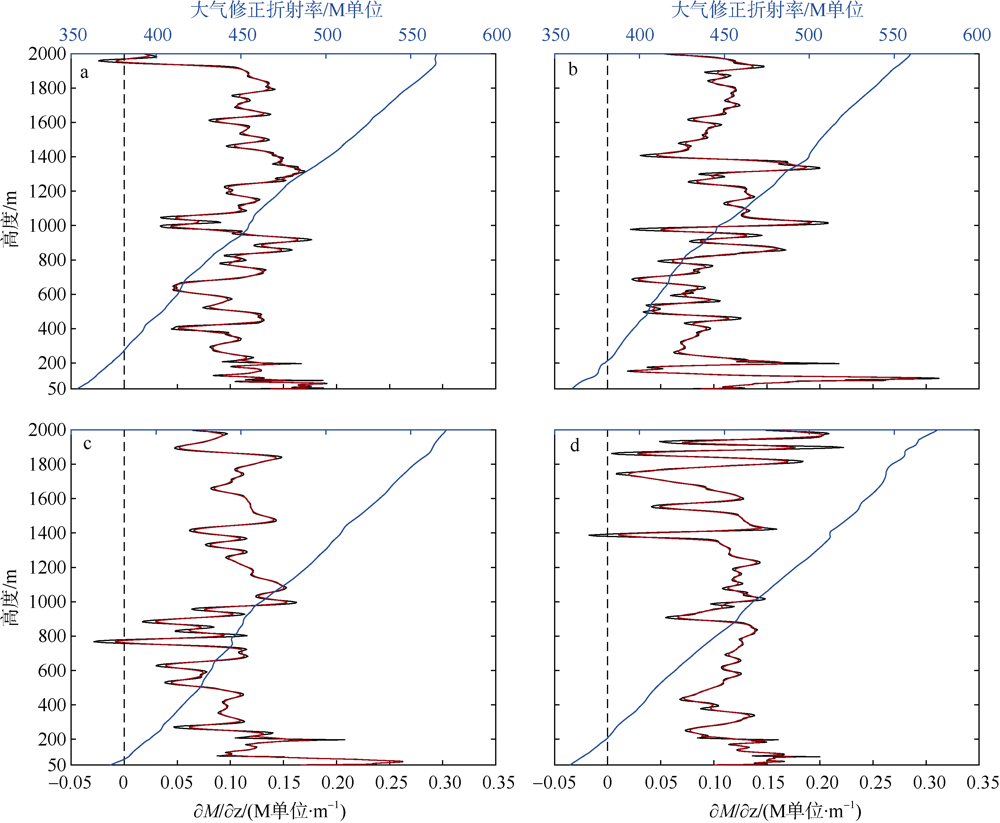
Figure 12
| [1] | 陈莉, 高山红, 康士峰, 等, 2011. 中国近海蒸发波导的数值模拟与预报研究[J]. 中国海洋大学学报, 41(1-2): 1-8. |
| CHEN LI, GAO SHANHONG, KANG SHIFENG, et al, 2011. Numerical modeling and forecasting of evaporation ducts over China Seas[J]. Periodical of Ocean University of China, 41(1-2): 1-8. (in Chinese with English abstract) | |
| [2] | 成印河, 周生启, 王东晓, 等, 2013a. 夏季风爆发对南海南北部低空大气波导的影响[J]. 热带海洋学报, 32(3): 1-8. |
| CHENG YINHE, ZHOU SHENGQI, WANG DONGXIAO, et al, 2013a. Influence of the monsoon onset on the lower atmospheric ducts over the South China Sea[J]. Journal of Tropical Oceanography, 32(3): 1-8. (in Chinese with English abstract) | |
| [3] | 成印河, 周生启, 王东晓, 2013b. 海上大气波导研究进展[J]. 地球科学进展, 28(3): 318-326. |
| CHENG YINHE, ZHOU SHENGQI, WANG DONGXIAO, 2013b. Review of the study of atmospheric ducts over the sea[J]. Advances in Earth Science, 28(3): 318-326. (in Chinese with English abstract) | |
| [4] | 丁菊丽, 费建芳, 黄小刚, 等, 2009. 南海、东海蒸发波导出现规律的对比分析[J]. 电波科学学报, 24(6): 1018-1023. |
| DING JULI, FEI JIANFANG, HUANG XIAOGANG, et al, 2009. Contrast on occurrence of evaporation ducts in the South China Sea and East China Sea area[J]. Chinese Journal of Radio Science, 24(6): 1018-1023. (in Chinese with English abstract) | |
| [5] | 丁轩茹, 管兆勇, 成印河, 等, 2012. 1998年季风试验期间南海蒸发波导特征分析[J]. 热带气象学报, 28(6): 905-910. |
| DING XUANRU, GUAN ZHAOYONG, CHENG YINHE, et al, 2012. Characteristics of Evaporation Duct over the South China Sea during 1998 Summer monsoon[J]. Journal of Tropical Meteorology, 28(6): 905-910. (in Chinese with English abstract) | |
| [6] | 胡晓华, 费建芳, 张翔, 等, 2007. 气象条件对大气波导的影响[J]. 气象科学, 27(3): 349-354. |
| HU XIAOHUA, FEI JIANFANG, ZHANG XIANG, et al, 2007. Effect of Meteorological conditions on atmospheric duct[J]. Scientia Meteorologica Sinica, 27(3): 349-354. (in Chinese with English abstract) | |
| [7] | 胡晓华, 费建芳, 张翔, 等, 2008. 一次大气波导过程的数值模拟[J]. 气象科学, 28(3): 294-300. |
| HU XIAOHUA, FEI JIANFANG, ZHANG XIANG, et al, 2008. Numerical simulation of an atmospheric duct[J]. Scientia Meteorologica Sinica, 28(3): 294-300. (in Chinese with English abstract) | |
| [8] |
黄小龙, 经志友, 郑瑞玺, 等, 2020. 南海西部夏季上升流锋面的次中尺度特征分析[J]. 热带海洋学报, 39(3): 1-9.
doi: 10.11978/2019086 |
|
HUANG XIAOLONG, JING ZHIYOU, ZHENG RUIXI, et al, 2020. Analysis of submesoscale characteristics of summer upwelling fronts in the western South China Sea[J]. Journal of Tropical Oceanography, 39(3): 1-9. (in Chinese with English abstract)
doi: 10.11978/2019086 |
|
| [9] | 康士峰, 张玉生, 王洪光, 2014. 对流层大气波导[M]. 北京: 科学出版社:48-49. |
| KANG SHIFENG, ZHANG YUSHENG, WANG HONGGUANG, 2014. Atmospheric duct in troposphere environment[M]. Beijing: Science Press: 48-49. (in Chinese) | |
| [10] | 蔺发军, 刘成国, 成思, 等, 2005. 海上大气波导的统计分析[J]. 电波科学学报, 20(1): 64-68. |
| LIN FAJUN, LIU CHENGGUO, CHENG SI, et al, 2005. Statistical analysis of marine atmospheric duct[J]. Chinese Journal of Radio Science, 20(1): 64-68. (in Chinese with English abstract) | |
| [11] | 蔺发军, 王红光, 林乐科, 等. 2007. 风向对蒸发波导环境特性影响的研究[J]. 电波科学学报, 22(3): 410-413. |
| LIN FAJUN, WANG HONGGUANG, LIN LEKE, et al, 2007. Influence of wind direction on characteristics of evaporation duct[J]. Chinese Journal of Radio Science, 22(3): 410-413. (in Chinese with English abstract) | |
| [12] | 刘成国, 潘中伟, 郭丽, 1996. 中国低空大气波导出现概率和波导特征量的统计分析[J]. 电波科学学报, 11(2): 60-66. |
| LIU CHENGGUO, PAN ZHONGWEI, GUO LI, 1996. Statistical analysis of occurrence and characteristics of atmospheric ducts in China[J]. Chinese Journal of Radio Science, 11(2): 60-66. (in Chinese with English abstract) | |
| [13] |
邱春华, 崔永生, 胡诗琪, 等, 2017. 基于融合遥感数据的广东沿岸温度锋面的季节变化研究[J]. 热带海洋学报, 36(5): 16-23.
doi: 10.11978/2016125 |
|
QIU CHUNHUA, CUI YONGSHENG, HU SHIQI, et al, 2017. Seasonal variation of Guangdong coastal thermal front based on merged satellite data[J]. Journal of Tropical Oceanography, 36(5): 16-23. (in Chinese with English abstract)
doi: 10.11978/2016125 |
|
| [14] | BEAN B R, DUTTON E J, 1968. Radio meteorology[M]. New York: Dover Publications. |
| [15] |
COOK J, 1991. A sensitivity study of weather data inaccuracies on evaporation duct height algorithms[J]. Radio Science, 26(3): 731-746.
doi: 10.1029/91RS00835 |
| [16] |
DONLON C J, MARTIN M, STARK J, et al, 2012. The Operational Sea Surface Temperature and Sea Ice Analysis (OSTIA) system[J]. Remote Sensing of Environment, 116: 140-158.
doi: 10.1016/j.rse.2010.10.017 |
| [17] |
MURPHY D M, KOOP T, 2005. Review of the vapour pressures of ice and supercooled water for atmospheric applications[J]. Quarterly Journal of the Royal Meteorological Society, 131(608): 1539-1565.
doi: 10.1256/qj.04.94 |
| [18] | SHI RUI, GUO XINYU, WANG DONGXIAO, et al, 2015. Seasonal variability in coastal fronts and its influence on sea surface wind in the northern South China Sea[J]. Deep Sea Research Part Ⅱ: Topical Studies in Oceanography, 119: 30-39. |
| [19] | TURTON J D, BENNETTS D A, FARMER S F G, 1988. An introduction to radio ducting[J]. Meteorological Magazine, 117(1393): 245-254. |
| [20] |
XIE JIPING, ZHU JIANG, LI YAN, 2008. Assessment and inter-comparison of five high-resolution sea surface temperature products in the shelf and coastal seas around China[J]. Continental Shelf Research, 28(10-11): 1286-1293.
doi: 10.1016/j.csr.2008.02.020 |
| [21] |
ZENG XUBIN, BRUNKE M A, ZHOU MINGYU, et al, 2004. Marine atmospheric boundary layer height over the eastern Pacific: data analysis and model evaluation[J]. Journal of Climate, 17(21): 4159-4170.
doi: 10.1175/JCLI3190.1 |
| [22] |
ZHAO XIAOFENG, WANG DONGXIAO, HUANG SIXUN, et al, 2013. Statistical estimations of atmospheric duct over the South China Sea and the tropical eastern Indian Ocean[J]. Chinese Science Bulletin, 58(23): 2794-2797.
doi: 10.1007/s11434-013-5942-8 |
| [1] | XU Chao, LONG Lijuan, LI Sha, YUAN Li, XU Xiaolu. Systematic reorganization of historical data of scientific investigation in the South China Sea and its affiliated islands and reefs 3. data sharing service and application [J]. Journal of Tropical Oceanography, 2024, 43(5): 158-165. |
| [2] | XU Chao, LONG Lijuan, LI Sha, HE Yunkai, YUAN Li, XU Xiaolu. Systematic reorganization of historical data of scientific investigation in the South China Sea and its affiliated islands and reefs 1. data reorganization technology and application [J]. Journal of Tropical Oceanography, 2024, 43(5): 143-149. |
| [3] | XU Chao, LONG Lijuan, LI Sha, XU Xiaolu, YUAN Li. Systematic reorganization of historical data of scientific investigation in the South China Sea and its affiliated islands and reefs 2. data curation and application [J]. Journal of Tropical Oceanography, 2024, 43(5): 150-157. |
| [4] | LIU Yuan, KE Zhixin, LI Kaizhi, TAN Yehui, LIANG Junce, ZHOU Weihua. Zooplankton community in the coastal waters of eastern Guangdong under the influence of human activities and ocean currents [J]. Journal of Tropical Oceanography, 2024, 43(4): 98-111. |
| [5] | LIU Didi, ZHANG Xiyang, SUN Fulin, WANG Mingzhuang, TAN Fei, SHI Qi, WANG Guan, YANG Hongqiang. Microbial communities and specific strains within beachrocks of the South China Sea: implications for the origin of beachrock* [J]. Journal of Tropical Oceanography, 2024, 43(4): 112-122. |
| [6] | JIANG Lyumiao, CHEN Tianran, ZHAO Kuan, ZHANG Ting, XU Lijia. Experimental study on bioerosion of marginal reefs in the Weizhou Island, northern South China Sea [J]. Journal of Tropical Oceanography, 2024, 43(3): 155-165. |
| [7] | XU Lijia, LIAO Zhiheng, CHEN Hui, WANG Yongzhi, HUANG Baiqiang, LIN Qiaoyun, GAN Jianfeng, YANG Jing. Community structure of scleractinian corals in the northern South China Sea and their responses to the marine heatwaves [J]. Journal of Tropical Oceanography, 2024, 43(3): 58-71. |
| [8] | ZHAO Minghui, YUAN Ye, ZHANG Jiazheng, ZHANG Cuimei, GAO Jinwei, WANG Qiang, SUN Zhen, CHENG Jinhui. New developments on the rift-breakup of the continent-ocean transition zone in the northern margin of the South China Sea [J]. Journal of Tropical Oceanography, 2024, 43(2): 173-183. |
| [9] | HUANG Yu, WANG Lin, MAI Zhimao, LI Jie, ZHANG Si. Isolation and characterization of sand fixation ability of bacteria in biological soil crusts of the tropical islands, South China Sea [J]. Journal of Tropical Oceanography, 2023, 42(6): 101-110. |
| [10] | WANG Chenyan, SHI Jingwen, YAN Annan, KANG Yaru, WANG Yuxuan, QIN Suli, HAN Minwei, ZHANG Ruijie, YU Kefu. Bioaccumulation characteristics and source apportionment of organophosphate esters in Acanthaster planci from the South China Sea [J]. Journal of Tropical Oceanography, 2023, 42(5): 30-37. |
| [11] | LI Niu, DI Pengfei, FENG Dong, CHEN Duofu. The impact of cold seepage on geochemical indices for redox conditions of marine sediments ―Site F active seep site in the northeastern South China Sea* [J]. Journal of Tropical Oceanography, 2023, 42(5): 144-153. |
| [12] | ZHANG Zhisheng, XIE Lingling, LI Junyi, LI Qiang. Comparative analysis of mesoscale eddy evolution during life cycle in marginal sea and open ocean: South China Sea and Kuroshio Extension [J]. Journal of Tropical Oceanography, 2023, 42(4): 63-76. |
| [13] | YANG Lei, WEN Jinhui, WANG Qiang, LUO Xi, HUANG Huaming, HE Yunkai, CHEN Ju. Recent research progress in the influence of tropical cyclones on the Luzon Strait transport* [J]. Journal of Tropical Oceanography, 2023, 42(3): 40-51. |
| [14] | ZHAO Zhongxian, SUN Zhen, MAO Yunhua, ZHANG Huodai. Heterogeneous extension and pulsed tectonic subsidence in the northern South China Sea margin* [J]. Journal of Tropical Oceanography, 2023, 42(3): 96-115. |
| [15] | LIU Qinyan, LI Wenlian, SHI Rui, CHEN Ju, LI Chunhui, XIE Qiang. The characteristics of eddy in western boundary current of South China Sea and its relationship with winter circulation [J]. Journal of Tropical Oceanography, 2023, 42(3): 52-66. |
|
||