
Journal of Tropical Oceanography ›› 2018, Vol. 37 ›› Issue (5): 86-97.doi: 10.11978/2017113CSTR: 32234.14.2017113
• Orginal Article • Previous Articles Next Articles
Bottom water temperature measurements in the South China Sea, eastern Indian Ocean and western Pacific Ocean*
Xiaoqiu YANG1( ), Xiaobin SHI1, Junfeng ZHAO1, Chuanhai YU1,2, Hongfang GAO3, Aihua CHEN3, Yuanzheng LU4, Xianrong CEN4, Weiren LIN5, Xin ZENG1, Hehua XU1, Ziqiang REN1,2, Shengqi ZHOU4, Ziying XU3, Jinlong SUN1, Nana KAMIYA5, Jian LIN1
- 1. CAS Key Laboratory of Ocean and Marginal Sea Geology, South China Sea Institute of Oceanology, Guangzhou 510301, China 2. University of Chinese Academy of Sciences, Beijing 100049, China
3. Key Laboratory of Marine Mineral Resources, Ministry of Land and Resources, Guangzhou Marine Geological Survey, Guangzhou 510075, China
4. State Key Laboratory of Tropical Oceanography, South China Sea Institute of Oceanology, Chinese Academy of Sciences, Guangzhou 510301, China
5. Graduate School of Engineering, Kyoto University, Kyoto 615-8540, Japan
-
Received:2017-10-20Revised:2018-02-27Online:2018-09-20Published:2018-10-13 -
Supported by:Instrument Developing Project of the Chinese Academy of Sciences (YZ201136);National Natural Science Foundation of China (41106086, 41474065, 41376059, 41376061, 91428205, 41576036, 41076028, 41476167, and 41606080);Chinese Academy of Sciences Scholarship, the Strategic Priority Research Program of the Chinese Academy of Sciences (XDA11040303, XDA13010104 and XDA11030301);National High Technology Research and Development Program of China (“863” Program) (2006AA07A203 and 2009AA09A201-05);China Geological Survey Program (1212011220117);Open Project of Key Laboratory of Submarine Geosciences, State Oceanic Administration (KLSG1502);and Mariana Trench Project of the Chinese Academy of Sciences (Y4SL021001).
CLC Number:
- P733.41
Cite this article
Xiaoqiu YANG, Xiaobin SHI, Junfeng ZHAO, Chuanhai YU, Hongfang GAO, Aihua CHEN, Yuanzheng LU, Xianrong CEN, Weiren LIN, Xin ZENG, Hehua XU, Ziqiang REN, Shengqi ZHOU, Ziying XU, Jinlong SUN, Nana KAMIYA, Jian LIN. Bottom water temperature measurements in the South China Sea, eastern Indian Ocean and western Pacific Ocean*[J].Journal of Tropical Oceanography, 2018, 37(5): 86-97.
share this article
Add to citation manager EndNote|Reference Manager|ProCite|BibTeX|RefWorks
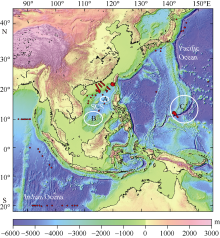
Fig. 1
Distribution of BWT stations in the South China Sea, eastern Indian Ocean and western Pacific Ocean. Parts of BWT stations located in areas A, B and C are not shown because their location information is still not released to the public according the Data Management Policy"

Fig. 1

Fig. 2
(a) BWT verses water depth (Z) in the South China Sea (SCS; red circle), eastern Indian Ocean (EIO; blue diamond) and western Pacific Ocean (WPO; green triangle). The red and green solid lines are the fitted BWT curves shown in Eq. (1) and Eq. (2), respectively. (b) is an enlarged figure for BWT < 6°C. (c) shows the relationships between BWT and water pressure (P) in the EIO and WPO for water depth deeper than 4800 m"
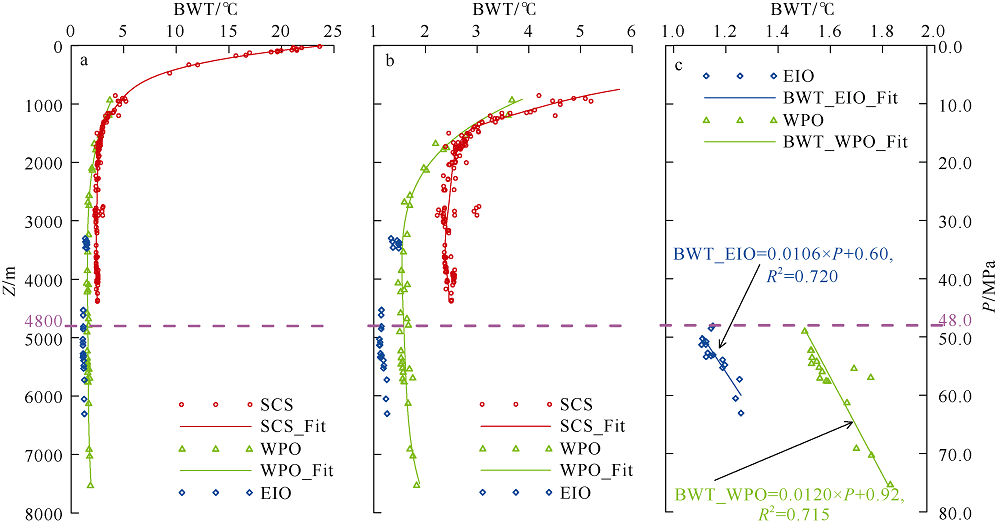
Fig. 2
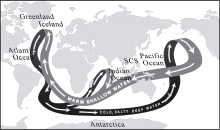
Fig. 3
The model of the great ocean conveyor belt. Modified from Broecker (2010)"
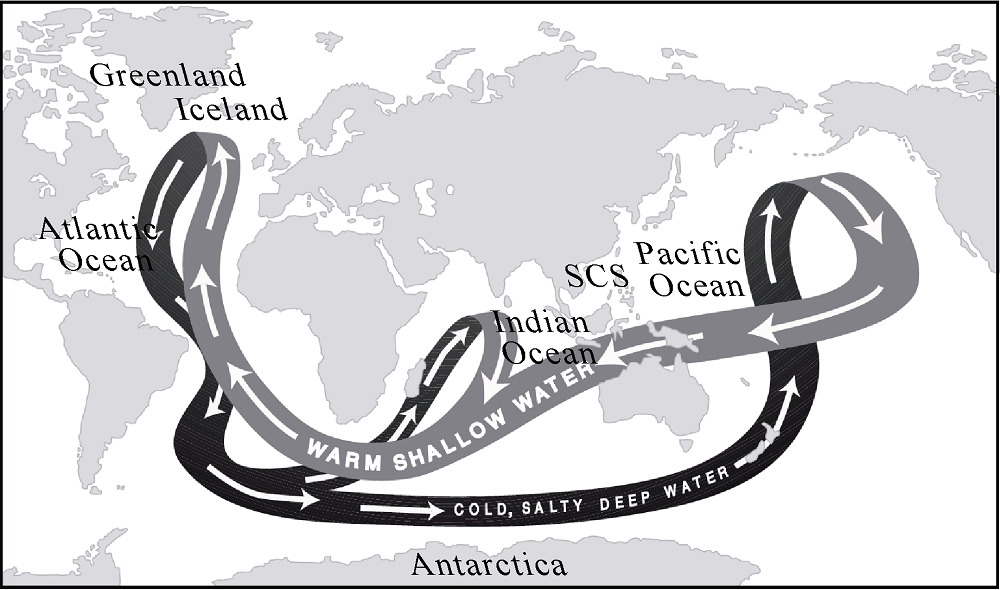
Fig. 3
Tab. 1
Estimate of β of bottom water in the eastern Indian Ocean and western Pacific Ocean"
| No. | T0/°C | T0/K | P/MPa | S/‰ | αv×10-6 /°C-1 | ρ×103 /(kg·m-3) | cp×103 /(J·kg-1·°C-1) | (ρcp) /(MJ·m-3·°C-1) | β=(∂T/∂P)s /(°C·MPa-1) | Sea Area |
|---|---|---|---|---|---|---|---|---|---|---|
| 1 | 1.200 | 274.350 | 48.0 | 34.698 | 179.9 | 1.049 | 3.861 | 4.051 | 0.0122 | EIO |
| 2 | 1.200 | 274.350 | 50.0 | 34.698 | 183.9 | 1.050 | 3.857 | 4.050 | 0.0125 | EIO |
| 3 | 1.200 | 274.350 | 60.0 | 34.698 | 203.1 | 1.054 | 3.838 | 4.046 | 0.0138 | EIO |
| 4 | 1.200 | 274.350 | 70.0 | 34.698 | 221.1 | 1.058 | 3.821 | 4.044 | 0.0150 | EIO |
| 5 | 1.200 | 274.350 | 80.0 | 34.698 | 237.9 | 1.062 | 3.805 | 4.043 | 0.0161 | EIO |
| 6 | 1.665 | 274.815 | 48.0 | 34.698 | 183.5 | 1.049 | 3.863 | 4.053 | 0.0124 | WPO |
| 7 | 1.665 | 274.815 | 50.0 | 34.698 | 187.4 | 1.050 | 3.859 | 4.052 | 0.0127 | WPO |
| 8 | 1.665 | 274.815 | 60.0 | 34.698 | 206.3 | 1.054 | 3.840 | 4.048 | 0.0140 | WPO |
| 9 | 1.665 | 274.815 | 70.0 | 34.698 | 224.0 | 1.058 | 3.823 | 4.046 | 0.0152 | WPO |
| 10 | 1.665 | 274.815 | 80.0 | 34.698 | 240.5 | 1.062 | 3.807 | 4.045 | 0.0163 | WPO |
Tab. 1

Fig. 4
Relationships between BWT and water depth in the SCS in this study (red solid curve) and the previous work (blue solid curve). The red circles are the BWT data in this study. The BWT ranges from 0 to 30°C (a) and 0 to 6°C (b), respectively"
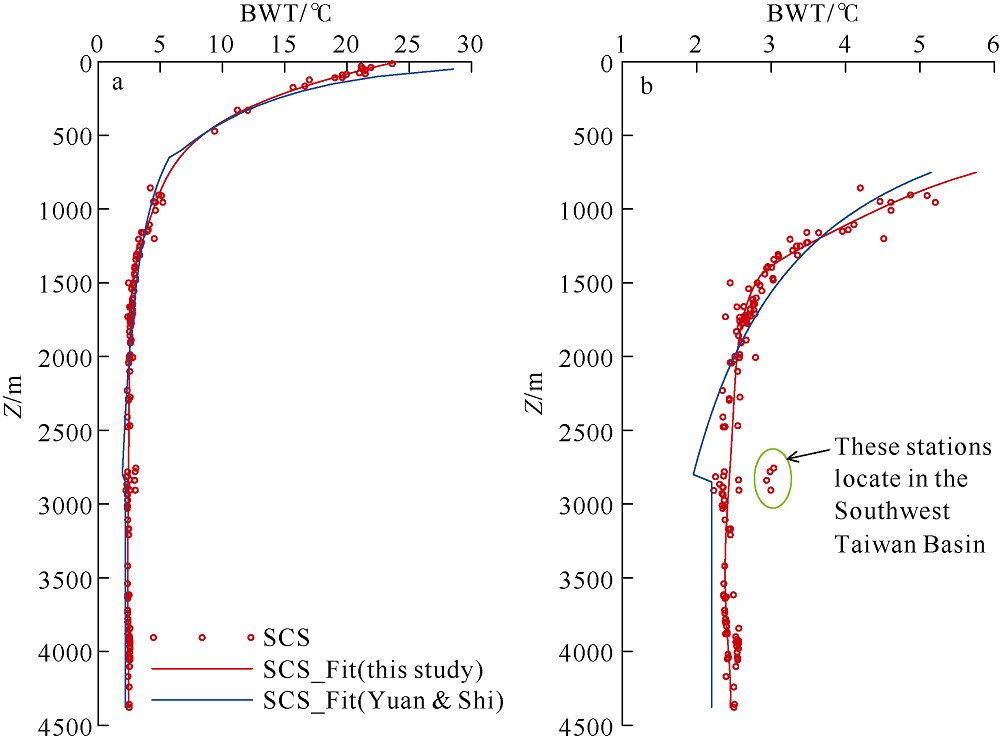
Fig. 4
Appendix 1
The detailed information of the bottom water temperature (BWT) stations"
| No. | Station | Longitude | Latitude | Water Depth /m | BWT /°C | Method | Sea Area | Measurement Time/(Year. Month) | Cruise or Reference |
|---|---|---|---|---|---|---|---|---|---|
| 1 | SCS2010HF-Test03 | 110°57′48″E | 18°4′11″N | 1158 | 3.479 | HF Probe | SCS | 2010.03 | (1) |
| 2 | SCS2010HF01 | 117°58′22″E | 21°0′2″N | 1440 | 2.916 | HF Probe | SCS | 2010.08-09 | (1) |
| 3 | SCS2010HF02 | 118°11′27″E | 20°47′44″N | 2230 | 2.347 | HF Probe | SCS | 2010.08-09 | (1) |
| 4 | SCS2010HF03 | 118°22′21″E | 20°33′48″N | 2410 | 2.353 | HF Probe | SCS | 2010.08-09 | (1) |
| 5 | SCS2010HF04 | 118°36′1″E | 20°23′46″N | 2810 | 2.362 | HF Probe | SCS | 2010.08-09 | (1) |
| 6 | SCS2010HF05 | 118°51′24″E | 20°12′20″N | 2866 | 2.309 | HF Probe | SCS | 2010.08-09 | (1) |
| 7 | SCS2012HF01 | 114°46′47″E | 19°38′20″N | 1516 | 2.850 | HF Probe | SCS | 2012.09 | (2) |
| 8 | SCS2013-OBS05 | 111°26′58″E | 16°15′43″N | 856 | 4.198 | OBS | SCS | 2013.05-06 | (3) |
| 9 | SCS2013-OBS10 | 112°15′42″E | 17°25′57″N | 1204 | 3.255 | OBS | SCS | 2013.05-06 | (3) |
| 10 | SCS2014-OBS30 | 117°35′41″E | 19°52′16″N | 2815 | 2.254 | OBS | SCS | 2014.05-06 | (4) |
| 11 | SCS2014-OBS33 | 117°49′22″E | 19°22′47″N | 3616 | 2.494 | OBS | SCS | 2014.05-06 | (4) |
| 12 | SCS2014-OBS36 | 118°0′51″E | 19°39′3″N | 3168 | 2.454 | OBS | SCS | 2014.05-06 | (4) |
| 13 | SCS2015-Test01 | 115°41′12″E | 22°44′42″N | 14 | 23.636 | SBC | SCS | 2015.06-07 | (5) |
| 14 | SCS2015CTD-01 | 115°48′22″E | 22°29′50″N | 31 | 21.141 | CTD | SCS | 2015.06-07 | (5) |
| 15 | SCS2015CTD-02 | 116°9′56″E | 22°14′59″N | 47 | 21.165 | CTD | SCS | 2015.06-07 | (5) |
| 16 | SCS2015CTD-03 | 116°30′3″E | 21°59′58″N | 86 | 19.961 | CTD | SCS | 2015.06-07 | (5) |
| 17 | SCS2015CTD-04 | 116°45′10″E | 21°45′20″N | 165 | 16.618 | CTD | SCS | 2015.06-07 | (5) |
| 18 | SCS2015CTD-05 | 116°59′42″E | 21°29′46″N | 328 | 11.193 | CTD | SCS | 2015.06-07 | (5) |
| 19 | SCS2015CTD-06 | 115°59′37″E | 20°59′53″N | 330 | 12.025 | CTD | SCS | 2015.06-07 | (5) |
| 20 | SCS2015CTD-07 | 115°45′28″E | 21°14′22″N | 123 | 16.974 | CTD | SCS | 2015.06-07 | (5) |
| 21 | SCS2015CTD-08 | 115°30′10″E | 21°30′6″N | 109 | 19.027 | CTD | SCS | 2015.06-07 | (5) |
| 22 | SCS2015CTD-09 | 115°14′53″E | 21°45′2″N | 90 | 19.619 | CTD | SCS | 2015.06-07 | (5) |
| 23 | SCS2015CTD-10 | 115°0′11″E | 22°0′11″N | 59 | 21.465 | CTD | SCS | 2015.06-07 | (5) |
| 24 | SCS2015CTD-11 | 114°3′36″E | 21°45′48″N | 39 | 21.925 | CTD | SCS | 2015.06-07 | (5) |
| 25 | SCS2015CTD-12 | 114°12′1″E | 21°31′12″N | 55 | 21.448 | CTD | SCS | 2015.06-07 | (5) |
| 26 | SCS2015CTD-13 | 114°22′39″E | 21°12′35″N | 76 | 20.997 | CTD | SCS | 2015.06-07 | (5) |
| 27 | SCS2015CTD-14 | 114°33′6″E | 20°53′53″N | 82 | 21.471 | CTD | SCS | 2015.06-07 | (5) |
| 28 | SCS2015CTD-15 | 114°44′1″E | 20°35′57″N | 108 | 19.624 | CTD | SCS | 2015.06-07 | (5) |
| 29 | SCS2015CTD-16 | 114°55′6″E | 20°18′0″N | 174 | 15.669 | CTD | SCS | 2015.06-07 | (5) |
| 30 | SCS2015CTD-17 | 114°44′1″E | 20°35′57″N | 1008 | 4.610 | CTD | SCS | 2015.06-07 | (5) |
| 31 | SCS2015CTD-17-3 | 115°6′43″E | 20°0′4″N | 904 | 4.872 | CTD | SCS | 2015.06-07 | (5) |
| 32 | SCS2015HF-01(CTD) | 114°58′5″E | 19°41′57″N | 1612 | 2.755 | CTD | SCS | 2015.06-07 | (5) |
| 33 | SCS2015HF-02(CTD) | 115°5′11″E | 19°30′25″N | 1734 | 2.577 | CTD | SCS | 2015.06-07 | (5) |
| 34 | SCS2015HF-01 | 114°58′36″E | 19°41′48″N | 1636 | 2.763 | HF Probe | SCS | 2015.06-07 | (5) |
| 35 | SCS2015HF-02 | 115°6′1″E | 19°29′55″N | 1758 | 2.578 | HF Probe | SCS | 2015.06-07 | (5) |
| 36 | SCS2015HF-03-1 | 115°13′52″E | 19°18′5″N | 1859 | 2.565 | HF Probe | SCS | 2015.06-07 | (5) |
| 37 | SCS2015HF-04 | 115°20′27″E | 19°6′30″N | 2296 | 2.436 | HF Probe | SCS | 2015.06-07 | (5) |
| 38 | SCS2015HF-05 | 115°16′52″E | 19°13′59″N | 2019 | 2.513 | HF Probe | SCS | 2015.06-07 | (5) |
| 39 | SCS2015HF-06 | 115°10′29″E | 19°23′24″N | 1775 | 2.607 | HF Probe | SCS | 2015.06-07 | (5) |
| 40 | SCS2015HF-07 | 115°2′37″E | 19°35′30″N | 1775 | 2.678 | HF Probe | SCS | 2015.06-07 | (5) |
| 41 | SCS2015HF-08 | 114°54′53″E | 19°47′43″N | 1140 | 4.034 | HF Probe | SCS | 2015.06-07 | (5) |
| 42 | SCS2015-ST01 | 111°20′28″E | 15°27′30″N | 1105 | 4.113 | ST | SCS | 2015.07-2016.10 | (5, |
| 43 | SCS2016CTD-A20 | 114°9′46″E | 19°55′10″N | 472 | 9.370 | CTD | SCS | 2016.09 | (7) |
| 44 | SCS2016CTD-A21 | 114°20′42″E | 19°35′57″N | 954 | 5.206 | CTD | SCS | 2016.09 | (7) |
| 45 | SCS2016HF-01 | 115°4′45″E | 19°45′30″N | 1653 | 2.756 | HF Probe | SCS | 2016.09 | (7) |
| 46 | SCS2016HF-02 | 115°9′26″E | 19°38′9″N | 1907 | 2.597 | HF Probe | SCS | 2016.09 | (7) |
| 47 | SCS2016HF-03 | 115°12′1″E | 19°32′9″N | 1998 | 2.513 | HF Probe | SCS | 2016.09 | (7) |
| 48 | SCS2016HF-04 | 115°16′11″E | 19°26′26″N | 2044 | 2.472 | HF Probe | SCS | 2016.09 | (7) |
| 49 | SCS2016HF-06 | 115°28′37″E | 19°33′19″N | 2285 | 2.439 | HF Probe | SCS | 2016.09 | (7) |
| 50 | SCS2016HF-07 | 115°22′27″E | 19°43′15″N | 1900 | 2.602 | HF Probe | SCS | 2016.09 | (7) |
| 51 | SCS2016HF-08 | 114°55′24″E | 19°44′59″N | 1395 | 3.008 | HF Probe | SCS | 2016.09 | (7) |
| 52 | SCS2016HF-09 | 114°59′15″E | 19°39′30″N | 1679 | 2.720 | HF Probe | SCS | 2016.09 | (7) |
| 53 | SCS2016HF-10 | 115°4′24″E | 19°35′3″N | 1738 | 2.651 | HF Probe | SCS | 2016.09 | (7) |
| 54 | SCS2016HF-11 | 115°6′32″E | 19°27′46″N | 1728 | 2.638 | HF Probe | SCS | 2016.09 | (7) |
| 55 | SCS2016HF-12 | 115°9′8″E | 19°19′46″N | 1718 | 2.658 | HF Probe | SCS | 2016.09 | (7) |
| 56 | 617sy | 113°55′12″E | 18°10′48″N | 2974 | 2.371 | HF Probe | SCS | 2008.06 | (8) |
| 57 | 621sy-1 | 112°51′36″E | 18°10′12″N | 2476 | 2.374 | HF Probe | SCS | 2008.06 | (8) |
| 58 | 621sy-2 | 112°51′36″E | 18°10′12″N | 2476 | 2.382 | HF Probe | SCS | 2008.06 | (8) |
| 59 | HF2-1 | 115°7′15″E | 19°56′25″N | 1225 | 3.490 | HF Probe | SCS | 2009.08-09 | (9) |
| 60 | HF2-2 | 115°8′13″E | 19°54′30″N | 1160 | 3.639 | HF Probe | SCS | 2009.08-09 | (9) |
| 61 | HF2-3 | 115°8′44″E | 19°52′55″N | 1200 | 4.512 | HF Probe | SCS | 2009.08-09 | (9) |
| 62 | HF2-4 | 115°10′12″E | 19°51′29″N | 1250 | 3.390 | HF Probe | SCS | 2009.08-09 | (9) |
| 63 | HF2-5 | 115°10′53″E | 19°50′10″N | 1400 | 2.941 | HF Probe | SCS | 2009.08-09 | (9) |
| 64 | HF2-6 | 115°11′46″E | 19°48′35″N | 1540 | 2.700 | HF Probe | SCS | 2009.08-09 | (9) |
| 65 | HF5-1 | 115°11′33″E | 19°54′18″N | 1250 | 3.342 | HF Probe | SCS | 2009.08-09 | (9) |
| 66 | HF5-2 | 115°12′9″E | 19°53′20″N | 1280 | 3.290 | HF Probe | SCS | 2009.08-09 | (9) |
| 67 | HF5-3 | 115°13′22″E | 19°51′30″N | 1320 | 3.101 | HF Probe | SCS | 2009.08-09 | (9) |
| 68 | HF5-4 | 115°14′8″E | 19°50′17″N | 1390 | 2.958 | HF Probe | SCS | 2009.08-09 | (9) |
| 69 | HF5-5 | 115°14′59″E | 19°49′3″N | 1500 | 2.814 | HF Probe | SCS | 2009.08-09 | (9) |
| 70 | HF5-6 | 115°16′2″E | 19°47′31″N | 1682 | 2.768 | HF Probe | SCS | 2009.08-09 | (9) |
| 71 | Hf0910 | 115°20′60″E | 19°25′48″N | 1500 | 2.450 | HF Probe | SCS | 2009.08-09 | (9) |
| 72 | ZS01 | - | - | 1150 | 3.959 | HF Probe | SCS | 2009.08-09 | (9)* |
| 73 | ZS02 | - | - | 1830 | 2.534 | HF Probe | SCS | 2009.08-09 | (9)* |
| 74 | ZS03 | - | - | 2040 | 2.452 | HF Probe | SCS | 2009.08-09 | (9)* |
| 75 | ZS04 | - | - | 2930 | 2.341 | HF Probe | SCS | 2009.08-09 | (9)* |
| 76 | ZS05 | - | - | 2938 | 2.356 | HF Probe | SCS | 2009.08-09 | (9)* |
| 77 | ZS06 | - | - | 3010 | 2.344 | HF Probe | SCS | 2009.08-09 | (9)* |
| 78 | ZS07 | - | - | 3030 | 2.350 | HF Probe | SCS | 2009.08-09 | (9)* |
| 79 | ZS08 | - | - | 3170 | 2.427 | HF Probe | SCS | 2009.08-09 | (9)* |
| 80 | ZS09 | - | - | 3420 | 2.377 | HF Probe | SCS | 2009.08-09 | (9)* |
| 81 | ZS10 | - | - | 3540 | 2.365 | HF Probe | SCS | 2009.08-09 | (9)* |
| 82 | ZS11 | - | - | 3616 | 2.362 | HF Probe | SCS | 2009.08-09 | (9)* |
| 83 | ZS12 | - | - | 3623 | 2.363 | HF Probe | SCS | 2009.08-09 | (9)* |
| 84 | ZS13 | - | - | 3630 | 2.400 | HF Probe | SCS | 2009.08-09 | (9)* |
| 85 | ZS14 | - | - | 3640 | 2.382 | HF Probe | SCS | 2009.08-09 | (9)* |
| 86 | ZS15 | - | - | 3720 | 2.375 | HF Probe | SCS | 2009.08-09 | (9)* |
| 87 | ZS16 | - | - | 3740 | 2.378 | HF Probe | SCS | 2009.08-09 | (9)* |
| 88 | ZS17 | - | - | 3780 | 2.389 | HF Probe | SCS | 2009.08-09 | (9)* |
| 89 | ZS18 | - | - | 3800 | 2.402 | HF Probe | SCS | 2009.08-09 | (9)* |
| 90 | ZS19 | - | - | 3802 | 2.383 | HF Probe | SCS | 2009.08-09 | (9)* |
| 91 | ZS20 | - | - | 3843 | 2.566 | HF Probe | SCS | 2009.08-09 | (9)* |
| 92 | ZS21 | - | - | 3870 | 2.410 | HF Probe | SCS | 2009.08-09 | (9)* |
| 93 | ZS22 | - | - | 3880 | 2.389 | HF Probe | SCS | 2009.08-09 | (9)* |
| 94 | ZS23 | - | - | 3880 | 2.412 | HF Probe | SCS | 2009.08-09 | (9)* |
| 95 | ZS24 | - | - | 3900 | 2.525 | HF Probe | SCS | 2009.08-09 | (9)* |
| 96 | ZS25 | - | - | 3917 | 2.543 | HF Probe | SCS | 2009.08-09 | (9)* |
| 97 | ZS26 | - | - | 3930 | 2.565 | HF Probe | SCS | 2009.08-09 | (9)* |
| 98 | ZS27 | - | - | 3937 | 2.528 | HF Probe | SCS | 2009.08-09 | (9)* |
| 99 | ZS28 | - | - | 3939 | 2.538 | HF Probe | SCS | 2009.08-09 | (9)* |
| 100 | ZS29 | - | - | 3947 | 2.562 | HF Probe | SCS | 2009.08-09 | (9)* |
| 101 | ZS30 | - | - | 3964 | 2.539 | HF Probe | SCS | 2009.08-09 | (9)* |
| 102 | ZS31 | - | - | 3967 | 2.540 | HF Probe | SCS | 2009.08-09 | (9)* |
| 103 | ZS32 | - | - | 3980 | 2.563 | HF Probe | SCS | 2009.08-09 | (9)* |
| 104 | ZS33 | - | - | 4006 | 2.544 | HF Probe | SCS | 2009.08-09 | (9)* |
| 105 | ZS34 | - | - | 4020 | 2.420 | HF Probe | SCS | 2009.08-09 | (9)* |
| 106 | ZS35 | - | - | 4038 | 2.546 | HF Probe | SCS | 2009.08-09 | (9)* |
| 107 | ZS36 | - | - | 4040 | 2.427 | HF Probe | SCS | 2009.08-09 | (9)* |
| 108 | ZS37 | - | - | 4046 | 2.553 | HF Probe | SCS | 2009.08-09 | (9)* |
| 109 | ZS38 | - | - | 4050 | 2.413 | HF Probe | SCS | 2009.08-09 | (9)* |
| 110 | ZS39 | - | - | 4057 | 2.551 | HF Probe | SCS | 2009.08-09 | (9)* |
| 111 | ZS40 | - | - | 4102 | 2.527 | HF Probe | SCS | 2009.08-09 | (9)* |
| 112 | ZS41 | - | - | 4170 | 2.395 | HF Probe | SCS | 2009.08-09 | (9)* |
| 113 | IODP349-U1431D | 117°0′0″E | 15°22′32″N | 4241 | 2.500 | IODP | SCS | 2014.02-03 | (Expedition 349 Scientists, 2014) |
| 114 | IODP349-U1432C | 116°23′27″E | 18°21′5″N | 3829 | 2.400 | IODP | SCS | 2014.02-03 | (Expedition 349 Scientists, 2014) |
| 115 | IODP349-U1433A | 115°2′50″E | 12°55′8″N | 4379 | 2.500 | IODP | SCS | 2014.02-03 | (Expedition 349 Scientists, 2014) |
| 116 | 630ht1b | 119°39′9″E | 22°19′0″N | 2006 | 2.792 | HF Probe | SCS | 2001.11 | (Shyu et al, 2006) |
| 117 | 630ht2 | 119°29′11″E | 22°10′25″N | 2006 | 2.576 | HF Probe | SCS | 2001.11 | (Shyu et al, 2006) |
| 118 | 630ht4 | 119°48′26″E | 22°9′43″N | 1307 | 3.093 | HF Probe | SCS | 2001.11 | (Shyu et al, 2006) |
| 119 | 630ht7 | 120°6′39″E | 21°57′4″N | 1469 | 3.023 | HF Probe | SCS | 2001.11 | (Shyu et al, 2006) |
| 120 | 630ht8 | 120°3′44″E | 21°57′3″N | 1341 | 3.037 | HF Probe | SCS | 2001.11 | (Shyu et al, 2006) |
| 121 | 698ht07 | 119°30′0″E | 21°47′24″N | 2756 | 3.036 | HF Probe | SCS | 2003.01 | (Shyu et al, 2006) |
| 122 | 680ht9-1 | 119°40′13″E | 21°44′55″N | 2908 | 2.229 | HF Probe | SCS | 2003.05 | (Shyu et al, 2006) |
| 123 | 680ht11 | 119°58′6″E | 21°50′48″N | 1730 | 2.387 | HF Probe | SCS | 2003.05 | (Shyu et al, 2006) |
| 124 | 680ht12 | 120°5′14″E | 21°53′11″N | 1663 | 2.541 | HF Probe | SCS | 2003.05 | (Shyu et al, 2006) |
| 125 | 680ht14 | 120°23′36″E | 21°59′32″N | 954 | 4.608 | HF Probe | SCS | 2003.05 | (Shyu et al, 2006) |
| 126 | 680ht19 | 119°53′59″E | 21°38′24″N | 3107 | 2.382 | HF Probe | SCS | 2003.05 | (Shyu et al, 2006) |
| 127 | 698ht30 | 119°20′20″E | 21°43′49″N | 2839 | 2.940 | HF Probe | SCS | 2003.01 | (Shyu et al, 2006) |
| 128 | 698ht41 | 119°33′44″E | 21°43′8″N | 2780 | 2.987 | HF Probe | SCS | 2003.01 | (Shyu et al, 2006) |
| 129 | 698ht44 | 119°54′43″E | 21°42′37″N | 2906 | 2.996 | HF Probe | SCS | 2003.01 | (Shyu et al, 2006) |
| 130 | 714ht2 | 119°58′49″E | 22°14′23″N | 948 | 4.462 | HF Probe | SCS | 2004.04 | (Shyu et al, 2006) |
| 131 | 714ht4 | 119°48′37″E | 22°5′27″N | 1660 | 2.632 | HF Probe | SCS | 2004.04 | (Shyu et al, 2006) |
| 132 | 714ht10 | 119°49′9″E | 21°47′41″N | 2477 | 2.356 | HF Probe | SCS | 2004.04 | (Shyu et al, 2006) |
| 133 | 714ht18 | 120°3′36″E | 21°41′33″N | 2781 | 2.371 | HF Probe | SCS | 2004.04 | (Shyu et al, 2006) |
| 134 | 714htg21 | 119°52′53″E | 22°15′12″N | 1312 | 3.355 | HF Probe | SCS | 2004.04 | (Shyu et al, 2006) |
| 135 | 714ht46 | 120°33′13″E | 21°31′6″N | 1799 | 2.583 | HF Probe | SCS | 2004.04 | (Shyu et al, 2006) |
| 136 | 714ht49 | 120°9′49″E | 21°27′16″N | 2887 | 2.355 | HF Probe | SCS | 2004.04 | (Shyu et al, 2006) |
| 137 | 714ht50 | 120°3′1″E | 21°26′3″N | 2884 | 2.349 | HF Probe | SCS | 2004.04 | (Shyu et al, 2006) |
| 138 | 714ht53 | 119°43′5″E | 21°22′51″N | 3209 | 2.453 | HF Probe | SCS | 2004.04 | (Shyu et al, 2006) |
| 139 | NS01 | - | - | 1602 | 2.800 | HF Probe | SCS | 2014.06 | * |
| 140 | NS02 | - | - | 2836 | 2.563 | HF Probe | SCS | 2014.06 | * |
| 141 | NS03 | - | - | 2469 | 2.554 | HF Probe | SCS | 2014.06 | * |
| 142 | NS04 | - | - | 1642 | 2.778 | HF Probe | SCS | 2014.06 | * |
| 143 | NS05 | - | - | 2275 | 2.582 | HF Probe | SCS | 2014.06 | * |
| 144 | NS06 | - | - | 1554 | 2.876 | HF Probe | SCS | 2014.06 | * |
| 145 | NS07 | - | - | 1987 | 2.581 | HF Probe | SCS | 2014.06 | * |
| 146 | NS08 | - | - | 1726 | 2.721 | HF Probe | SCS | 2014.06 | * |
| 147 | NS09 | - | - | 1888 | 2.665 | HF Probe | SCS | 2014.06 | * |
| 148 | NS10 | - | - | 908 | 5.096 | HF Probe | SCS | 2014.06 | * |
| 149 | NS11 | - | - | 4359 | 2.507 | HF Probe | SCS | 2014.06 | * |
| 150 | NS12 | - | - | 3017 | 2.370 | HF Probe | SCS | 2014.06 | * |
| 151 | NS13 | - | - | 1481 | 3.028 | HF Probe | SCS | 2014.06 | * |
| 152 | NS14 | - | - | 1755 | 2.672 | HF Probe | SCS | 2014.06 | * |
| 153 | NS15 | - | - | 1761 | 2.667 | HF Probe | SCS | 2014.06 | * |
| 154 | NS16 | - | - | 2100 | 2.550 | HF Probe | SCS | 2014.06 | * |
| 155 | NS17 | - | - | 1709 | 2.786 | HF Probe | SCS | 2014.06 | * |
| 156 | NS18 | - | - | 1715 | 2.698 | HF Probe | SCS | 2014.06 | * |
| 157 | NS19 | - | - | 1227 | 3.478 | HF Probe | SCS | 2014.06 | * |
| 158 | NS20 | - | - | 2906 | 2.567 | HF Probe | SCS | 2014.06 | * |
| 159 | Ind2010HF01a | 91°0′21″E | 10°0′44″N | 3460 | 1.373 | HF Probe | EIO | 2010.04 | (10) |
| 160 | Ind2010HF01b | 91°0′18″E | 10°0′34″N | 3460 | 1.373 | HF Probe | EIO | 2010.04 | (10) |
| 161 | Ind2010HF02 | 90°39′25″E | 10°0′5″N | 3360 | 1.362 | HF Probe | EIO | 2010.04 | (10) |
| 162 | Ind2010HF04 | 89°59′49″E | 10°0′16″N | 3303 | 1.335 | HF Probe | EIO | 2010.04 | (10) |
| 163 | Ind2010HF05 | 89°29′14″E | 10°0′6″N | 3340 | 1.452 | HF Probe | EIO | 2010.04 | (10) |
| 164 | Ind2010HF06 | 89°0′2″E | 10°0′19″N | 3368 | 1.491 | HF Probe | EIO | 2010.04 | (10) |
| 165 | Ind2010HF07a | 88°29′20″E | 9°59′44″N | 3400 | 1.479 | HF Probe | EIO | 2010.04 | (10) |
| 166 | Ind2010HF07b | 88°29′13″E | 9°59′48″N | 3400 | 1.478 | HF Probe | EIO | 2010.04 | (10) |
| 167 | Ind2010HF07c | 88°29′8″E | 9°59′54″N | 3400 | 1.477 | HF Probe | EIO | 2010.04 | (10) |
| 168 | Ind2010HF08 | 87°59′43″E | 9°59′16″N | 3412 | 1.486 | HF Probe | EIO | 2010.04 | (10) |
| 169 | Ind2010HF09 | 86°57′13″E | 10°2′60″N | 3472 | 1.484 | HF Probe | EIO | 2010.04 | (10) |
| 170 | Ind2013HF01 | 98°29′54″E | 6°59′47″S | 4852 | 1.143 | HF Probe | EIO | 2013.04 | (11) |
| 171 | Ind2013HF02 | 97°46′3″E | 6°1′11″S | 5725 | 1.252 | HF Probe | EIO | 2013.04 | (11) |
| 172 | Ind2013HF04 | 95°19′3″E | 2°57′26″S | 4810 | 1.150 | HF Probe | EIO | 2013.04 | (11) |
| 173 | Ind2013HF05 | 94°20′11″E | 1°25′32″S | 4617 | 1.144 | HF Probe | EIO | 2013.04 | (11) |
| 174 | Ind2013HF06 | 93°48′53″E | 0°27′53″S | 4527 | 1.151 | HF Probe | EIO | 2013.04 | (11) |
| 175 | Ind2013HF07 | 90°57′19″E | 0°0′30″N | 4532 | 1.149 | HF Probe | EIO | 2013.04 | (11) |
| 176 | 49MR03K04_5_I03-458 | 107°30′20″E | 20°0′2″S | 5391 | 1.187 | CTD | EIO | 2004.01 | (12)† |
| 177 | 49MR03K04_5_I03-459 | 106°37′29″E | 19°59′46″S | 5527 | 1.187 | CTD | EIO | 2004.01 | (12)† |
| 178 | 49MR03K04_5_I03-460 | 105°45′30″E | 19°59′34″S | 5305 | 1.151 | CTD | EIO | 2004.01 | (12)† |
| 179 | 49MR03K04_5_I03-462 | 104°0′37″E | 19°59′40″S | 5479 | 1.196 | CTD | EIO | 2004.01 | (12)† |
| 180 | 49MR03K04_5_I03-464 | 102°14′34″E | 19°59′50″S | 6052 | 1.237 | CTD | EIO | 2004.01 | (12)† |
| 181 | 49MR03K04_5_I03-468 | 98°42′58″E | 19°59′59″S | 6305 | 1.258 | CTD | EIO | 2004.01 | (12)† |
| 182 | 49MR03K04_5_I03-470 | 96°57′12″E | 19°59′28″S | 5339 | 1.124 | CTD | EIO | 2004.01 | (12)† |
| 183 | 49MR03K04_5_I03-473 | 94°18′29″E | 19°59′53″S | 5133 | 1.107 | CTD | EIO | 2004.01 | (12)† |
| 184 | 49MR03K04_5_I03-474 | 93°31′58″E | 19°59′28″S | 5325 | 1.143 | CTD | EIO | 2004.01 | (12)† |
| 185 | 49MR03K04_5_I03-475 | 92°48′16″E | 19°59′41″S | 5081 | 1.124 | CTD | EIO | 2004.01 | (12)† |
| 186 | 49MR03K04_5_I03-476 | 92°21′27″E | 19°59′48″S | 5130 | 1.123 | CTD | EIO | 2004.01 | (12)† |
| 187 | 49MR03K04_5_I03-477 | 91°48′54″E | 19°59′48″S | 5028 | 1.110 | CTD | EIO | 2004.01 | (12)† |
| 188 | 49MR03K04_5_I03-X09 | 95°0′44″E | 20°11′42″S | 5273 | 1.130 | CTD | EIO | 2004.01 | (12)† |
| 189 | KR09-16HF03A | 145°3′13″E | 39°0′5″N | 5510 | 1.557 | HF Probe | NWPO | 2009.11 | (13) |
| 190 | KR09-16HFPC01 | 145°14′55″E | 38°59′38″N | 5405 | 1.548 | HF Probe | NWPO | 2009.11 | (13) |
| 191 | KR09-16HFPC02 | 144°35′37″E | 38°4′54″N | 5750 | 1.591 | HF Probe | NWPO | 2009.11 | (13) |
| 192 | KR09-167KⅡ#461 | 145°40′24″E | 40°15′12″N | 5216 | 1.527 | CTD_ROV | NWPO | 2009.11 | (13) |
| 193 | KR09-167KⅡ#462 | 145°40′24″E | 40°15′12″N | 5216 | 1.525 | CTD_ROV | NWPO | 2009.11 | (13) |
| 194 | KR09-167KⅡ#463 | 144°35′45″E | 38°4′48″N | 5741 | 1.584 | CTD_ROV | NWPO | 2009.11 | (13) |
| 195 | IODP316-C0007A | 136°47′57″E | 33°1′14″N | 4081 | 1.650 | IODP | WPO | 2007.09-2008.02 | (Kimura et al, 2008) |
| 196 | IODP332-C0010A | 136°41′12″E | 32°12′36″N | 2552 | 1.700 | IODP | WPO | 2010.10-12 | (Kopf et al, 2011) |
| 197 | IODP337-C0020A | 142°12′2″E | 41°10′36″N | 1180 | 3.600 | IODP | NWPO | 2012.07-09 | (Inagaki et al, 2012) |
| 198 | IODP343-C0022D | 143°54′48″E | 37°56′19″N | 6898 | 1.700 | IODP | NWPO | 2012.04-05 | (Chester et al, 2012) |
| 199 | HPD0940HDDB103 | 139°13′0″E | 35°4′60″N | 920 | 3.675 | ROV | WPO | 2008.12.23 | (14)‡ |
| 200 | KAIKO0647C2HDF101 | 153°15′13″E | 22°38′59″N | 4055 | 1.470 | ROV | WPO | 2015.02.07 | (15)‡ |
| 201 | KAIKO0648C2HDF101 | 135°6′39″E | 19°19′26″N | 5682 | 1.755 | ROV | WPO | 2015.02.23 | (16)‡ |
| 202 | KAIKO0650C2HDF102 | 134°56′42″E | 32°21′13″N | 4665 | 1.642 | ROV | WPO | 2015.03.04 | (17)‡ |
| 203 | MT2016-P1 | 142°42′34″E | 10°42′51″N | 5441 | 1.528 | OBS | WPO | 2016.11-12 | (18) |
| 204 | MT2016-P2 | 142°37′11″E | 10°48′59″N | 5693 | 1.560 | OBS | WPO | 2016.11-12 | (18) |
| 205 | MT2016-P4 | 142°26′24″E | 11°1′14″N | 7015 | 1.758 | OBS | WPO | 2016.11-12 | (18) |
| 206 | MT2016-P6 | 142°2′30″E | 11°28′33″N | 7520 | 1.830 | OBS | WPO | 2016.11-12 | (18) |
| 207 | MT2016-P7 | 141°57′7″E | 11°34′41″N | 6114 | 1.664 | OBS | WPO | 2016.11-12 | (18) |
| 208 | MT2016-P8 | 141°51′44″E | 11°40′49″N | 5337 | 1.530 | OBS | WPO | 2016.11-12 | (18) |
| 209 | MT2016-P9 | 141°46′21″E | 11°46′58″N | 4567 | 1.520 | OBS | WPO | 2016.11-12 | (18) |
| 210 | MT2016-P10 | 141°40′57″E | 11°53′6″N | 2667 | 1.593 | OBS | WPO | 2016.11-12 | (18) |
| 211 | MT2016-P11 | 141°35′33″E | 11°59′14″N | 1665 | 2.197 | OBS | WPO | 2016.11-12 | (18) |
| 212 | MT2016-P13 | 141°24′45″E | 12°11′30″N | 4171 | 1.591 | OBS | WPO | 2016.11-12 | (18) |
| 213 | MT2016-P14 | 141°19′20″E | 12°17′37″N | 5526 | 1.691 | OBS | WPO | 2016.11-12 | (18) |
| 214 | MT2016-P17 | 141°3′5″E | 12°35′60″N | 2724 | 1.697 | OBS | WPO | 2016.11-12 | (18) |
| 215 | MT2016-PA05 | 141°29′59″E | 12°33′2″N | 3223 | 1.647 | OBS | WPO | 2016.11-12 | (18) |
| 216 | MT2016-PA06 | 141°45′39″E | 12°14′3″N | 2121 | 2.017 | OBS | WPO | 2016.11-12 | (18) |
| 217 | MT2016-PA07 | 142°1′27″E | 11°56′8″N | 4889 | 1.502 | OBS | WPO | 2016.11-12 | (18) |
| 218 | MT2016-PA08 | 141°35′26″E | 11°33′59″N | 5582 | 1.569 | OBS | WPO | 2016.11-12 | (18) |
| 219 | MT2016-PA09 | 141°16′22″E | 11°55′57″N | 3839 | 1.535 | OBS | WPO | 2016.11-12 | (18) |
| 220 | MT2016-PA10 | 140°57′14″E | 12°16′14″N | 3521 | 1.574 | OBS | WPO | 2016.11-12 | (18) |
| 221 | MT2016-PA11 | 140°55′51″E | 11°58′20″N | 4205 | 1.520 | OBS | WPO | 2016.11-12 | (18) |
| 222 | WPO-CTD-02 | - | - | 1736 | 2.411 | CTD | WPO | 2015.06 | * |
| 223 | WPO-CTD-03 | - | - | 1527 | 2.776 | CTD | WPO | 2015.06 | * |
| 224 | WPO-CTD-04 | - | - | 1771 | 2.345 | CTD | WPO | 2015.06 | * |
| 225 | WPO-CTD-05 | - | - | 2084 | 1.969 | CTD | WPO | 2015.06 | * |
Appendix 1
| [1] | BROECKER W, 2010. The great ocean conveyor: discovering the trigger for abrupt climate change [M]. Oxford: Princeton University Press. |
| [2] | CHESTER F M, MORI J J, TOCZKO S, et al, 2012. Japan trench fast drilling project (JFAST)[R]//Integrated Ocean Drilling Program Management International, Inc. International Ocean Discovery Expedition Preliminary Report, 343/343T. doi: 10.2204/iodp.pr.343343T.2012. . |
| [3] | EXPEDITION 349 SCIENTISTS, 2014. South China Sea tectonics: opening of the South China Sea and its implications for southeast Asian tectonics, climates, and deep mantle processes since the late Mesozoic [R] //Integrated Ocean Drilling Program Management International, Inc. International Ocean Discovery Program Preliminary Report, 349. http://dx.doi.org/ 10.14379/iodp.pr.349.2014. . |
| [4] | FUKASAWA M, KAWANO T, 2014. MR03-K04 Leg. 5 Preliminary Cruise Report [R]. . |
| [5] | GORDON A L, 1971. Oceanography of Antarctic waters[M] //REID J L. Antarctic Oceanology I (Vol. 15): Antarctic Research Series. Washington, DC: Antarctic Research Series: 169-203. |
| [6] | GORDON A L, 1972. Spreading of Antarctic Bottom Waters, II[M]//Studies in Physical Oceanography—A Tribute of George Wüst on his 80th Birthday (Vol. II). New York: Gordon and Breach: 1-17. |
| [7] | HAMAMOTO H, YAMANO M, GOTO S, et al, 2011. Heat flow distribution and thermal structure of the Nankai subduction zone off the Kii Peninsula[J]. Geochemistry, Geophysics, Geosystems, 12(10): Q0AD20. doi: 10.1029/2011GC003623. |
| [8] | HAMILTON E L, 1970. Sound velocity and related properties of marine sediments, North Pacific[J]. Journal of Geophysical Research, 75(23): 4423-4446. |
| [9] | HAMILTON E L, 1971. Prediction of in-situ acoustic and elastic properties of marine sediments[J]. Geophysics, 36(2): 266-284. |
| [10] | INAGAKI F, HINRICHS K U, KUBO Y, et al, 2012. Deep coalbed biosphere off Shimokita: microbial processes and hydrocarbon system associated with deeply buried coalbed in the ocean[R]//Integrated Ocean Drilling Program Management International, Inc. International Ocean Discovery Expedition Preliminary Report , 337. doi: 10.2204/iodp.pr.337.2012. . |
| [11] | JACOBS S S, AMOS A F, BRUCHHAUSEN P M, 1970. Ross Sea oceanography and Antarctic bottom water formation[J]. Deep Sea Research and Oceanographic Abstracts, 17(6): 935-962. |
| [12] | KIMURA G, SCREATON E J, CUREWITZ D, et al, 2008. NanTroSEIZE Stage 1A: NanTroSEIZE shallow megasplay and frontal thrusts [R] //Integrated Ocean Drilling Program Management International, Inc. International Ocean Discovery Expedition Preliminary Report, 316. doi: 10.2204/iodp.pr.316.2008. . |
| [13] | KOPF A, ARAKI E, TOCZKO S, et al, 2011. NanTroSEIZE Stage 2: riserless observatory [R] //Integrated Ocean Drilling Program Management International, Inc. International Ocean Discovery Expedition Preliminary Report, 332. doi: 10.2204/iodp.pr.332.2011. . |
| [14] | ORSI A H, JOHNSON G C, BULLISTER J L, 1999. Circulation, mixing, and production of Antarctic Bottom Water[J]. Progress in Oceanography, 43(1): 55-109. |
| [15] | QIN YANGYANG, YANG XIAOQIU, WU BAOZHEN, et al.2013. High resolution temperature measurement technique for measuring marine heat flow[J]. Science China Technological Sciences, 56(7): 1773-1778. doi: 10.1007/s11431-013-5239-9. |
| [16] | SHI XIAOBIN, WANG ZHENFENG, JIANG HAIYAN, et al, 2015. Vertical variations of geothermal parameters in rifted basins and heat flow distribution features of the Qiongdongnan Basin[J]. Chinese Journal of Geophysics, 58(3): 939-952 (in Chinese). |
| [17] | SHI XIAOBIN, ZHOU DI, QIU XUELIN, et al, 2002. Thermal and rheological structures of the Xisha Trough, South China Sea[J]. Tectonophysics, 351(4): 285-300. |
| [18] | SHYU C T, CHEN Y J, CHIANG S T, et al, 2006. Heat flow measurements over bottom simulating reflectors, offshore southwestern Taiwan[J]. Terrestrial, Atmospheric and Oceanic Sciences, 17(4): 845-869. |
| [19] | SPINELLI G A, HARRIS R N, 2011. Thermal effects of hydrothermal circulation and seamount subduction: Temperatures in the Nankai Trough Seismogenic Zone Experiment transect, Japan[J]. Geochemistry, Geophysics, Geosystems, 12(12): Q0AD21. doi: 10.1029/2011GC003727. |
| [20] | STOLL R D, 1977. Acoustic waves in ocean sediments[J]. Geophysics, 42(4): 715-725. |
| [21] | TAIRA K, YANAGIMOTO D, KITAGAWA S, 2005. Deep CTD casts in the challenger deep, Mariana Trench[J]. Journal of Oceanography, 61(3): 447-454. |
| [22] | UCHIDA H, FUKASAWA M, 2005. WHP P6, A10, I3/I4 REVISIT DATA BOOK, blue earth global expedition 2003[M]. Aiwa, Tokyo. . |
| [23] | WESSEL P, SMITH W H, 1995. New version of the generic mapping tools, Eos, Transactions American Geophysical Union, 76(33), 329-329. doi: 10.1029/95EO00198.. |
| [24] | XUE WANJUN, HUO CHUNLAN, SI GUIXIAN, et al, 1991. Late quaternary paleoclimate and paleoceanography on the northern South China Sea[J]. Research of Geological South China Sea, (4): 1-96 (in Chinese). |
| [25] | YANG XIAOQIU, LIN WEIREN, TADAI OSAMU, et al, 2017. Experimental and numerical investigation of the temperature response to stress changes of rocks[J]. Journal of Geophysical Research: Solid Earth, 122(7): 5101-5117. doi: 10.1002/2016JB013645. |
| [26] | YUAN YUSONG, 2007. Tectono-thermal evolution and source rock maturation history in deep water area of the northern margin of the South China Sea [D]. Beijing: Institute of Geology and Geophysics, Graduate University of Chinese Academy of Sciences (in Chinese). |
| [27] | ZOU DAPENG, WU BEIHAI, LU BO, et al, 2008. A study on correction of acoustic velocity in seafloor sediments measured in laboratory[J]. Journal of Tropical Oceanography, 27(1): 27-31 (in Chinese). |
| [1] | XU Chao, LONG Lijuan, LI Sha, YUAN Li, XU Xiaolu. Systematic reorganization of historical data of scientific investigation in the South China Sea and its affiliated islands and reefs 3. data sharing service and application [J]. Journal of Tropical Oceanography, 2024, 43(5): 158-165. |
| [2] | XU Chao, LONG Lijuan, LI Sha, HE Yunkai, YUAN Li, XU Xiaolu. Systematic reorganization of historical data of scientific investigation in the South China Sea and its affiliated islands and reefs 1. data reorganization technology and application [J]. Journal of Tropical Oceanography, 2024, 43(5): 143-149. |
| [3] | XU Chao, LONG Lijuan, LI Sha, XU Xiaolu, YUAN Li. Systematic reorganization of historical data of scientific investigation in the South China Sea and its affiliated islands and reefs 2. data curation and application [J]. Journal of Tropical Oceanography, 2024, 43(5): 150-157. |
| [4] | LIU Yuan, KE Zhixin, LI Kaizhi, TAN Yehui, LIANG Junce, ZHOU Weihua. Zooplankton community in the coastal waters of eastern Guangdong under the influence of human activities and ocean currents [J]. Journal of Tropical Oceanography, 2024, 43(4): 98-111. |
| [5] | LIU Didi, ZHANG Xiyang, SUN Fulin, WANG Mingzhuang, TAN Fei, SHI Qi, WANG Guan, YANG Hongqiang. Microbial communities and specific strains within beachrocks of the South China Sea: implications for the origin of beachrock* [J]. Journal of Tropical Oceanography, 2024, 43(4): 112-122. |
| [6] | JIANG Lyumiao, CHEN Tianran, ZHAO Kuan, ZHANG Ting, XU Lijia. Experimental study on bioerosion of marginal reefs in the Weizhou Island, northern South China Sea [J]. Journal of Tropical Oceanography, 2024, 43(3): 155-165. |
| [7] | XU Lijia, LIAO Zhiheng, CHEN Hui, WANG Yongzhi, HUANG Baiqiang, LIN Qiaoyun, GAN Jianfeng, YANG Jing. Community structure of scleractinian corals in the northern South China Sea and their responses to the marine heatwaves [J]. Journal of Tropical Oceanography, 2024, 43(3): 58-71. |
| [8] | ZHAO Minghui, YUAN Ye, ZHANG Jiazheng, ZHANG Cuimei, GAO Jinwei, WANG Qiang, SUN Zhen, CHENG Jinhui. New developments on the rift-breakup of the continent-ocean transition zone in the northern margin of the South China Sea [J]. Journal of Tropical Oceanography, 2024, 43(2): 173-183. |
| [9] | HUANG Yu, WANG Lin, MAI Zhimao, LI Jie, ZHANG Si. Isolation and characterization of sand fixation ability of bacteria in biological soil crusts of the tropical islands, South China Sea [J]. Journal of Tropical Oceanography, 2023, 42(6): 101-110. |
| [10] | WANG Chenyan, SHI Jingwen, YAN Annan, KANG Yaru, WANG Yuxuan, QIN Suli, HAN Minwei, ZHANG Ruijie, YU Kefu. Bioaccumulation characteristics and source apportionment of organophosphate esters in Acanthaster planci from the South China Sea [J]. Journal of Tropical Oceanography, 2023, 42(5): 30-37. |
| [11] | LI Niu, DI Pengfei, FENG Dong, CHEN Duofu. The impact of cold seepage on geochemical indices for redox conditions of marine sediments ―Site F active seep site in the northeastern South China Sea* [J]. Journal of Tropical Oceanography, 2023, 42(5): 144-153. |
| [12] | ZHANG Zhisheng, XIE Lingling, LI Junyi, LI Qiang. Comparative analysis of mesoscale eddy evolution during life cycle in marginal sea and open ocean: South China Sea and Kuroshio Extension [J]. Journal of Tropical Oceanography, 2023, 42(4): 63-76. |
| [13] | YANG Lei, WEN Jinhui, WANG Qiang, LUO Xi, HUANG Huaming, HE Yunkai, CHEN Ju. Recent research progress in the influence of tropical cyclones on the Luzon Strait transport* [J]. Journal of Tropical Oceanography, 2023, 42(3): 40-51. |
| [14] | ZHAO Zhongxian, SUN Zhen, MAO Yunhua, ZHANG Huodai. Heterogeneous extension and pulsed tectonic subsidence in the northern South China Sea margin* [J]. Journal of Tropical Oceanography, 2023, 42(3): 96-115. |
| [15] | LIU Qinyan, LI Wenlian, SHI Rui, CHEN Ju, LI Chunhui, XIE Qiang. The characteristics of eddy in western boundary current of South China Sea and its relationship with winter circulation [J]. Journal of Tropical Oceanography, 2023, 42(3): 52-66. |
|
||